

Abstract
Background
Among patients treated with percutaneous coronary intervention for chronic total occlusion (CTO‐PCI), patients on long‐term hemodialysis are at significantly high risk for cardiovascular mortality and morbidity. However, clinical or angiographic predictors that might aid in better patient selection remain unclear. We aimed to assess the acute impact of hemodialysis in patients who underwent CTO‐PCI.
Methods and Results
The Retrograde Summit registry is a multicenter, prospective registry of patients undergoing CTO‐PCI at 65 Japanese centers. Patient characteristics and procedural outcomes of 4749 patients were analyzed, according to the presence (n=313) or absence (n=4436) of baseline hemodialysis. A prediction model for technical failure among hemodialysis patients was also developed. The technical success rate of CTO‐PCI was significantly lower in hemodialysis than in nonhemodialysis patients (78.0% versus 89.1%, P<0.001). The rates of in‐hospital major adverse cardiac and cerebrovascular events were similar between the 2 groups (1.6% versus 0.9%, P=0.24). Irrespective of clinical/angiographic characteristics or previously developed scoring systems, hemodialysis independently predicted technical failure for CTO‐PCI. Among hemodialysis patients, predictors of technical failure were blunt stump (odds ratio 2.45, 95% confidence interval, 1.15–5.21, P=0.021), severe lesion calcification (odds ratio 2.50, 95% confidence interval, 1.19–5.24, P=0.015), and absence of diabetes mellitus (odds ratio 3.15, 95% confidence interval, 1.49–6.64, P=0.003). In hemodialysis patients without these predictors, the technical success rate was 96.2%.
Conclusions
Hemodialysis is significantly associated with technical failure. Contemporary CTO‐PCI seems feasible and safe in selected hemodialysis patients.
Keywords: chronic total coronary occlusion, hemodialysis, percutaneous coronary intervention
Subject Categories: Percutaneous Coronary Intervention
Clinical Perspective
What Is New?
Irrespective of clinical/angiographic characteristics or previously developed scoring systems, hemodialysis independently and strikingly predicted technical failure in percutaneous coronary intervention for chronic total occlusion.
What Are the Clinical Implications?
With regard to percutaneous coronary intervention for chronic total occlusion in hemodialysis patients, improvement in patient selection (as suggested in our article) would contribute to a higher technical success rate and wider use of complex percutaneous coronary intervention with dedicated devices and specialized techniques.
Introduction
Patients receiving regular hemodialysis are at high risk for cardiovascular mortality and morbidity.1 They have been largely excluded from any randomized evaluation of the comparative efficacy of coronary revascularization strategies, coronary artery bypass grafting, or percutaneous coronary intervention (PCI).
In general, percutaneous coronary revascularization is more complex and difficult to perform in hemodialysis patients2 than in nonhemodialysis patients because of greater calcification and medial thickness of the coronary plaque.3 Importantly, the presence of chronic total occlusion (CTO) is the strongest independent predictor of incomplete revascularization in patients undergoing PCI.4 Among hemodialysis patients, the proportion of coronary revascularization of target CTO lesions has been reported to be as high as 20%.5 Recent observational reports6, 7, 8 have consistently shown the long‐term survival advantage of coronary artery bypass grafting (CABG) compared with PCI in hemodialysis patients, but this could be explained not only by a difference in the completeness of revascularization between the 2 techniques but also by inappropriate patient selection and a lack of awareness of the technical limitations of PCI. Despite the improvement in procedural outcomes of CTO‐PCI,9, 10 only limited information has been published regarding the procedures of CTO‐PCI in hemodialysis patients.
In this study, we assessed the impact of chronic hemodialysis on the procedural results and characteristics of contemporary CTO‐PCI using dedicated devices and specialized techniques in a large cohort of patients enrolled in the Japanese Retrograde Summit registry.
Methods
Study Population
The Retrograde Summit registry is a multicenter, prospective, nonrandomized registry of patients who underwent CTO‐PCI at 65 Japanese centers between January 2012 and December 2015. Within this period, 5009 elective CTO‐PCIs were performed. The indication of CTO‐PCI or bypass grafting was determined by discussion among the heart team of each institution. Selection of procedural strategy was at the operator's discretion. The inclusion and exclusion criteria of the registry are described elsewhere.10 After exclusion of 260 patients because of missing information about their dialysis status, a total of 4749 patients were subjects of the analyses. The patients were divided into hemodialysis (n=313) and nonhemodialysis (n=4436) groups. Moreover, according to whether estimated glomerular filtration rate (eGFR) of the patient was <30 mL/min per 1.73 m2 or not, the nonhemodialysis group was divided into eGFR <30 (n=168) and eGFR ≥30 (n=4268) groups. All patients in the hemodialysis group had established end‐stage renal disease and had already been on hemodialysis before PCI. Patients with peritoneal dialysis were not included in the hemodialysis group.
Baseline patient characteristics, procedural details, and in‐hospital outcomes were recorded. Standard definitions of all patient‐related variables and clinical diagnoses were used. The techniques (Japanese CTO‐PCI style) used in the procedure have been described previously.10, 11 There was no centralized event adjudication and core laboratory assessment. All clinical events were reported by each operator who performed CTO‐PCI. This study was approved by the review board of each institution, and written informed consent was obtained from all patients.
Definitions
CTO was defined as complete occlusion with thrombolysis in myocardial infarction flow grade 0 antegrade through the affected segment >3 months in duration in the opinion of the operator based on clinical features, angiographic features, and/or previous imaging results. The eGFR was calculated by the modification of diet in renal disease formula.12 Left ventricular ejection fraction was measured by either contrast left ventriculography or echocardiography. Peripheral artery disease was regarded as present when carotid, aortic, or other peripheral artery disease was being treated or the patient was scheduled for surgical or endovascular intervention.
Angiographic morphology of the entry point was classified as “blunt” if the occluded segment did not end in a funnel‐tapered form. Lesion calcification was assigned to 1 of 3 categories: mild (spots), moderate (involving ≤50% of the reference lesion diameter), and severe (involving >50% of the reference lesion diameter). Lesion bending was defined as at least 1 bend of >45° assessed by angiography throughout the occluded segment. Proximal vessel tortuosity was defined as the presence of 1 bend of >70° in the CTO vessel. Occlusion length was categorized as either <20 or ≥20 mm. The collateral connection grade was classified as previously reported.13 The Multicenter CTO Registry in Japan (J‐CTO) score was calculated as described by Morino et al,14 and the Clinical and Lesion‐related (CL) score as described by Alessandrino et al.15
A procedure was defined as “retrograde” if an attempt was made at wiring through collateral arteries10; if not, the procedure was classified as “antegrade‐only.” A hard wire was defined as a guidewire with tip load >3 g. Participating centers were divided into high‐ (1 or more operators with >50 CTO‐PCI cases per year; highly experienced operator) and low‐volume centers (no such highly experienced operators) as described by Habara et al.16
Outcomes
Technical success was defined as crossing of a completely occluded lesion by both guidewire and balloon, resulting in successful dilation of the occluded artery, and restoration of thrombolysis in myocardial infarction grade 3 antegrade flow with <50% residual stenosis on final angiography. In‐hospital major adverse cardiac and cerebrovascular events (MACCE) included any of the following adverse events before hospital discharge: cardiac or noncardiac death, Q‐wave myocardial infarction, non‐Q‐wave myocardial infarction, symptomatic cerebrovascular disease, heart failure, emergency CABG and emergency target lesion revascularization. Myocardial infarction was defined as an increase in creatine kinase level to more than 2 times the upper limit of the normal value.
Statistical Analysis
The data were statistically analyzed by SPSS Statistics version 24 (IBM, Armonk, NY, USA) and Medcalc 11.1 statistical program (Medcalc, Gent, Belgium). Continuous values are expressed as means±standard deviation. Categorical data are presented as frequencies and percentages. Normality was evaluated by the Shapiro–Wilk test. Normally distributed values were compared by an unpaired t test, and non‐normally distributed values were compared by the Kruskal–Wallis rank test or the Mann–Whitney U test. Categorical data were compared by the χ2 test or Fisher exact test. We used logistic regression models to identify predictors of technical failure in overall CTO‐PCI by univariate and multivariate analysis with a forward stepwise algorithm and forced inclusion models. However, logistic regression analyses are sometimes difficult to apply directly to patients in daily clinical practice because of variation in the number, type, and severity of their comorbidities. Therefore, recursive partitioning analysis was also performed to develop a decision‐tree model, including significant predictors for the technical failure of overall CTO‐PCI in univariate logistic regression analysis. The process of generating classification trees consists of selecting the most discriminative variable (according to an impurity function) to partition the data, repeating this partition until the nodes are considered pure enough to be terminal, and pruning the resulting complete tree to avoid overfitting.17
Next, receiver operating characteristic curves for the developed scoring system to predict technical failure and changes in the area under the curve following inclusion of hemodialysis status were created according to the method of DeLong et al.18 Clinical and/or angiographic characteristics related to hemodialysis status may confound technical results. Therefore, we performed a propensity score–matched analysis to address this issue. Only limited information has been published regarding CTO‐PCI in hemodialysis patients. Hence, previous studies comparing coronary intervention procedures between hemodialysis and nonhemodialysis patients referred to select variables to derive propensity scores. A multicenter study in Japan using sirolimus‐eluting stents19 revealed that there was a higher prevalence of diabetes mellitus (DM), previous CABG, left ventricular ejection fraction <30%, multivessel disease, and lesion calcification in hemodialysis patients, whereas nonhemodialysis patients had a higher prevalence of hyperlipidemia and left anterior descending CTO. Age and the prevalence of hypertension did not differ between hemodialysis and nonhemodialysis patients. In a subanalysis of the CREDO‐Kyoto (Coronary REvascularization Demonstrating Outcome study in the Kyoto) PCI/CABG Registry assessing patients undergoing first coronary revascularization,20 hypertension, DM, left ventricular ejection fraction ≤40%, and 3‐vessel disease were found more often in hemodialysis patients than in nonhemodialysis patients, which included more patients with advanced age and hyperlipidemia. Observational data21, 22 are convincing in showing that hemodialysis patients have a high incidence of in‐stent restenosis, regardless of whether they have drug‐eluting stent or bare metal stent platforms, signaling the need for future revascularization. Incorporating the findings above, the following variables were used to estimate the propensity score for each patient: age, hyperlipidemia, DM, prior CABG, left ventricular ejection fraction <35%, multivessel disease, left anterior descending CTO, in‐stent occlusion, and severe lesion calcification. Hemodialysis patients were 1:1 matched with nonhemodialysis patients based on their propensity scores and a caliper value of 0.005 for analysis, with a final matched population of >250 patients in each group. The odds ratio of technical failure of CTO‐PCI was calculated from the propensity score–matched data using a binary conditional logistic regression model. In addition, univariate and multivariate logistic regression analyses among hemodialysis patients were also performed to determine predictors of technical failure in the hemodialysis group. Univariate variables with a P<0.1 were entered into the multivariate models. Finally, differences in the technical success rate based on the number of predictors for technical failure were compared among hemodialysis patients. For all analyses, P<0.05 were considered to indicate statistical significance.
Results
Patient Characteristics
The patients’ baseline clinical characteristics are shown in Table 1. Patients in the hemodialysis group had more cardiovascular comorbidities, such as left ventricular systolic dysfunction and peripheral artery disease as well as DM than patients in the nonhemodialysis groups, which included more patients with advanced age, hyperlipidemia, and smoking. There was the highest prevalence of prior CABG and prior PCI in the hemodialysis group.
Table 1.
Clinical Characteristics
| Hemodialysis Group | Nonhemodialysis Group | P Value | ||
|---|---|---|---|---|
| eGFR <30 | eGFR ≥30 | |||
| (n=313) | (n=168) | (n=4268) | ||
| Age, y | 66±9 | 72±9 | 68±11 | <0.001a |
| Male | 254 (81%) | 125 (74%) | 3595 (84%) | 0.011a |
| Hypertension | 251 (80%) | 139 (83%) | 3324 (78%) | 0.49 |
| Hyperlipidemia | 175 (56%) | 100 (60%) | 3061 (72%) | <0.001a |
| Diabetes mellitus | 208 (67%) | 97 (58%) | 1793 (42%) | <0.001a |
| Insulin treated | 73 (25%) | 27 (16%) | 231 (5%) | <0.001a |
| Smoker | 121 (39%) | 63 (38%) | 2083 (49%) | <0.001a |
| Family history | 37 (17%) | 20 (12%) | 581 (14%) | 0.20 |
| Prior MI | 122 (39%) | 76 (45%) | 1659 (39%) | 0.12 |
| Prior CABG | 54 (17%) | 27 (16%) | 299 (7%) | <0.001a |
| Prior PCI | 226 (72%) | 105 (63%) | 2525 (59%) | <0.001a |
| Cr, mg/dL | 7.7±3.8 | 5.6±12.7 | 0.9±0.2 | <0.001a |
| eGFR, mL/min per 1.73 m2 | 8.3±8.6 | 17.7±9.6 | 66.6±20.8 | <0.001a |
| LVEF | ||||
| <35% | 50 (17%) | 32 (20%) | 352 (9%) | <0.001a |
| 35% to 50% | 84 (29%) | 55 (35%) | 969 (24%) | |
| >50% | 161 (55%) | 70 (45%) | 2739 (67%) | |
| CCS | ||||
| 0 | 93 (31%) | 38 (24%) | 1226 (30%) | 0.001a |
| I | 84 (28%) | 33 (21%) | 1186 (29%) | |
| II | 102 (34%) | 57 (36%) | 1329 (33%) | |
| III | 15 (5%) | 23 (15%) | 245 (6%) | |
| IV | 6 (2%) | 7 (4%) | 86 (2%) | |
| Cerebrovascular disease | 18 (6%) | 5 (3%) | 238 (6%) | 0.34 |
| Peripheral vascular disease | 118 (38%) | 37 (22%) | 453 (11%) | <0.001a |
| COPD | 2 (1%) | 6 (4%) | 98 (2%) | 0.08 |
Values are presented as means±standard deviation or as numbers (percentages). CABG indicates coronary artery bypass grafting; CCS, Canadian Cardiovascular Society; COPD, chronic obstructive pulmonary disease; Cr, creatinine; eGFR, estimated glomerular filtration rate; LVEF, left ventricular ejection fraction; MI, myocardial infarction; PCI, percutaneous coronary intervention.
Indicates significant difference among the hemodialysis group, the nonhemodialysis group with eGFR <30, and the nonhemodialysis group with eGFR ≥30.
Comparisons of the angiographic characteristics of the 3 groups are summarized in Table 2. The prevalence of multivessel disease was the lowest in the nonhemodialysis group with eGFR ≥30. Patients with in‐stent occlusion were more often found in the hemodialysis group. The CTO target vessel was the most likely to be left anterior descending in the nonhemodialysis group with eGFR ≥30. The collateral channel grade was similar among the 3 groups. With the exception of blunt stump, the CTO lesions in the hemodialysis group had the most advanced angiographic findings, such as lesion calcification, lesion bending, proximal tortuosity, and occlusion length ≥20 mm. Both J‐CTO (2.24±1.02, 2.04±1.05, and 1.95±1.00 for the hemodialysis group, nonhemodialysis group with eGFR <30, and nonhemodialysis group with eGFR ≥30, respectively; P<0.001) and CL scores (3.63±1.79, 3.10±1.57, and 2.58±1.42; P<0.001) were the highest in the hemodialysis group.
Table 2.
Angiographic Characteristics
| Hemodialysis Group | Nonhemodialysis Group | P Value | ||
|---|---|---|---|---|
| eGFR <30 | eGFR ≥30 | |||
| (n=313) | (n=168) | (n=4268) | ||
| Multivessel disease | 215 (69%) | 123 (73%) | 2511 (59%) | <0.001a |
| CTO vessel | ||||
| Right | 175 (56%) | 99 (59%) | 1958 (46%) | <0.001a |
| Left anterior descending | 58 (19%) | 35 (21%) | 1384 (32%) | |
| Left circumferential | 79 (25%) | 34 (20%) | 898 (21%) | |
| Left main trunk | 0 (0%) | 0 (0%) | 12 (0.3%) | |
| In‐stent occlusion | 89 (28%) | 32 (19%) | 615 (14%) | <0.001a |
| Blunt stump | 174 (56%) | 91 (55%) | 2174 (52%) | 0.25 |
| Lesion calcification | ||||
| None | 31 (10%) | 30 (18%) | 840 (20%) | <0.001a |
| Mild | 66 (21%) | 68 (41%) | 2061 (49%) | |
| Moderate | 85 (27%) | 30 (18%) | 900 (21%) | |
| Severe | 131 (42%) | 38 (23%) | 419 (10%) | |
| Lesion bending | 50 (16%) | 20 (12%) | 346 (8%) | <0.001a |
| Proximal tortuosity | 61 (20%) | 22 (13%) | 457 (11%) | <0.001a |
| Occlusion length ≥20 mm | 163 (63%) | 70 (50%) | 2006 (56%) | 0.026a |
| Reattempted lesion | 32 (10%) | 24 (15%) | 403 (10%) | 0.11 |
| Collateral channel classification | ||||
| CC0 | 24 (10%) | 7 (5%) | 270 (8%) | 0.030a |
| CC1 | 146 (58%) | 96 (73%) | 2063 (60%) | |
| CC2 | 82 (33%) | 28 (21%) | 1114 (32%) | |
| J‐CTO score | 2.24±1.02 | 2.04±1.05 | 1.95±1.00 | <0.001a |
| CL score | 3.63±1.79 | 3.10±1.57 | 2.58±1.42 | <0.001a |
Values are presented as means±standard deviation or as numbers (percentages). CC indicates collateral channel; CL, clinical and lesion‐related; CTO, chronic total occlusion; eGFR, estimated glomerular filtration rate; J‐CTO, Multicenter CTO Registry in Japan.
Indicates significant difference among the hemodialysis group, the nonhemodialysis group with eGFR <30, and the nonhemodialysis group with eGFR ≥30.
Procedural Outcomes
The procedural outcomes in each group are shown in Figure 1 and Table 3. Among the 3 groups, the hemodialysis group had the lowest rates of technical success in overall procedures (78.0%, 88.7%, and 89.1%; P<0.001), antegrade‐only procedures (84.2%, 88.8%, and 92.1%; P<0.001), and retrograde procedures (61.2%, 88.5%, and 82.4%; P<0.001). The mean fluoroscopy time was the longest in the hemodialysis group (77±51, 69±44, and 69±47 minutes; P=0.014), whereas the mean procedure time, and mean air kerma radiation dose were similar among the 3 groups. The used contrast dose was the smallest in the nonhemodialysis group with eGFR <30 (224±109, 137±91, and 224±102 mL; P<0.001). The frequency of use of a hard wire was the highest in the hemodialysis group in overall procedures (55%, 41%, and 46%; P=0.007). In antegrade‐only and retrograde procedures, the techniques for successful guidewire crossing were similar among the 3 groups. In retrograde procedures, the successfully crossed collateral channel was different in the 3 groups, with the highest frequency of the septal channel in the hemodialysis group.
Figure 1.
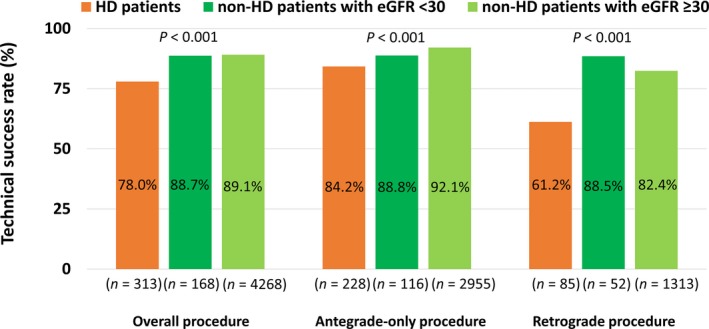
Comparison of technical success rates of CTO‐PCI between HD and non‐HD patients. CTO indicates chronic total occlusion; eGFR, estimated glomerular filtration rate; HD, hemodialysis; PCI, percutaneous coronary intervention.
Table 3.
Procedural Characteristics of CTO‐PCI
| Hemodialysis Group | Nonhemodialysis Group | P Value | ||
|---|---|---|---|---|
| eGFR <30 | eGFR ≥30 | |||
| Overall procedure | (n=313) | (n=168) | (n=4268) | |
| Use of a hard wire | 55% | 41% | 46% | 0.007a |
| Number of stents | 1.8±0.8 | 1.8±0.8 | 1.9±0.9 | 0.23 |
| Total stent length, mm | 51±27 | 51±26 | 53±26 | 0.31 |
| Air kerma, mGy | 4917±3707 | 4194±3816 | 4617±4186 | 0.29 |
| Procedure time, min | 162±87 | 153±87 | 151±87 | 0.15 |
| Fluoroscopy time, min | 77±51 | 69±44 | 69±47 | 0.014a |
| Contrast dose, mL | 224±109 | 137±91 | 224±102 | <0.001a |
| Antegrade‐only procedure | (n=228) | (n=116) | (n=2955) | |
| Use of a hard wire | 53% | 40% | 45% | 0.072 |
| Technique for successful GW crossing | ||||
| Single wire success | 84% | 84% | 83% | 0.78 |
| Parallel GW technique success | 15% | 13% | 15% | |
| IVUS‐guided technique success | 1% | 3% | 2% | |
| Retrograde procedure | (n=85) | (n=52) | (n=1313) | |
| Use of an antegrade hard wire | 72% | 43% | 52% | 0.12 |
| Use of a retrograde hard wire | 42% | 38% | 33% | 0.64 |
| Attempted collateral channel | ||||
| Septal | 77% | 60% | 65% | 0.061 |
| Epicardial | 13% | 29% | 29% | 0.009a |
| Bypass graft | 8% | 8% | 4% | 0.19 |
| Atrial | 0% | 0% | 0.4% | 0.77 |
| Ipsilateral | 3% | 2% | 3% | 0.89 |
| Successfully crossed collateral channel | ||||
| Septal | 83% | 61% | 66% | 0.025a |
| Epicardial | 4% | 26% | 20% | |
| Bypass graft | 9% | 7% | 4% | |
| Atrial | 3% | 5% | 7% | |
| Ipsilateral | 1% | 2% | 2% | |
| Technique for successful GW crossing | ||||
| Retrograde wire cross success | 35% | 23% | 28% | 0.48 |
| Kissing wire technique success | 11% | 23% | 13% | |
| Reverse CART technique success | 52% | 54% | 59% | |
| CART technique success | 2% | 0% | 1% | |
Values are presented as means±standard deviation (SD) or as percentages. CART indicates controlled antegrade and retrograde subintimal tracking; CTO, chronic total occlusion; eGFR, estimated glomerular filtration rate; GW, guidewire; IVUS, intravascular ultrasonography; PCI, percutaneous coronary intervention.
Indicates significant difference among the hemodialysis group, the nonhemodialysis group with eGFR <30, and the nonhemodialysis group with eGFR ≥30.
As shown in Table 4, the rates of in‐hospital MACCE of the nonhemodialysis group with eGFR <30 was the highest (1.6%, 3.0%, and 0.8%; P=0.013). However, the rates of in‐hospital MACCE and complications in the hemodialysis group were comparable with those in the nonhemodialysis groups. The reasons for technical failure are presented in Table 5. Among patients treated with antegrade‐only procedures, the reasons for technical failure did not differ among the 3 groups. However, among patients treated with retrograde procedures, the reasons for technical failure differed, with the highest rate of failure of the guidewire to cross the CTO lesion (72%, 17%, and 34%) and the lowest rate of collateral channel crossing failure (22%, 67%, and 51%) in the hemodialysis group than in the nonhemodialysis groups.
Table 4.
In‐Hospital MACCE and Complications
| Hemodialysis Group | Nonhemodialysis Group | P Value | ||
|---|---|---|---|---|
| eGFR <30 | eGFR ≥30 | |||
| (n=313) | (n=168) | (n=4268) | ||
| In‐hospital MACCE | 5 (1.6%) | 5 (3.0%) | 36 (0.8%) | 0.013a |
| Cardiac death | 0 (0%) | 2 (1.2%) | 8 (0.2%) | 0.07 |
| Noncardiac death | 2 (0.6%) | 1 (0.6%) | 11 (0.3%) | 0.19 |
| Q‐wave MI | 1 (0.3%) | 1 (0.6%) | 4 (0.1%) | 0.12 |
| Non Q‐wave MI | 1 (0.3%) | 0 (0%) | 4 (0.1%) | 0.41 |
| Symptomatic cerebrovascular disease | 1 (0.3%) | 1 (0.6%) | 6 (0.1%) | 0.19 |
| Heart failure | 0 (0%) | 0 (0%) | 0 (0%) | ··· |
| Emergency CABG | 0 (0%) | 0 (0%) | 3 (0.1%) | 1.00 |
| Emergency TLR | 0 (0%) | 0 (0%) | 0 (0%) | ··· |
| Others | ||||
| Cardiac tamponade | 0 (0%) | 2 (1.2%) | 14 (0.3%) | 0.06 |
| Coronary perforation | 7 (2.2%) | 4 (2.4%) | 90 (2.1%) | 0.96 |
| Stent thrombosis | 2 (0.6%) | 1 (0.6%) | 6 (0.1%) | 0.055 |
| Access site bleeding | 3 (1.0%) | 2 (1.2%) | 15 (0.4%) | 0.07 |
| Blood transfusion | 0 (0%) | 0 (0%) | 2 (0.0%) | 1.00 |
Values are presented as numbers (percentages). CABG indicates coronary artery bypass grafting; eGFR, estimated glomerular filtration rate; MACCE, major adverse cardiac and cerebrovascular events; MI, myocardial infarction; TLR; target lesion revascularization.
Indicates significant difference among the hemodialysis group, the nonhemodialysis group with eGFR <30, and the nonhemodialysis group with eGFR ≥30.
Table 5.
Reasons for Technical Failure
| Hemodialysis Group | Nonhemodialysis Group | P Value | ||
|---|---|---|---|---|
| eGFR <30 | eGFR ≥30 | |||
| Overall procedure | (n=69) | (n=19) | (n=465) | |
| Failure of GW to cross CTO | 71% | 58% | 58% | 0.42 |
| Failure of devices to cross CTO | 10% | 5% | 7% | |
| Insufficient dilatation or run‐off artery | 0% | 0% | 0.4% | |
| Complication during the procedure | 6% | 11% | 7% | |
| Main branch occlusion because of false lumen created by GW | 2% | 0% | 0.2% | |
| Collateral channel crossing failure | 10% | 21% | 25% | |
| Others | 2% | 0% | 1% | |
| Antegrade‐only procedures | (n=36) | (n=13) | (n=234) | |
| Failure of GW to cross CTO | 69% | 83% | 84% | 0.78 |
| Failure of devices to cross CTO | 19% | 8% | 10% | |
| Insufficient dilatation or run‐off artery | 0% | 0% | 0.4% | |
| Complication during the procedure | 8% | 8% | 4% | |
| Main branch occlusion because of false lumen created by GW | 0% | 0% | 0.4% | |
| Others | 3% | 0% | 1% | |
| Retrograde procedure | (n=33) | (n=6) | (n=231) | |
| Failure of GW to cross CTO | 72% | 17% | 34% | 0.006a |
| Failure of devices to cross CTO | 0% | 0% | 4% | |
| Insufficient dilatation or run‐off artery | 0% | 0% | 0.4% | |
| Complication during the procedure | 3% | 17% | 10% | |
| Main branch occlusion because of false lumen created by GW | 3% | 0% | 0% | |
| Collateral channel crossing failure | 22% | 67% | 51% | |
| Others | 0% | 0% | 0.4% | |
Values are presented as percentages. CTO indicates chronic total occlusion; eGFR, estimated glomerular filtration rate; GW, guidewire.
Indicates significant difference among the hemodialysis group, the nonhemodialysis group with eGFR <30, and the nonhemodialysis group with eGFR ≥30.
Figure 2 shows comparisons of the technical success rate of CTO‐PCI between high‐ and low‐volume centers according to hemodialysis status. When evaluating all patients or nonhemodialysis patients only, the technical success rate of higher volume centers was significantly higher than lower volume centers. However, in hemodialysis patients, the technical success rate did not differ between higher and lower volume centers.
Figure 2.
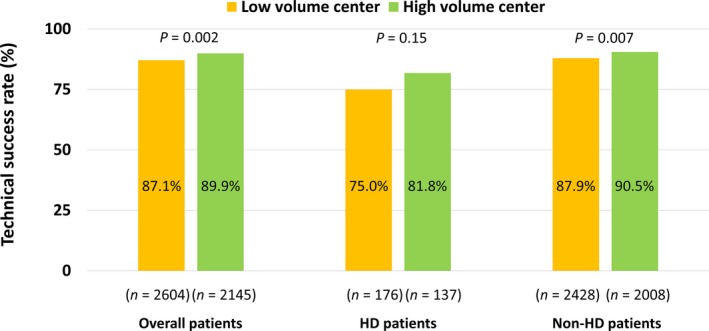
Comparisons of technical success rates of CTO‐PCI between high‐ and low‐volume centers. CTO, chronic total occlusion; HD, hemodialysis; PCI, percutaneous coronary intervention.
Predictors of Technical Failure
Multivariate analyses using a forward stepwise algorithm revealed that the significant and independent predictors of technical failure in overall CTO‐PCI were hemodialysis (odds ratio [OR] 2.02, 95% confidence interval [CI], 1.27–3.21, P=0.003), hypertension (OR 1.42, 95% CI, 1.04–1.94, P=0.028), non–left anterior descending CTO (OR 1.35, 95% CI, 1.01–1.80, P=0.043), non‐in‐stent occlusion (OR 1.74, 95% CI, 1.18–2.57, P=0.005), blunt stump (OR 1.68, 95% CI, 1.32–2.14, P<0.001), severe lesion calcification (OR 2.32, 95% CI, 1.73–3.11, P<0.001), lesion bending (OR 1.46, 95% CI, 1.04–2.05, P=0.031), proximal tortuosity (OR 1.30, 95% CI, 1.02–1.67, P=0.038), and reattempt (OR 1.47, 95% CI, 1.03–2.09, P=0.033) (Table 6, Model 1). The significance of hemodialysis as a predictor of technical failure in overall CTO‐PCI remained in each of the forced inclusion models with J‐CTO and CL scores (Table 6, Models 2 and 3). Meanwhile, eGFR was not associated with technical failure.
Table 6.
Univariate and Multivariate Logistic Regression Analyses for Technical Failure of Overall CTO‐PCI
| Factor | Univariate Analysis | Multivariate Model 1 | Multivariate Model 2 | Multivariate Model 3 | ||||
|---|---|---|---|---|---|---|---|---|
| OR (95% CI) | P Value | OR (95% CI) | P Value | OR (95% CI) | P Value | OR (95% CI) | P Value | |
| Hemodialysis | 2.31 (1.74–3.07)a | <0.001a | 2.02 (1.27–3.21)a | 0.003a | 2.11 (1.58–2.82)a | <0.001a | 1.76 (1.31–2.36)a | <0.001a |
| Age, per y | 1.00 (1.00–1.01) | 0.361 | ||||||
| Sex, male | 0.92 (0.73–1.17) | 0.512 | ||||||
| Hypertension | 1.36 (1.07–1.72)a | 0.011a | 1.42 (1.04–1.94)a | 0.028a | ||||
| Hyperlipidemia | 0.98 (0.81–1.20) | 0.871 | ||||||
| DM | 0.91 (0.76–1.09) | 0.307 | ||||||
| Smoker | 0.89 (0.74–1.06) | 0.184 | ||||||
| Family history | 0.95 (0.72–1.26) | 0.735 | ||||||
| Prior MI | 1.15 (0.98–1.38) | 0.136 | ||||||
| Prior CABG | 1.99 (1.51–2.60)a | <0.001a | 1.44 (0.98–2.12) | 0.066 | ||||
| Prior PCI | 1.22 (1.01–1.47)a | 0.036a | 0.99 (0.76–1.29) | 0.949 | ||||
| Cr, mg/dL | 1.03 (1.01–1.05)a | 0.017a | ||||||
| eGFR, mL/min per 1.73 m2 | 1.00 (0.99–1.00)a | 0.015a | 1.00 (1.00–1.01) | 0.161 | ||||
| LVEF <35% | 1.24 (0.93–1.66) | 0.140 | ||||||
| CCS ≥II | 0.82 (0.68–0.99)a | 0.036a | 0.85 (0.67–1.09) | 0.195 | ||||
| Cerebrovascular disease | 1.32 (0.92–1.88) | 0.132 | ||||||
| PAD | 1.31 (1.02–1.68)a | 0.034a | 1.09 (0.78–1.51) | 0.615 | ||||
| COPD | 1.36 (0.79–2.33) | 0.265 | ||||||
| MVD | 1.32 (1.09–1.59)a | 0.004a | 1.10 (0.86–1.41) | 0.458 | ||||
| CTO vessel, RCA | 1.36 (1.14–1.63)a | 0.001a | ||||||
| CTO vessel, LAD | 0.65 (0.53–0.80)a | <0.001a | 0.74 (0.57–0.99)a | 0.043a | ||||
| CTO vessel, LCX | 1.06 (0.86–1.32) | 0.571 | ||||||
| CTO vessel, LMT | 0.69 (0.09–5.34) | 0.720 | ||||||
| Non‐in‐stent occlusion | 1.51 (1.15–1.50)a | 0.003a | 1.74 (1.18–2.57)a | 0.005a | ||||
| Blunt stump | 1.81 (1.50–2.18)a | <0.001a | 1.68 (1.32–2.14)a | <0.001a | ||||
| Severe lesion calcification | 3.12 (2.52–3.86)a | <0.001a | 2.32 (1.73–3.11)a | <0.001a | ||||
| Lesion bending | 2.70 (2.11–3.45)a | <0.001a | 1.46 (1.04–2.05)a | 0.031a | ||||
| Proximal tortuosity | 1.72 (1.44–2.05)a | <0.001a | 1.30 (1.02–1.67)a | 0.038a | ||||
| Occlusion length ≥20 mm | 1.29 (1.05–1.59)a | 0.017a | 1.12 (0.87–1.42) | 0.385 | ||||
| Reattempt | 1.65 (1.27–2.15)a | <0.001a | 1.47 (1.03–2.09)a | 0.033a | ||||
| Collateral channel grade ≥1 | 0.80 (0.57–1.13) | 0.200 | ||||||
| J‐CTO score | 1.36 (1.24–1.49)a | <0.001a | 1.34 (1.22–1.46)a | <0.001a | ||||
| CL score | 1.32 (1.25–1.40)a | <0.001a | 1.30 (1.22–1.37)a | <0.001a | ||||
Multivariate analysis Model 1 was performed using a forward stepwise algorithm of clinical characteristics and angiographic findings with a 0.1 significance level. Models 2 and 3 were performed using a forced entry algorithm. Model 2: hemodialysis and J‐CTO score. Model 3: hemodialysis and CL score. CABG indicates coronary artery bypass grafting; CCS, Canadian Cardiovascular Society; CI, confidence interval; CL, clinical and lesion‐related; COPD, chronic obstructive pulmonary disease; Cr, creatinine; CTO, chronic total occlusion; DM, diabetes mellitus; eGFR, estimated glomerular filtration rate; J‐CTO, Multicenter CTO Registry in Japan; LAD, left anterior descending; LCX, left circumflex; LMT, left main trunk; LVEF, left ventricular ejection fraction; MI, myocardial infarction; MVD, multivessel disease; OR, odds ratio; PAD, peripheral artery disease; PCI, percutaneous coronary intervention; RCA, right coronary artery.
Significant at the 95% confidence level.
Recursive Partitioning Analysis for Predicting Technical Failure
Figure 3 shows the decision‐tree model of recursive partitioning analysis for predicting the technical failure of overall CTO‐PCI. With the exception of prior CABG, discriminators in the final tree generated by the decision‐tree induction were the same as the significant and independent predictors of technical failure in the multivariate logistic regression analysis (Table 6, Model 1).
Figure 3.
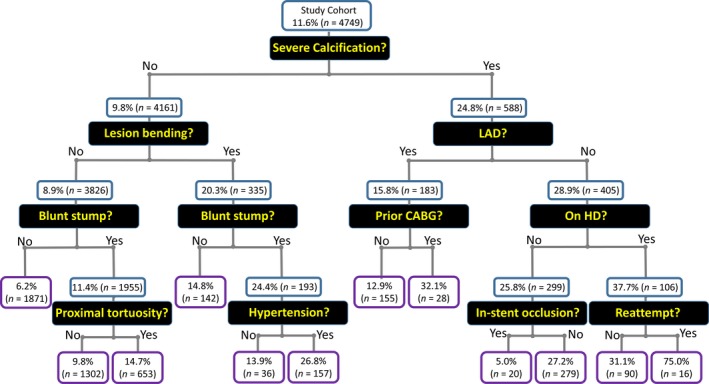
Decision‐tree model of recursive partitioning analysis for predicting technical failure of overall CTO‐PCI. Values are expressed as the rate of technical failure in CTO‐PCI and the number of patients in each node. CABG indicates coronary artery bypass grafting; CTO, chronic total occlusion; HD, hemodialysis; LAD, left anterior descending; PCI, percutaneous coronary intervention.
Changes in Discriminatory Ability of Scoring Systems to Predict Technical Failure Following Inclusion of Hemodialysis Status
Figure 4 shows receiver operating characteristic curves for each of the scoring systems, hemodialysis status, and scoring systems including hemodialysis status for the prediction of technical failure in CTO‐PCI. Following the inclusion of hemodialysis status, the discriminatory capacity of the J‐CTO score in predicting technical failure significantly improved (area under the curve, 0.6; 95% CI, 0.57–0.63 versus 0.61; 95% CI, 0.58–0.64; P=0.018). However, the performance of the CL score did not change following inclusion of hemodialysis status (area under the curve, 0.63; 95% CI, 0.60–0.66 versus 0.64; 95% CI, 0.61–0.67; P=0.25).
Figure 4.
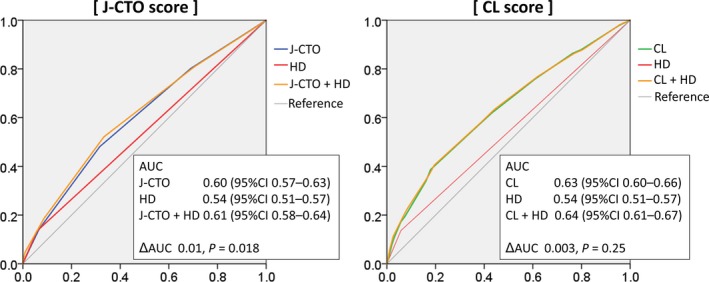
Changes in the discriminatory ability of scoring systems to predict technical failure following inclusion of HD status. AUC indicates area under the curve; CI, confidence interval; CL, clinical and lesion‐related; CTO, chronic total occlusion; HD, hemodialysis; J‐CTO, Multicenter CTO Registry in Japan.
Propensity Score–Matched Analysis
Table 7 shows baseline clinical and angiographic characteristics of the propensity score–matched cohort of hemodialysis and nonhemodialysis patients. A total of 251 hemodialysis patients were matched according to propensity scores with 251 nonhemodialysis patients, with similar baseline clinical and angiographic characteristics observed. As shown in Table 8, the rate of technical failure in hemodialysis patients was significantly higher than in nonhemodialysis patients from the propensity score–matched cohort (21% versus 11%; OR, 2.13; 95% CI, 1.30–3.50; P=0.003).
Table 7.
Baseline Clinical and Angiographic Characteristics of the Propensity Score–Matched Cohort of Patients
| Hemodialysis Group | Nonhemodialysis Group | Standardized Difference | |
|---|---|---|---|
| (n=251) | (n=251) | ||
| Age, y | 66±9 | 66±11 | 0.013 |
| Male | 202 (81%) | 216 (86%) | 0.152 |
| Hypertension | 198 (79%) | 208 (83%) | 0.095 |
| Hyperlipidemia | 146 (58%) | 140 (56%) | 0.048 |
| Diabetes mellitus | 165 (66%) | 154 (61%) | 0.089 |
| Smoker | 88 (39%) | 107 (44%) | 0.108 |
| Family history | 32 (18%) | 24 (12%) | 0.153 |
| Prior MI | 99 (41%) | 105 (43%) | 0.037 |
| Prior CABG | 40 (16%) | 36 (14%) | 0.045 |
| Prior PCI | 174 (70%) | 175 (70%) | 0.002 |
| LVEF <35% | 40 (16%) | 31 (12%) | 0.100 |
| CCS | |||
| 0 | 75 (31%) | 86 (35%) | 0.096 |
| I | 65 (27%) | 71 (29%) | 0.056 |
| II | 85 (35%) | 68 (28%) | 0.151 |
| III | 13 (5%) | 12 (5%) | 0.018 |
| IV | 5 (2%) | 6 (3%) | 0.027 |
| Multivessel disease | 172 (69%) | 168 (67%) | 0.034 |
| CTO vessel | |||
| Right | 136 (54%) | 137 (55%) | 0.008 |
| Left anterior descending | 51 (20%) | 52 (21%) | 0.010 |
| Left circumferential | 64 (26%) | 60 (24%) | 0.037 |
| Left main trunk | 0 (0%) | 2 (1%) | 0.127 |
| In‐stent occlusion | 69 (28%) | 67 (27%) | 0.018 |
| Blunt stump | 138 (55%) | 129 (52%) | 0.064 |
| Severe lesion calcification | 92 (37%) | 98 (39%) | 0.047 |
| Lesion bending | 39 (16%) | 34 (14%) | 0.054 |
| Occlusion length ≥20 mm | 128 (62%) | 141 (67%) | 0.105 |
| Reattempted lesion | 26 (10%) | 25 (10%) | 0.013 |
| Collateral channel classification | |||
| CC0 | 17 (8%) | 16 (8%) | 0.007 |
| CC1 | 123 (60%) | 114 (60%) | <0.001 |
| CC2 | 64 (31%) | 59 (31%) | 0.004 |
Values are presented as means±standard deviation or as numbers (percentages). CABG indicates coronary artery bypass grafting; CC, collateral channel; CCS, Canadian Cardiovascular Society; CTO, chronic total occlusion; LVEF, left ventricular ejection fraction; MI, myocardial infarction; PCI, percutaneous coronary intervention.
Table 8.
Technical Results According to Hemodialysis Status in the Propensity Score–Matched Cohort of Patients
| Hemodialysis | Nonhemodialysis | Odds Ratio | 95% CI | P Value | |
|---|---|---|---|---|---|
| n=251 | n=251 | ||||
| Technical failure | 53 (21%) | 28 (11%) | 2.13 | 1.30 to 3.50 | 0.003 |
CI indicates confidence interval.
Predictors of Technical Failure in Hemodialysis Patients
Table 9 shows the results of the multivariate analysis to identify predictors of technical failure in CTO‐PCI among the hemodialysis groups. With regard to CTO‐PCI in hemodialysis patients, the significant and independent predictors of technical failure were blunt stump (OR 2.45, 95% CI, 1.15–5.21, P=0.021), severe lesion calcification (OR 2.50, 95% CI, 1.19–5.24, P=0.015), and absence of DM (OR 3.15, 95% CI, 1.49–6.64, P=0.003). Notably, a smaller number of these predictors of technical failure of CTO‐PCI in hemodialysis patients was significantly associated with a higher technical success rate (Figure 5).
Table 9.
Univariate and Multivariate Logistic Regression Analyses for Technical Failure of CTO‐PCI Within Hemodialysis Group
| Factor | Hemodialysis Group | |||
|---|---|---|---|---|
| Univariate Analysis | Multivariate Analysis | |||
| OR (95% CI) | P Value | OR (95% CI) | P Value | |
| Age, per y | 2.86 (1.17–6.97)a | 0.021a | 0.98 (0.95–1.02) | 0.406 |
| Sex, male | 0.97 (0.94–1.00)a | 0.040a | 1.08 (0.38–3.04) | 0.884 |
| Hypertension | 1.54 (0.73–3.22) | 0.225 | ||
| Hyperlipidemia | 0.70 (0.40–1.20) | 0.196 | ||
| Absence of DM | 2.25 (1.29–3.91)a | 0.004a | 3.15 (1.49–6.64)a | 0.003a |
| Smoker | 1.09 (0.61–1.94) | 0.779 | ||
| Family history | 0.78 (0.32–1.90) | 0.587 | ||
| Prior MI | 1.71 (0.99–2.95)a | 0.055a | 1.47 (0.69–3.14) | 0.316 |
| Prior CABG | 1.62 (0.84–3.13) | 0.150 | ||
| Prior PCI | 1.00 (0.55–1.82) | 0.995 | ||
| Cr, mg/dL | 1.02 (0.96–1.09) | 0.519 | ||
| eGFR, mL/min per 1.73 m2 | 1.00 (0.97–1.03) | 0.883 | ||
| LVEF <35% | 1.63 (0.83–3.22) | 0.158 | ||
| CCS ≥II | 0.92 (0.53–1.60) | 0.764 | ||
| Cerebrovascular disease | 1.01 (0.32–3.18) | 0.985 | ||
| PAD | 1.31 (0.75–2.30) | 0.340 | ||
| COPD | 3.57 (0.22–57.88) | 0.370 | ||
| MVD | 1.41 (0.76–2.60) | 0.273 | ||
| CTO vessel, RCA | 1.90 (1.08–3.35)a | 0.026a | 1.52 (0.70–3.31) | 0.291 |
| CTO vessel, LAD | 0.81 (0.39–1.66) | 0.562 | ||
| CTO vessel, LCX | 0.49 (0.24–0.98)a | 0.044a | ||
| CTO vessel, LMT | ··· | ··· | ||
| Non‐in‐stent occlusion | 1.62 (0.86–3.05) | 0.139 | ||
| Blunt stump | 2.27 (1.28–4.05)a | 0.005a | 2.45 (1.15–5.21)a | 0.021a |
| Severe lesion calcification | 3.74 (2.13–6.59)a | <0.001a | 2.50 (1.19–5.24)a | 0.015a |
| Lesion bending | 4.57 (2.41–8.70)a | <0.001a | 2.28 (0.94–5.51) | 0.067 |
| Proximal tortuosity | 2.01 (1.17–3.46)a | 0.012a | 1.60 (0.74–3.45) | 0.232 |
| Occlusion length ≥20 mm | 1.86 (0.95–3.63)a | 0.070a | 1.09 (0.47–2.54) | 0.835 |
| Reattempt | 3.66 (1.72–7.79)a | 0.001a | 2.68 (0.92–7.83) | 0.071 |
| Collateral channel grade ≥1 | 1.51 (0.50–4.63) | 0.466 | ||
A multivariate logistic regression analysis was used to identify the predictors of technical failure of CTO‐PCI in the hemodialysis group among the variables associated (P<0.1) with this prediction on univariate analysis. CABG indicates coronary artery bypass grafting; CCS, Canadian Cardiovascular Society; CI, confidence interval; COPD, chronic obstructive pulmonary disease; Cr, creatinine; CTO, chronic total occlusion; DM, diabetes mellitus; eGFR, estimated glomerular filtration rate; LAD, left anterior descending; LCX, left circumflex; LMT, left main trunk; LVEF, left ventricular ejection fraction; MI, myocardial infarction; MVD, multivessel disease; OR, odds ratio; PAD, peripheral artery disease; PCI, percutaneous coronary intervention; RCA, right coronary artery.
Significant at the 95% confidence level.
Figure 5.
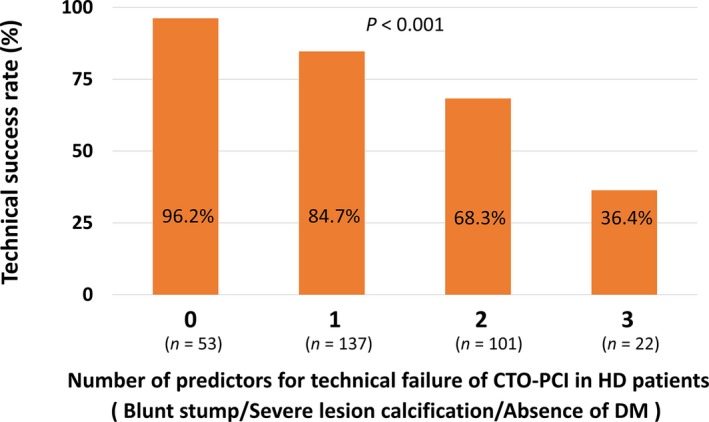
Association between the number of predictors of technical failure in CTO‐PCI and technical success rate in HD patients. CTO indicates chronic total occlusion; DM, diabetes mellitus; HD, hemodialysis; PCI, percutaneous coronary intervention.
12‐Month MACCE
Although 12‐month follow‐up data were available in only 1899 patients (120 in the hemodialysis group, and 1779 in the nonhemodialysis group), comparisons of 12‐month MACCE between the hemodialysis and nonhemodialysis groups undergoing CTO‐PCI are shown in Table 10. MACCE were more frequent in the hemodialysis group at 12 months, with a higher rate of death, cardiac death, noncardiac death, target vessel revascularization, and CABG in the hemodialysis group. Table 11 shows 12‐month MACCE according to the technical results of CTO‐PCI in the hemodialysis group. As shown, 12‐month MACCE did not differ according to the technical result of CTO‐PCI.
Table 10.
Comparisons of 12‐Month MACCE Between Hemodialysis and Nonhemodialysis Patients Undergoing CTO‐PCI
| Hemodialysis Group | Nonhemodialysis Group | P Value | |
|---|---|---|---|
| (n=120) | (n=1779) | ||
| 12‐mo MACCE | 39% | 12% | <0.001a |
| Death | 13% | 3% | <0.001a |
| Cardiac death | 5% | 1% | 0.003a |
| Noncardiac death | 8% | 2% | 0.001a |
| MI | 0% | 0.1% | 0.94 |
| Stroke | 0% | 0.2% | 0.77 |
| TVR | 20% | 8% | <0.001a |
| CABG | 6% | 1% | <0.001a |
Values are presented as percentages. CABG indicates coronary artery bypass grafting; CTO, chronic total occlusion; MACCE, major adverse cardiac and cerebrovascular events; MI, myocardial infarction; PCI, percutaneous coronary intervention; TVR, target vessel revascularization.
Indicates significant difference between the hemodialysis group and the nonhemodialysis group.
Table 11.
12‐Month MACCE According to Technical Results of CTO‐PCI in Hemodialysis Patients
| Technical Results | Hemodialysis Group | P Value | |
|---|---|---|---|
| Success | Failure | ||
| (n=95) | (n=25) | ||
| 12‐mo MACCE | 39% | 40% | 0.92 |
| Death | 13% | 16% | 0.66 |
| Cardiac death | 5% | 4% | 0.80 |
| Noncardiac death | 7% | 12% | 0.46 |
| MI | 0% | 0% | ··· |
| Stroke | 0% | 0% | ··· |
| TVR | 21% | 16% | 0.57 |
| CABG | 5% | 8% | 0.60 |
Values are presented as percentages. CABG indicates coronary artery bypass grafting; CTO, chronic total occlusion; MACCE, major adverse cardiac and cerebrovascular events; MI, myocardial infarction; PCI, percutaneous coronary intervention; TVR, target vessel revascularization.
Discussion
The major findings of this study were as follows: (1) In hemodialysis patients undergoing contemporary CTO‐PCI with dedicated devices and specialized techniques in the Retrograde Summit registry, the technical success rate was significantly lower than in nonhemodialysis patients. (2) Irrespective of clinical characteristics and angiographic findings, hemodialysis was an independent predictor of technical failure in overall CTO‐PCI. (3) With regard to CTO‐PCI in hemodialysis patients, the independent predictors of technical failure were blunt stump, severe lesion calcification, and absence of DM, and the technical success rate of CTO‐PCI seemed acceptable in patients without these characteristics.
Patients receiving hemodialysis have been largely excluded from practically all of the large‐scale prospective studies that assessed the efficacy of coronary revascularization procedures. Therefore, current practice guidelines do not endorse any revascularization approach in hemodialysis patients, and at present, decisions for hemodialysis patients present a dilemma for clinicians because of the complexity of the procedures2 and the risk of future cardiovascular events. To date, numerous studies have documented a survival advantage from complete compared with incomplete revascularization.23 Moreover, a subanalysis of the SYNTAX (Synergy between PCI with TAXUS and Cardiac Surgery) Trial has shown that the presence of CTO is the strongest predictor of incomplete revascularization in percutaneous procedures.4 Thus, the procedural results and characteristics of CTO‐PCI in hemodialysis patients are of particular importance.
Clinical and Angiographic Characteristics
Although several scoring systems to predict the difficulty or technical failure in CTO‐PCI have been developed, these studies have included few hemodialysis patients: only 14 cases in the report of the J‐CTO score14 and 10 in that of the PROGRESS CTO (Prospective Global Registry for the Study of Chronic Total Occlusion Intervention) score.24 In the present study, a total of 313 hemodialysis patients undergoing contemporary CTO‐PCI with dedicated devices and specialized techniques were included. To the best of our knowledge, the current study involves the largest number of hemodialysis patients treated with CTO‐PCI to date. In agreement with previous reports, our study showed that patients undergoing long‐term hemodialysis commonly carry accumulated cardiovascular risk factors25 and angiographic findings indicative of advanced atherosclerosis and difficulty in CTO‐PCI procedures.14 Further, hemodialysis independently and strikingly predicted the technical failure in overall CTO‐PCI in the present study. None of the previous scoring systems included hemodialysis in its components, but the discrepancy may be explained by the insufficient number of hemodialysis patients in the previous reports.
Procedural Results and Characteristics
Regardless of whether the antegrade or the retrograde procedure was performed, the technical success rate of CTO‐PCI in hemodialysis patients was significantly lower than that in nonhemodialysis patients. In a previous report of a subanalysis of the Credo‐Kyoto registry,26 in which definitions of CTO included occlusions with thrombolysis in myocardial infarction flow grade 1 or occlusion duration >1 month, the success rate of CTO‐PCI in 70 hemodialysis patients was 61.4%. The technical results in the current study indicate the possibility of improving the perceived technical results of CTO‐PCI in hemodialysis patients by using dedicated devices and specialized techniques.
Clarification of the procedural characteristics of CTO‐PCI in hemodialysis patients was another informative result of our study. With specific regard to the retrograde procedure, CTO crossing is difficult, even with the bilateral approach, despite the high success rate of channel crossing of the septal branch, which is usually chosen in preference to epicardial channels because of their morphology and anatomical location. It has been generally established that once the collateral channel can be crossed with a guidewire and a catheter, the retrograde CTO‐PCI procedure can be performed with a high success rate.10, 27 However, as shown in the present study, this rule cannot be applied to hemodialysis patients. The characteristics of coronary plaques documented in autopsy studies3 would explain the difficulty in crossing CTO lesions in hemodialysis patients.
Predictors of Technical Results of CTO‐PCI in Hemodialysis Patients
Among hemodialysis patients, angiographic findings indicative of difficulty in the CTO‐PCI procedure, such as blunt stump and severe lesion calcification, were predictors of technical failure. The unexpected results indicating a positive impact of DM on technical results in hemodialysis patients in this study should be interpreted with caution. Although we did not collect data on the duration of hemodialysis, a previous study documented a shorter duration of hemodialysis to clinical manifestation of coronary artery disease in hemodialysis patients with DM than in those without DM.20 Dialysis vintage has been shown to predict progression of vascular calcification.28 Therefore, a shorter hemodialysis duration before CTO‐PCI would result in immaturity of the CTO lesion, and this might partly explain the positive impact of DM on the technical results of CTO‐PCI in hemodialysis patients.
According to Figure 4 in the present study, the technical success rate in patients with all 3 factors (blunt stump, calcification, and absence of DM) was 36.4%. Hence, we believe that these patients should be treated with particular caution. Because of insufficient information regarding long‐term outcomes of hemodialysis patients undergoing CTO‐PCI at present, the decision to proceed with CTO‐PCI in hemodialysis patients with a low likelihood of technical success according to scoring systems should be made based on other clinical factors, such as the necessity of revascularization and suitability for CABG.
Limitations
Several limitations should be acknowledged in this study. First and most importantly, the observational study design precluded drawing definitive conclusions because of inherent selection bias. Second, there is a potential for residual confounding bias because of unmeasured factors, although the relevant measured confounders were included in the multivariate analysis. Third, data regarding the etiology of renal failure, hemodialysis duration, and medical therapies were not obtained. Data regarding severity of angina were only obtained at 1 time point, which was before the procedure. Therefore, improvement in the severity of angina after revascularization was not considered in the analyses. Fourth, there was no centralized event adjudication and core laboratory assessment. All clinical events were reported by each operator who performed CTO‐PCI. Further study is warranted to elucidate whether CTO‐PCI contributes to better clinical outcomes in hemodialysis patients.
Conclusions
Although hemodialysis is associated with technical failure in CTO‐PCI, contemporary CTO‐PCI in hemodialysis patients is feasible and safe in appropriately selected patients. With regard to CTO‐PCI in hemodialysis patients, improvement in patient selection would contribute to a higher technical success rate and wider use of complex PCI with dedicated devices and specialized techniques.
Sources of Funding
Retrograde Summit registry was funded through a research grant from Asahi Intecc and Boston Scientific.
Disclosures
None.
Acknowledgments
The authors would like to thank M. Taguri for his valuable advice in the statistical analyses. We are also grateful to the members of the cardiac catheterization laboratories of the participating centers and the clinical research coordinators.
(J Am Heart Assoc. 2017;6:e006431 DOI: 10.1161/JAHA.117.006431.)
References
- 1. de Lemos JA, Hillis LD. Diagnosis and management of coronary artery disease in patients with end‐stage renal disease on hemodialysis. J Am Soc Nephrol. 1996;7:2044–2054. [DOI] [PubMed] [Google Scholar]
- 2. Naidu SS, Selzer F, Jacobs A, Faxon D, Marks DS, Johnston J, Detre K, Wilensky RL. Renal insufficiency is an independent predictor of mortality after percutaneous coronary intervention. Am J Cardiol. 2003;92:1160–1164. [DOI] [PubMed] [Google Scholar]
- 3. Schwarz U, Buzello M, Ritz E, Stein G, Raabe G, Wiest G, Mall G, Amann K. Morphology of coronary atherosclerotic lesions in patients with end‐stage renal failure. Nephrol Dial Transplant. 2000;15:218–223. [DOI] [PubMed] [Google Scholar]
- 4. Farooq V, Serruys PW, Garcia‐Garcia HM, Zhang Y, Bourantas CV, Holmes DR, Mack M, Feldman T, Morice MC, Ståhle E, James S, Colombo A, Diletti R, Papafaklis MI, de Vries T, Morel MA, van Es GA, Mohr FW, Dawkins KD, Kappetein AP, Sianos G, Boersma E. The negative impact of incomplete angiographic revascularization on clinical outcomes and its association with total occlusions: the SYNTAX (Synergy Between Percutaneous Coronary Intervention with Taxus and Cardiac Surgery) trial. J Am Coll Cardiol. 2013;61:282–294. [DOI] [PubMed] [Google Scholar]
- 5. Natsuaki M, Furukawa Y, Morimoto T, Sakata R, Kimura T; CREDO‐Kyoto PCI/CABG Registry Cohort‐2 Investigators . Renal function and effect of statin therapy on cardiovascular outcomes in patients undergoing coronary revascularization (from the CREDO‐Kyoto PCI/CABG Registry Cohort‐2). Am J Cardiol. 2012;110:1568–1577. [DOI] [PubMed] [Google Scholar]
- 6. Chang TI, Shilane D, Kazi DS, Montez‐Rath ME, Hlatky MA, Winkelmayer WC. Multivessel coronary artery bypass grafting versus percutaneous coronary intervention in ESRD. J Am Soc Nephrol. 2012;23:2042–2049. [DOI] [PMC free article] [PubMed] [Google Scholar]
- 7. Shroff GR, Solid CA, Herzog CA. Long‐term survival and repeat coronary revascularization in dialysis patients after surgical and percutaneous coronary revascularization with drug‐eluting and bare metal stents in the United States. Circulation. 2013;127:1861–1869. [DOI] [PMC free article] [PubMed] [Google Scholar]
- 8. Bangalore S, Guo Y, Samadashvili Z, Blecker S, Xu J, Hannan EL. Revascularization in patients with multivessel coronary artery disease and chronic kidney disease: everolimus‐eluting stents versus coronary artery bypass graft surgery. J Am Coll Cardiol. 2015;66:1209–1220. [DOI] [PMC free article] [PubMed] [Google Scholar]
- 9. Sumitsuji S, Inoue K, Ochiai M, Tsuchikane E, Ikeno F. Fundamental wire technique and current standard strategy of percutaneous intervention for chronic total occlusion with histopathological insights. JACC Cardiovasc Interv. 2011;4:941–951. [DOI] [PubMed] [Google Scholar]
- 10. Tsuchikane E, Yamane M, Mutoh M, Matsubara T, Fujita T, Nakamura S, Muramatsu T, Okamura A, Igarashi Y, Oida A; Retrograde Summit Investigators . Japanese multicenter registry evaluating the retrograde approach for chronic coronary total occlusion. Catheter Cardiovasc Interv. 2013;82:E654–E661. [DOI] [PubMed] [Google Scholar]
- 11. Yamane M, Muto M, Matsubara T, Nakamura S, Muramatsu T, Oida A, Igarashi Y, Nozaki Y, Kijima M, Tuschikane E. Contemporary retrograde approach for the recanalisation of coronary chronic total occlusion: on behalf of the Japanese Retrograde Summit Group. EuroIntervention. 2013;9:102–116. [DOI] [PubMed] [Google Scholar]
- 12. Barrett BJ, Parfrey PS. Clinical practice. Preventing nephropathy induced by contrast medium. N Engl J Med. 2006;354:379–386. [DOI] [PubMed] [Google Scholar]
- 13. Werner GS, Ferrari M, Heinke S, Kuethe F, Surber R, Richartz BM, Figulla HR. Angiographic assessment of collateral connections in comparison with invasively determined collateral function in chronic coronary occlusions. Circulation. 2003;107:1972–1977. [DOI] [PubMed] [Google Scholar]
- 14. Morino Y, Abe M, Morimoto T, Kimura T, Hayashi Y, Muramatsu T, Ochiai M, Noguchi Y, Kato K, Shibata Y, Hiasa Y, Doi O, Yamashita T, Hinohara T, Tanaka H, Mitsudo K; J‐CTO Registry Investigators . Predicting successful guidewire crossing through chronic total occlusion of native coronary lesions within 30 minutes: the J‐CTO (Multicenter CTO Registry in Japan) score as a difficulty grading and time assessment tool. JACC Cardiovasc Interv. 2011;4:213–221. [DOI] [PubMed] [Google Scholar]
- 15. Alessandrino G, Chevalier B, Lefèvre T, Sanguineti F, Garot P, Unterseeh T, Hovasse T, Morice MC, Louvard Y. A clinical and angiographic scoring system to predict the probability of successful first‐attempt percutaneous coronary intervention in patients with total chronic coronary occlusion. JACC Cardiovasc Interv. 2015;8:1540–1548. [DOI] [PubMed] [Google Scholar]
- 16. Habara M, Tsuchikane E, Muramatsu T, Kashima Y, Okamura A, Mutoh M, Yamane M, Oida A, Oikawa Y, Hasegawa K; Retrograde Summit Investigators . Comparison of percutaneous coronary intervention for chronic total occlusion outcome according to operator experience from the Japanese Retrograde Summit Registry. Catheter Cardiovasc Interv. 2016;87:1027–1035. [DOI] [PubMed] [Google Scholar]
- 17. Quinlan JR. Induction of decision trees. Mach Learn. 1986;1:81–106. [Google Scholar]
- 18. DeLong ER, DeLong DM, Clarke‐Pearson DL. Comparing the areas under two or more correlated receiver operating characteristic curves: a nonparametric approach. Biometrics. 1988;44:837–845. [PubMed] [Google Scholar]
- 19. Otsuka Y, Ishiwata S, Inada T, Kanno H, Kyo E, Hayashi Y, Fujita H, Michishita I. Comparison of haemodialysis patients and non‐haemodialysis patients with respect to clinical characteristics and 3‐year clinical outcomes after sirolimus‐eluting stent implantation: insights from the Japan multi‐centre post‐marketing surveillance registry. Eur Heart J. 2011;32:829–837. [DOI] [PubMed] [Google Scholar]
- 20. Natsuaki M, Furukawa Y, Morimoto T, Nakagawa Y, Akao M, Ono K, Shioi T, Shizuta S, Sakata R, Okabayashi H, Nishiwaki N, Komiya T, Suwa S, Kimura T. Impact of diabetes on cardiovascular outcomes in hemodialysis patients undergoing coronary revascularization. Circ J. 2011;75:1616–1625. [DOI] [PubMed] [Google Scholar]
- 21. Ikari Y, Tanabe K, Koyama Y, Kozuma K, Sano K, Isshiki T, Katsuki T, Kimura K, Yamane M, Takahashi N, Hibi K, Hasegawa K, Ishiwata S, Kiyooka T, Yokoi H, Uehara Y, Hara K. Sirolimus eluting coronary stent implantation in patients on maintenance hemodialysis: the OUCH study (outcome of cypher stent in hemodialysis patients). Circ J. 2012;76:1856–1863. [DOI] [PubMed] [Google Scholar]
- 22. Aoyama T, Ishii H, Toriyama T, Takahashi H, Kasuga H, Murakami R, Amano T, Uetani T, Yasuda Y, Yuzawa Y, Maruyama S, Matsuo S, Matsubara T, Murohara T. Sirolimus‐eluting stents vs bare metal stents for coronary intervention in Japanese patients with renal failure on hemodialysis. Circ J. 2008;72:56–60. [DOI] [PubMed] [Google Scholar]
- 23. Garcia S, Sandoval Y, Roukoz H, Adabag S, Canoniero M, Yannopoulos D, Brilakis ES. Outcomes after complete versus incomplete revascularization of patients with multivessel coronary artery disease: a meta‐analysis of 89,883 patients enrolled in randomized clinical trials and observational studies. J Am Coll Cardiol. 2013;62:1421–1431. [DOI] [PubMed] [Google Scholar]
- 24. Christopoulos G, Kandzari DE, Yeh RW, Jaffer FA, Karmpaliotis D, Wyman MR, Alaswad K, Lombardi W, Grantham JA, Moses J, Christakopoulos G, Tarar MN, Rangan BV, Lembo N, Garcia S, Cipher D, Thompson CA, Banerjee S, Brilakis ES. Development and validation of a novel scoring system for predicting technical success of chronic total occlusion percutaneous coronary interventions: the PROGRESS CTO (Prospective Global Registry for the Study of Chronic Total Occlusion Intervention) Score. JACC Cardiovasc Interv. 2016;9:1–9. [DOI] [PubMed] [Google Scholar]
- 25. Cheung AK, Sarnak MJ, Yan G, Dwyer JT, Heyka RJ, Rocco MV, Teehan BP, Levey AS. Atherosclerotic cardiovascular disease risks in chronic hemodialysis patients. Kidney Int. 2000;58:353–362. [DOI] [PubMed] [Google Scholar]
- 26. Yamamoto E, Natsuaki M, Morimoto T, Furukawa Y, Nakagawa Y, Ono K, Mitsudo K, Nobuyoshi M, Doi O, Tamura T, Tanaka M, Kimura T; CREDO‐Kyoto PCI/CABG Registry Cohort‐2 Investigators . Long‐term outcomes after percutaneous coronary intervention for chronic total occlusion (from the CREDO‐Kyoto registry cohort‐2). Am J Cardiol. 2013;112:767–774. [DOI] [PubMed] [Google Scholar]
- 27. Suzuki Y, Muto M, Yamane M, Muramatsu T, Okamura A, Igarashi Y, Fujita T, Nakamura S, Oida A, Tsuchikane E. Independent predictors of retrograde failure in CTO‐PCI after successful collateral channel crossing. Catheter Cardiovasc Interv. 2017;90:E11–E18. DOI: 10.1002/ccd.26785. [DOI] [PubMed] [Google Scholar]
- 28. Yazbek DC, de Carvalho AB, Barros CS, Marcassi AP, Pestana JO, Fachini FC, Cassiolato JL, Canziani ME. Cardiovascular disease in early kidney transplantation: comparison between living and deceased donor recipients. Transplant Proc. 2012;44:3001–3006. [DOI] [PubMed] [Google Scholar]