

Abstract
Background
During high sodium intake, the renin‐angiotensin‐aldosterone system is downregulated and nitric oxide signaling is upregulated in order to remain in sodium balance. Recently, we showed that collecting duct nitric oxide synthase 1β is critical for fluid‐electrolyte balance and subsequently blood pressure regulation during high sodium feeding. The current study tested the hypothesis that high sodium activation of the collecting duct nitric oxide synthase 1β pathway is critical for maintaining sodium homeostasis and for the downregulation of the renin‐angiotensin‐aldosterone system–epithelial sodium channel axis.
Methods and Results
Male control and collecting duct nitric oxide synthase 1β knockout (CDNOS1KO) mice were placed on low, normal, and high sodium diets for 1 week. In response to the high sodium diet, plasma sodium was significantly increased in control mice and to a significantly greater level in CDNOS1KO mice. CDNOS1KO mice did not suppress plasma aldosterone in response to the high sodium diet, which may be partially explained by increased adrenal AT1R expression. Plasma renin concentration was appropriately suppressed in both genotypes. Furthermore, CDNOS1KO mice had significantly higher intrarenal angiotensin II with high sodium diet, although intrarenal angiotensinogen levels and angiotensin‐converting enzyme activity were similar between knockout mice and controls. In agreement with inappropriate renin‐angiotensin‐aldosterone system activation in the CDNOS1KO mice on a high sodium diet, epithelial sodium channel activity and sodium transporter abundance were significantly higher compared with controls.
Conclusions
These data demonstrate that high sodium activation of collecting duct nitric oxide synthase 1β signaling induces suppression of systemic and intrarenal renin‐angiotensin‐aldosterone system, thereby modulating epithelial sodium channel and other sodium transporter abundance and activity to maintain sodium homeostasis.
Keywords: aldosterone, angiotensin II, collecting duct, epithelial sodium channel, intrarenal angiotensin II, kidney, nitric oxide synthase 1β, plasma sodium, sodium
Subject Categories: High Blood Pressure, Hypertension, ACE/Angiotension Receptors/Renin Angiotensin System, Basic Science Research, Nephrology and Kidney
Clinical Perspective
What Is New?
Collecting duct nitric oxide synthase 1β is critical for sodium homeostasis, fluid‐electrolyte balance, and subsequent blood pressure regulation during high salt intake.
High salt–induced activation of collecting duct nitric oxide synthase 1β signaling induces suppression of the systemic and intrarenal renin‐angiotensin‐aldosterone system, thereby modulating the abundance and activity of epithelial sodium channel and other sodium transporters to maintain sodium homeostasis.
What Are the Clinical Implications?
Salt sensitivity occurs in patients with hypertension, as well as those with normotension.
If activation of collecting duct nitric oxide synthase 1β fails during high salt intake, a rightward shift in the pressure‐natriuresis relationship would result.
Mutations in nitric oxide synthase 1 correlate with hypertension in patients; it is possible that these mutations prevent activation of nitric oxide synthase 1 and result in salt‐sensitive blood pressure changes.
Introduction
Consuming a diet high in sodium is common in industrialized parts of the world. During sodium excess, renal sodium‐retaining mechanisms are downregulated and natriuretic mechanisms are upregulated. It is well accepted that the renin‐angiotensin‐aldosterone‐system (RAAS) is critical for anti‐natriuresis during low sodium (LS) intake, and that nitric oxide (NO), atrial natriuretic peptide, endothelin‐1, and prostaglandins are critical for promoting natriuresis during high sodium (HS) intake. We reported that deletion of NO synthase 1 (NOS1, or neuronal NO synthase) from the principal cells of the collecting duct (CD) results in sodium and water retention and a sodium‐dependent increase in blood pressure (BP).1 NOS1 is expressed as alternative splice variants in the rat and mouse kidney.1, 2, 3 It is the NOS1β splice variant (130 kDa) that is predominantly expressed in the mouse and human renal medulla,1, 4 and NOS1β is critical for maintaining fluid‐electrolyte balance.1 Furthermore, we showed that CD NOS1β expression is critical for acute regulation of the epithelial sodium channel (ENaC) open probability.5 These data led us to propose that during chronic HS feeding, CD NOS1β promotes natriuresis via inhibition of ENaC activity.
Angiotensin II (AngII) infusion is not only a common experimental model,6, 7, 8 but is also clinically relevant as extensive use of therapies to treat hypertension and cardiovascular diseases target the RAAS (eg, angiotensin‐converting enzyme [ACE] inhibitors, AngII receptor blockers, or mineralocorticoid receptor antagonists).9, 10 Over the past decade, studies have demonstrated that activation of the intrarenal renin‐angiotensin system (RAS) can result in sodium retention and hypertension, independent from the systemic RAS.7, 11 Stimulation of the renal derived RAS activates sodium transporters and channels and blunts pressure natriuresis to maintain sodium homeostasis.7 Furthermore, studies suggest that the renal NOS system and intrarenal RAS systems interact. In a model of systemic AngII‐induced hypertension (65 ng/min AngII, 14 days), the significant increase in renal NO acts to maintain cortical perfusion.12 Furthermore, in a hypertension model of NO synthase inhibition (with L‐NAME), with low‐systemic AngII, intrarenal ACE prevents adequate sodium transporter depression, resulting in increased BP.13 Taken together, these studies suggest that renal NO production counteracts the antinatriuretic actions of AngII. The purpose of this study was to test the hypothesis that HS‐induced activation of the NOS1β pathway in the CD is critical for maintaining sodium homeostasis and downregulation of the renin‐angiotensin‐aldosterone‐ENaC axis, thus providing mechanistic insight into the natriuretic effect of CD NO production.
Methods
Animals
All animal use and welfare adhered to the National Institutes of Health Guide for the Care and Use of Laboratory Animals following a protocol reviewed and approved by the Institutional Laboratory Animal Care and Use Committee of the University of Alabama at Birmingham and the University of Texas Health Science Center at San Antonio. CD NOS1β knockout (CDNOS1KO) and littermate flox control mice were bred at the University of Alabama at Birmingham as previously described.1 Male CDNOS1KO and control (12–20 weeks of age) mice were maintained with standard chow (0.3% Na; Teklad 7917, Envigo). For dietary sodium challenges, all mice were switched from the standard normal sodium (NS) chow to the NS (TD.96208, 0.2% Na), sodium deficient (LS) (TD.90228, <0.01% Na), or HS (TD.92034, 1.6% Na) pellet diets for 7 days. A separate group of mice were maintained on standard NS chow and fasted overnight. Water was provided ad libitum. For tissue collections, mice were anesthetized with constant inhalation of 2% isoflurane followed by thoracotomy.
Split‐open tubule patch clamping experiments were performed at the University of Texas Health Science Center at San Antonio. The mice were maintained on standard chow (0.32% Na+; Teklad 7912, Harlan), but placed on the same aforementioned sodium‐deficient and HS diets for 7 days before the experiments. Water was provided ad libitum.
Metabolic Cage Studies
Mice were housed individually in metabolic cages from day 3 to day 6 of the dietary intervention. CDNOS1KO mice (n=9) and controls (n=11) were placed on gel diets as previously described,1 where the sodium concentrations were <0.01% for LS, 0.2% for NS, and 1.6% for HS. Urine was collected under water‐saturated mineral oil at 24‐hour increments. Day 6 urine was centrifuged at 1000g for 10 minutes, to pellet any debris, and aliquots were stored at −80°C until analysis.
Plasma and Urine Analyses
Mice were anesthetized by constant inhalation of 2% isoflurane. Whole blood was collected via cardiac puncture through the diaphragm into heparinized syringes. The blood was centrifuged within 30 minutes at 1000g for 10 minutes to isolate the plasma. Plasma was collected from 9 am to 11 am. Plasma sodium, potassium, and chloride were immediately determined by ion‐specific electrode (Easylyte Plus, Medica). The remaining plasma was aliquoted and frozen for future analysis of renin and aldosterone. In order to obtain enough plasma to run these analyses, multiple groups of mice were needed. Samples sizes are recorded in the figure legends. Plasma aldosterone was measured by radioimmunoassay (Siemens, Coat‐A‐Count Aldosterone). Plasma renin concentration was determined following the method of Ramkumar et al.14
Plasma AngII was determined from trunk blood samples collected with EDTA as the anticoagulant from a separate group of restrained, conscious mice. Blood was immediately centrifuged at 1500g for 2 minutes, and the plasma extracted in 2 mL of ice‐cold methanol. The samples were centrifuged 1500g for 30 minutes at 4°C, and the methanol evaporated with a heated speed vacuum centrifuge (37°C for 2 hours). AngII concentration was determined using a Peninsula AngII EIA kit (S‐1133).
Urinary aldosterone excretion was measured by ELISA (Cayman Chemical) from urine collections of nonrestrained, conscious mice. Urinary aldosterone concentration was multiplied by urine volume to determine excretion. Urinary sodium and potassium were determined by ion selective electrodes (EasyLyte Plus) and concentration was multiplied by urine volume to determine excretion.
Isolated, Split‐Open CD Preparation
Isolation of CDs suitable for electrophysiology has been described.15, 16 ENaC activity in principal cells of murine CDs was quantified in cell‐attached patches of the apical membrane made under voltage‐clamp conditions (−Vp=−60 mV) using standard procedures.5, 15, 16 As recording of the current tracings continued, the number of channels and open probability (Po) were determined as described in detail elsewhere.5, 15, 16
Tissue Collection and Immunohistochemistry
Both kidneys were excised and immediately dissected into cortex, outer medulla, and inner medullary samples. These were snap‐frozen and stored at −80°C. From an additional group of animals, the kidneys were removed, decapsulated, and fixed in 10% neutral buffered formalin for 24 hours. The kidneys were then embedded in paraffin wax with cross sections and sagittal sections of 5 μm placed on Superfrost Plus glass slides (Fisher Scientific). Slides were analyzed for angiotensinogen. In short, slides were warmed to 61°C and the paraffin removed with Histo‐Clear (National Diagnostics). The slides were rehydrated through changes of 100% to 70% ethanol in water. Endogenous peroxidase activity was blocked by incubation for 30 minutes at room temperature in 3% hydrogen peroxide (diluted in water). Slides were then steamed in antigen retrieval solution (Dako) for 30 minutes and allowed to cool to room temperature. After a 20‐minute protein block step (Biocare, Rodent Block M), slides were incubated in 1 μg/mL anti‐mouse/rat angiotensinogen (rabbit IgG affinity purified, IBL America) overnight in a humidified chamber at 4°C. Excess primary antibody was removed by 3 washes in 10 mmol/L phosphate buffered saline. Immunoreactivity was visualized using Rabbit on Rodent‐HRP polymer (Biocare) and diaminobenzidine (Dako) following manufacturer's instructions. The slides were then counterstained for 5 minutes in hematoxylin (Leica), dehydrated with increasing concentrations of ethanol, and mounted. Angiotensinogen immunoreactivity was evaluated by 2 investigators blinded to the identity of sections with a Bx43 microscope fitted with a DP80 camera, and images taken with cellSens Dimension software (v1.12, Olympus).
Quantitative Polymerase Chain Reaction and Western Blotting
Total RNA was extracted from cortical samples of control and CDNOS1KO mice using Tri‐Reagent following the manufacturer's instructions (Sigma). Total RNA was also extracted from both adrenal glands of control and CDNOS1KO mice using the Ambion RNAqueous‐Micro Total RNA Isolation Kit (ThermoFisher). For cortex 5 μg of RNA and for adrenal glands 1 μg of RNA were reverse transcribed using Invitrogen's SuperScript III RT‐Kit and relative quantitative expression of renin, angiotensinogen, AT1a, AT1b, AT2, ACE1, ACE2, CYP11B1, and CYP11B2 were determined using Bio‐Rad SsoAdvanced Universal SYBR Green Supermix and commercially available primers from Qiagen.
Western blots for a panel of ion transporters and channels, and components of the intrarenal RAAS were completed with renal cortical or inner medullary samples. Cortex or inner medulla samples were homogenized in ice‐cold lysis buffer (20 mmol/L Tris, 150 mmol/L NaCl, 0.5% Triton X‐100, 1 mmol/L EDTA, 1 mmol/L EGTA, 10 μmol/L leupeptin, 2 μmol/L pepstatin A, 1 mmol/L phenylmethylsulfonyl fluoride, and pH 7.5) plus phosphatase inhibitor (Pierce, #88667). For sodium, potassium, two chloride cotransporter (NKCC2) Western blotting, hypotonic buffer (250 mmol/L sucrose, 30 mmol/L Tris, 1 mmol/L EDTA, 2 μg/mL leupeptin, 100 μg/mL phenylmethylsulfonyl fluoride, and pH 7.5) was used to homogenize the samples. The homogenates were centrifuged 5000g for 5 minutes to pellet debris and protein concentration of the resulting supernatant measured by Bradford assay (Quick Start, Bio‐Rad). For cortical samples 30 μg of protein or for inner medullary samples 10 μg of sample were separated by SDS‐PAGE, transferred to polyvinylidene fluoride membranes and incubated in primary antibodies overnight at 4°C while shaking. Immunoreactivity was visualized using fluorescently tagged secondary antibodies (0.1 ng/mL) and the LI‐COR infrared Odyssey Imaging System. Antibodies used in this study can be found in Table 1 and have been previously validated.17, 18 To ensure equal loading of all samples, Western blots for actin and Coomassie Blue staining of each membrane were performed. Band intensity was determined by the LI‐COR Odyssey Software Image Studio. Representative blots, including blots for actin and Coomassie controls, are shown in each figure.
Table 1.
Antibodies Used in This Study
| Antibody | Company or Investigator | Host | Catalog | Concentration or Dilution |
|---|---|---|---|---|
| αENaC | Dr Loffing | Rabbit | 1/2000 | |
| γENaC | StressMarq | Rabbit | SPC‐405 | 1/1000 |
| NCC | Dr McDonough | Rabbit | 1/1000 | |
| NHE3 | Dr McDonough | Rabbit | 1/1000 | |
| NKA α5 | Developmental Studies Hybridoma Bank at the University of Iowa | Mouse | 1/1000 | |
| NKA beta | Dr McDonough | Rabbit | 1/1000 | |
| pNCCT53 | Dr Loffing | Rabbit | 1/1000 | |
| pNCCT58 | Dr Loffing | Rabbit | 1/1000 | |
| pNHE3 | Santa Cruz Biotechnology | Mouse | SC‐53962 | 0.2 μg/mL |
| NKCC2 | StressMarq | Rabbit | SPC‐401D | 1 μg/mL |
| Renin/prorenin | Santa Cruz Biotechnology | Goat | sc‐27318 | 0.2 μg/mL |
| Angiotensinogen | IBL America | Rabbit | 28101 | 0.1 μg/mL |
| ACE1 | Santa Cruz Biotechnology | Rabbit | sc‐20791 | 0.2 μg/mL |
| ACE2 | Santa Cruz Biotechnology | Rabbit | sc‐20998 | 0.2 μg/mL |
| β‐actin | Sigma | Mouse | A1978 | 0.1 ng/mL |
ACE indicates angiotensin‐converting enzyme; ENaC, epithelial sodium channel; NCC, sodium‐chloride cotransporter; NHE3, sodium‐hydrogen exchanger 3; NKA, sodium, potassium ATPase; NKCC2, sodium, potassium, two chloride cotransporter; pNCCT53, phosphorylated sodium‐chloride cotransporter T53; pNCCT58, phosphorylated sodium‐chloride cotransporter T58, pNHE3, phosphorylated sodium‐hydrogen exchanger.
Renal Cortical AngII Concentration and ACE Activity
Twenty microgram cortex samples from control and CDNOS1KO mice were extracted in 2 mL of ice‐cold methanol by glass‐on‐glass homogenization. The samples were then centrifuged at 1500g for 30 minutes at 4°C and the supernatant lyophilized at 37°C. The lyophilized samples were stored at −80°C until analyzed by enzyme immunoassay (AngII EIA #S‐1133; Peninsula Laboratories International, Inc). AngII concentration was normalized to wet cortex weight.
Renal ACE activity was assessed in renal cortex homogenates as previously described.19 To confirm the assay specificity, an aliquot of each sample was assessed in the presence of the ACE inhibitor captopril. Only the hydrolytic activity inhibited by captopril was considered for calculations.
Data and Statistical Analyses
Quantitative polymerase chain reaction data were analyzed using the 2−ΔΔCT (with Gapdh as the control gene, and normalization to the control NS group). Western blot densitometry data were relative to the control NS group or control HS group (for experiments where only HS experiments were performed). Two‐factor ANOVA (genotype and diet) with Bonferroni's multiple comparisons test or unpaired 2‐tailed Student t tests were used to determine statistical significance and α=0.05.
Results
Deletion of CD NOS1 Results in Exaggerated Aldosterone and Plasma Sodium During HS Intake
To determine whether systemic RAAS was altered in CDNOS1KO mice, plasma renin concentration, aldosterone, and AngII were measured. Plasma renin concentration was appropriately suppressed in both genotypes as the salt in the diet was increased (Figure 1A). Furthermore, plasma AngII levels were also appropriately suppressed in both genotypes following the HS diet (control NS=22.5±2.5 fmol/mL, control HS=12.5±2.5 fmol/mL; CDNOS1KO NS=21.1±3.5 fmol/mL, CDNOS1KO HS=18.1±3.4 fmol/mL: P diet=0.04, P genotype and genotype×diet>0.05). As dietary sodium increased, control mice had significantly reduced plasma aldosterone concentration and urinary aldosterone excretion (Figure 1B and 1C). Although CDNOS1KO mice on an NS or HS diet had significantly reduced plasma aldosterone compared with those on an LS diet (Figure 1C), there was no further suppression with the HS diet. As a consequence, CDNOS1KO have significantly greater plasma aldosterone on an HS diet compared with control mice on an HS diet (Figure 1B).
Figure 1.
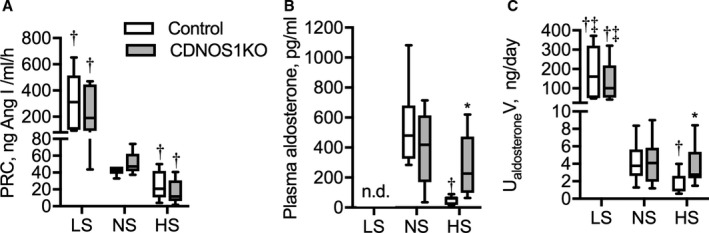
Plasma renin concentration (PRC), plasma aldosterone, and urinary aldosterone excretion from flox control and CD NOS1β knockout (CDNOS1KO) mice on 1 week of low sodium (LS), normal sodium (NS), or high sodium (HS) diets. Box plots with minimum and maximum are plotted for (A) PRC control (n=6/diet) and KO (n=7/diet). B, Plasma aldosterone, control NS and HS (n=8) and CDNOS1KO NS and HS (n=11). C, Urinary aldosterone excretion, control LS (n=6), NS and HS (n=11), CDNOS1KO LS (n=5), and NS and HS (n=9). *Represents P<0.05 compared with control, † P<0.05 compared with NS, ‡ P<0.05 compared with HS.
Plasma sodium, chloride, and potassium were determined in LS‐, NS‐, and HS‐fed mice. On an LS and an NS diet, there were no significant differences in plasma sodium (Figure 2A), plasma chloride (Figure 2B), or plasma potassium (Figure 2C) between the genotypes. However, plasma sodium under an HS diet significantly increased to 142±2 mEq/L, an average 3‐mEq increase, in control mice (Figure 2A). Plasma sodium was further elevated by an average of 7 mEq to 149±0.9 mEq/L in CDNOS1KO mice on an HS diet (Figure 2A; P genotype=0.04, P diet<0.001, P genotype×diet=0.01). Plasma chloride and potassium were not significantly affected by HS diet in either genotype (Figure 2B and 2C; all P genotype, diet and genotype×diet>0.05). Plasma hematocrit was also not significantly different between the control mice (36.1±0.8%) and the CDNOS1KO mice (37.2±0.3%, P=0.3) on an HS diet. Steady‐state urinary sodium excretion increased with greater dietary sodium; however, it was not statistically different between the genotypes (Table 2). Steady‐state urinary potassium excretion was not significantly different between genotypes or among diets (Table 2). To determine whether plasma potassium is properly regulated in CDNOS1KO mice, mice maintained on an NS diet underwent overnight fasting (3 pm until 8 am). Fasting plasma sodium was not significantly different between control and CDNOS1KO mice (Figure 2D; P=0.9). However, fasting plasma potassium was significantly elevated in CDNOS1KO mice compared with control mice (Figure 2E; P=0.02).
Figure 2.
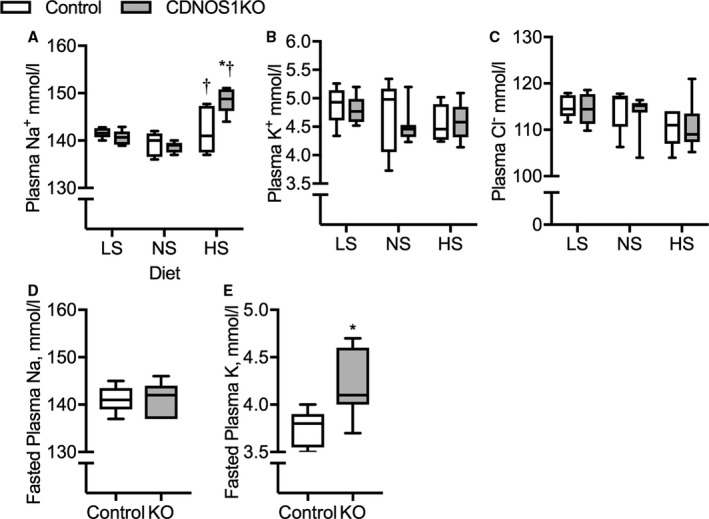
Plasma electrolytes from control and collecting duct nitric oxide synthase 1β knockout (CDNOS1KO) mice on 1 week of low sodium (LS), normal sodium (NS), or high sodium (HS) diets. Plasma collected in the morning. A, Plasma sodium, (B) plasma potassium, (C) plasma chloride. Control LS (n=8), NS (n=5), and HS (n=5). CDNOS1KO LS (n=6), NS (n=5), and HS (n=9). D and E, Plasma from mice on an NS diet that underwent an overnight fast and plasma collected in the morning. D, Fasted plasma sodium and (E) fasted plasma potassium. Control (n=5) and CDNOS1KO (n=7). *Represents P<0.05 compared with control, † P<0.05 compared with NS. KO indicates knockout.
Table 2.
Steady‐State Urinary Excretion
| LS | NS | HS | ||||||||||
|---|---|---|---|---|---|---|---|---|---|---|---|---|
| Sodium Chloride in Diet, % | <0.01 | 0.49 | 4.0 | |||||||||
| Sodium in Diet, % | <0.01 | 0.20 | 1.60 | |||||||||
| Genotype | Control | CDNOS1KO | Control | CDNOS1KO | Control | CDNOS1KO | ||||||
| No. | 6 | 6 | 6 | 6 | 6 | 6 | ||||||
| UNaV, mmol/d | 0.09 | (0.02)a, b | 0.1 | (0.02)a, b | 0.45 | (0.03) | 0.41 | (0.05) | 5.0 | (0.3)a | 4.1 | (0.4)a |
| UKV, mmol/d | 0.34 | (0.04) | 0.29 | (0.04) | 0.32 | (0.03) | 0.29 | (0.02) | 0.30 | (0.04) | 0.30 | (0.03) |
Mean (SEM). CDNOS1KO indicates collecting duct nitric oxide synthase 1β knockout; LS, low sodium; UNaV, urinary sodium excretion; UKV, urinary potassium excretion.
P<0.05 compared with normal sodium (NS).
P<0.05 compared with high sodium (HS).
Adrenal RAAS Expression is Altered in CDNOS1KO Mice on an HS Diet
Studies have determined that many organs, including the adrenal glands,20 have a RAAS including renal‐independent renin.21 To determine whether the intra‐adrenal RAAS was altered in CDNOS1KO mice on an HS diet, we measured mRNA expression of AT1, AT2, and renin. Although adrenal renin expression was not significantly different between control and CDNOS1KO mice on an HS diet, AT1a and AT1b levels were significantly elevated in the knockout mouse (Table 3). Adrenal AT2 mRNA was below detection in either genotype (Table 3). The mRNA for the enzymes CYP11B1 (converts deoxycorticosterone to corticosterone) and CYP11B2 (converts corticosterone to aldosterone) were not significantly different between the control and CDNOS1KO mice on an HS diet (Table 3).
Table 3.
Adrenal mRNA Expression From Control and CDNOS1KO Mice on a High Sodium Diet
| Control | CDNOS1KO | P Value | |||
|---|---|---|---|---|---|
| No. | 5 | 5 | |||
| Renin | 1.0 | (0.3) | 1.3 | (0.6) | 0.6 |
| AT1a | 1.0 | (0.04) | 1.5 | (0.2) | 0.03 |
| AT1b | 1.0 | (0.1) | 1.8 | (0.2) | 0.01 |
| AT2 | b.d. | b.d. | |||
| Cyp11B1 | 1.0 | (0.2) | 1.0 | (0.2) | 0.9 |
| Cyp11B2 | 1.0 | (0.2) | 1.4 | (0.3) | 0.3 |
Mean (SEM). AT1 indicates angiotensin II type 1; AT2, angiotensin II receptor type 2; b.d., below detection; CDNOS1KO, collecting duct nitric oxide synthase 1β knockout.
P<0.05.
Deletion of CD NOS1 Results in ENaC Activation With HS Intake
ENaC activity, channel number, and Po were determined in split‐open cortical CDs from control and CDNOS1KO mice on day 7 of LS, NS, or HS diets. We previously reported that on an NS diet, control and CDNOS1KO mice have similar ENaC activity, channel number, and Po,5 confirmed herein (Figure 3A through 3C, respectively). Likewise, in mice on an LS diet, there were no statistically significant differences in ENaC activity, channel number, or Po between the genotypes or compared with those on an NS diet (Figure 3A through 3C). Control mice on an HS diet showed the expected reduction in ENaC activity, and Po (Figure 3A and 3C; P<0.05) and tended to have a reduction in channel number (Figure 3B; P=0.09). Conversely, compared with control mice on an HS diet, CDNOS1KO mice had significantly higher ENaC activity, channel number, and Po (Figure 3A through 3C; P<0.05). Further, CDNOS1KO mice had significantly higher αENaC mRNA expression on LS, NS and HS diets versus control mice (Figure 3D; P<0.001). Protein abundance of cortical αENaC in tissue lysates from CDNOS1KO mice on an HS diet was similar to control mice on an HS diet. Proteolytic cleavage of αENaC was not significantly different in cortical lysates of CDNOS1KO mice compared with control mice on an HS diet (Figure 3E). Moreover, cortical γENaC (93 kDa) expression (control=1.0±0.3 AU, CDNOS1KO=1.3±0.2, P=0.4) and cleavage product (80 kDa) were not significantly different between control and CDNOS1KO mice on an HS diet (Figure 3F; P=0.8).
Figure 3.
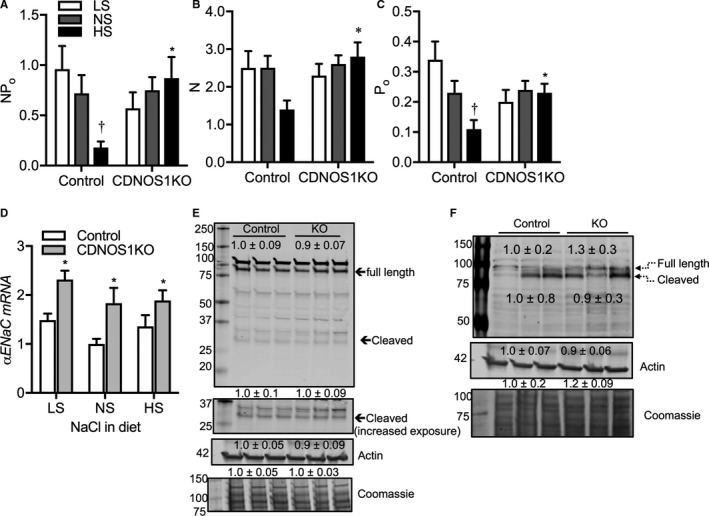
Cortical epithelial sodium channel (ENaC) activity and expression from control and collecting duct nitric oxide synthase 1β knockout (CDNOS1KO) mice on 1 week of low sodium (LS), normal sodium (NS), or high sodium (HS) diets. HS diet resulted in significantly reduced ENaC (A) activity (NP o), (B) open probability (Po), and (C) channel number (N) in cortical collecting ducts. However, dietary sodium does not significantly affect ENaC (A) NP o, (B) N, or (C) Po in cortical collecting ducts from CDNOS1KO mice. Observation numbers for electrophysiological experiments: control LS=17, NS=25, HS=9; CDNOS1KO LS=19, NS=58, HS=21. D, αENaC mRNA expression was significantly higher in CDNOS1KO mice compared with controls on all salt diets. E, There were no significant differences in full length or proteolytic cleavage of αENaC or (F) γENaC in cortical lysates of CDNOS1KO mice compared with controls on an HS diet. Numbers are mean±SEM densitometric values relative to controls. Control: NS (n=5), HS (n=9); CDNOS1KO: NS=6, and HS=8. *Represents P<0.05 compared with control, † P<0.05 compared with NS.
Deletion of CD NOS1 Increases Other Sodium Transporter Expression With HS Intake
Sodium balance involves regulation of a number of renal sodium channels and transporters along the nephron. To determine whether other sodium transporters were also significantly altered by deletion of NOS1β from the CD, we performed Western blots on cortical lysates for a panel of transporters (Figure 4) with the antibodies utilized shown in Table 1. As seen in the representative blots, CDNOS1KO mice on an NS diet had significantly higher expression of phosphorylated sodium‐chloride cotransporter (NCC; both T53 and T58), without a change in expression of total NCC. On an HS diet, there was a significant reduction in phosphorylated and total NCC in both genotypes when compared with those on an NS diet. However, CDNOS1KO mice presented with significantly higher phosphorylated NCC when compared with controls on an HS diet. Cortical NKCC2 was significantly higher in CDNOS1KO mice on NS and HS diets compared with controls, although HS feeding significantly reduced sodium–potassium–chloride cotransporter expression in both genotypes (P diet<0.001, P Genotype=0.05, P diet×genotype=0.9). There was no statistically significant effect of diet or genotype on the cortical expression of sodium, potassium ATPase α or β subunit, sodium‐hydrogen exchanger 3, or phosphorylated sodium‐hydrogen exchanger 3 (S552).
Figure 4.

Representative Western blots of sodium transporters from flox control and collecting duct nitric oxide synthase 1β knockout (CDNOS1KO) mice on a normal sodium (NS) diet or 1 week on a high sodium (HS) diet. Numbers are mean densitometry values normalized to flox NS for each protein. Representative actin‐ and Coomassie Blue–stained membranes demonstrate equal loading of samples among groups. Mean±SEM reported. Control NS (n=5), HS (n=9), CDNOS1KO NS (n=6), and HS (n=8). *Represents P<0.05 compared with control, † P<0.05 compared with NS. NCC indicates sodium‐chloride cotransporter; NHE, sodium‐hydrogen exchanger; NKA, sodium, potassium ATPase; NKCC2, sodium, potassium, two chloride cotransporter.
Cortical AngII is Elevated in CDNOS1KO Mice
To determine whether deletion of CD NOS1 resulted in changes in intrarenal RAS, we determined mRNA and protein expression of several components of the intrarenal RAS from cortex samples. From the immunohistochemical analysis, angiotensinogen was expressed in proximal tubules at a similar distribution between control and CDNOS1KO mice on LS, NS, and HS diets (Figure 5A). Cortical AngII content was also measured. In samples from control mice, cortical AngII significantly decreased as dietary sodium increased (Figure 5B). However, CDNOS1KO mice presented with a similar amount of cortical AngII regardless of the sodium in the diet (Figure 5B). As a consequence, CDNOS1KO mice on an HS diet presented with significantly greater cortical AngII than control mice (Figure 5B). Interestingly, CDNOS1KO mice had significantly lower cortical AngII levels on an LS diet compared with control mice (Figure 5B). As shown in Figure 5C through 5I, mRNA expression of renin, AT1a, AT2, and ACE1 were similar between the genotypes with LS, NS, or HS diets. Expression of angiotensinogen was significantly higher with an LS diet in both genotypes and ACE2 was lower with an LS diet in both genotypes (Figure 5C and 5F). Paradoxically, AT1b mRNA expression was found to be significantly higher with the NS diet in CDNOS1KO mice (Figure 5H). Cortical protein expression of prorenin/renin and angiotensinogen was similar between flox and CDNOS1KO mice, regardless of the sodium in the diet (Figure 6A). Prorenin was detected in the inner medullary lysates from flox and CDNOS1KO mice on an HS diet. However, there was no significant difference between abundance levels (Figure 6B). Furthermore, cortical ACE protein abundance (Figure 6C) and activity (Figure 6D) were not significantly different between the genotypes on an HS diet (P>0.05).
Figure 5.
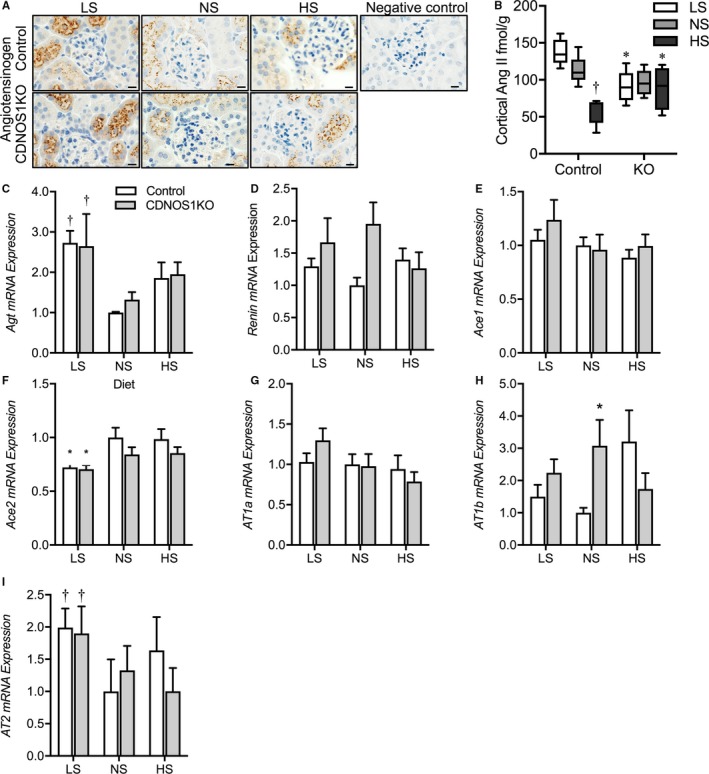
Protein expression of angiotensinogen (Agt) and angiotensin II (AngII) in flox control and collecting duct nitric oxide synthase 1β knockout (CDNOS1KO) mice and cortical mRNA expression of the AngII axis. Mice were fed a low sodium (LS), normal sodium (NS), or high sodium (HS) diet for 1 week. A, Representative sections of cortex stained with anti‐AngII or anti‐Agt. Negative controls lack primary antibodies. B, Cortical AngII content from control and CDNOS1KO mice on an HS diet (n=5/group). C through I, Relative to control NS, cortical mRNA expression of (C) Agt, (D) renin, (E) angiotensin‐converting enzyme (ACE)1, (F) ACE2, (G) angiotensin II receptor 1a (AT1a), (H) AT1b, and (I) AT2 (n=4/group). *Represents P<0.05 compared with control, † P<0.05 compared with NS. KO indicates knockout.
Figure 6.
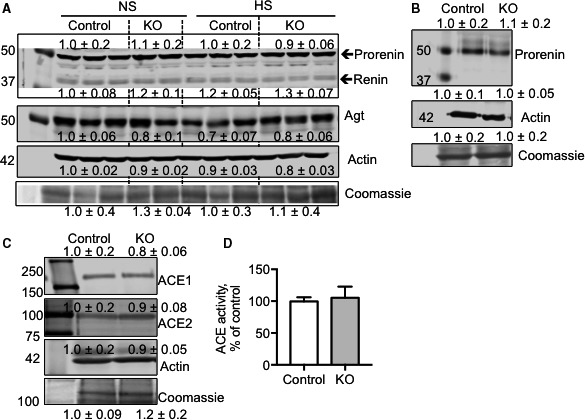
Protein abundance of angiotensinogen (Agt), renin, and angiotensin‐converting enzyme (ACE). A, Representative Western blots of cortical prorenin/renin, Agt, and loading control actin‐ and Coomassie Blue–stained membranes. Numbers are relative to control normal sodium (NS) densitometry and are mean±SEM NS (n=5/group) and high sodium (HS; n=3/group). B, Representative Western blots of prorenin expression in the inner medulla of mice on an HS diet (n=6/group). C, Representative Western blots of cortical ACE1 and ACE2. Numbers are relative to control densitometry and are mean±SEM HS (n=3/group). D, Cortical ACE activity after 1 week of an HS diet as expressed relative to control ACE activity. Control mice (N=7) and collecting duct nitric oxide synthase 1β knockout (CDNOS1KO) mice (N=4). KO indicates knockout.
Discussion
It is well established that in healthy individuals an increase in dietary sodium intake is balanced through an increase in sodium excretion. During high dietary sodium, generally there is suppression of the RAAS and intrarenal RAS with activation of natriuretic pathways including renal NO production to promote natriuresis. However, mechanistic insight into how the RAAS is suppressed and how NO promotes natriuresis is obscure. The current study has uncovered a unique interaction between CD NOS1β, RAAS, and intrarenal RAS during HS feeding, highlighting that loss of a single gene in the principal cell of the CD leads to systemic effects during HS feeding. CDNOS1KO mice exhibited a significant increase in plasma sodium with inappropriately high circulating aldosterone but normal plasma potassium, plasma renin concentration, and plasma AngII concentration. However, lacking NOS1β in the CD resulted in increased renal AngII concentration that was independent of changes in renal angiotensinogen expression, renal ACE activity, or plasma renin concentration. These systemic and renal RAAS effects under HS conditions were coupled with higher ENaC and NCC activity and NKCC2 abundance compared with control mice. These results point to a mechanism whereby HS‐induced activation of NOS1β in the CD regulates sodium homeostasis by suppression of aldosterone, suppression of renal AngII content, and inhibition of sodium reabsorption along the nephron.
The aldosterone‐sensitive distal nephron plays a pivotal role in the regulation of ion balance.22 There are a number of diseases that result in pathological handling of sodium and potassium in the aldosterone‐sensitive distal nephron. For example, there is severe sodium retention in patients with Liddle syndrome because of gain‐of‐function mutations in ENaC that result in a rightward shift in the pressure‐natriuresis curve to maintain sodium balance. In patients with hyperkalemic hypertension (pseudoaldosteronism type 2), mutations in WNK1, WNK4, and KLHL3 lead to activation of NCC, resulting in sodium and potassium retention.23 In these aforementioned examples, rare genetic mutations lead to these diseases, highlighting the important physiological role that the aldosterone‐sensitive distal nephron provides in sodium/potassium balance. In the current study, we determined a number of similar dysfunctional pathways when CD NOS1β activation is missing. First, there is NCC activation under NS and HS conditions, as reflected by significantly higher NCC phosphorylation,24 as well as inappropriately higher NKCC2 abundance in CDNOS1KO mice on NS or HS diets. Furthermore, there is a failure to suppress aldosterone as well as ENaC activity and ENaC channel number with HS feeding in CDNOS1KO mice. As a consequence, CDNOS1KO mice on an HS diet present with a significant increase in plasma sodium while maintaining normal plasma potassium. It is interesting to note, that we did not see a significant increase in plasma chloride, suggesting that there may be a significantly greater anion gap or perhaps differences in plasma bicarbonate in CDNOS1KO mice. Further study is needed.
Our data also suggest that CDNOS1KO may have a potassium‐handling defect, leading to a failure to suppress aldosterone on an HS diet. Although there were no significant differences in plasma potassium or steady‐state potassium excretion in CDNOS1KO mice in this study, an overnight fast of the animals unmasked a potassium‐handling problem with CDNOS1KO mice. The CDNOS1KO mice presented with significantly higher fasting plasma potassium levels on an NS diet. In humans, mineralocorticoids (ie, fludrocortisone) lead to an increase in NCC and NCC phosphorylation via potassium regulation,25 and aldosterone promotes ENaC‐dependent sodium reabsorption. Similarly, in rats, AngII infusion leads to an increase in ENaC activation and unregulated potassium secretion (as reflected by a significant reduction in plasma potassium) that secondarily stimulates NCC activity.17 Taken together, these data indicate that CD NOS1β functions to maintain sodium and, most likely, potassium balance. During consumption of an HS diet, if CD NOS1β activation is prevented, there is compensatory maintenance of circulating aldosterone leading to normalize plasma potassium at the expense of a loss of sodium homeostasis. Thus, HS‐mediated CD NOS1β activation functions to maintain systemic ion homeostasis through reducing ENaC activity and expression, NCC activation, and NKCC2 abundance, thereby promoting natriuresis. The mechanism linking CD NOS1β to aldosterone production, or rather how CD NOS1 promotes suppression of aldosterone during HS feeding, remains speculative at this point. Deciphering the mechanism of HS‐induced activation of NOS1β in the CD will be critical to elucidate novel therapies for maintenance of ion homeostasis and appropriate suppression of aldosterone. Studies are underway in our laboratory to fully understand these mechanism(s).
In animal models of AngII‐dependent hypertension, activation of intrarenal AngII via intrarenal ACE is critical for the increase in BP.7 This is also true in a model of low systemic infusion of AngII plus NOS inhibition; intrarenal ACE is required for the increase in BP observed in this model.13 CDNOS1KO mice on an HS diet show low plasma renin concentration and circulating AngII, which is similar to the model of low systemic AngII infusion with NOS inhibition. However, CDNOS1KO and control mice on an HS diet have similar expression of renal angiotensinogen, prorenin/renin, ACE, and AngII receptors. Thus, we conclude that CD NOS1β does not regulate intrarenal RAS per se. However, CD NOS1β does regulate renal AngII levels. As quantified by enzyme immunoassay, during HS feeding, mice lacking CD NOS1β have significantly higher renal AngII concentration. Increased renal AngII may also contribute to the inappropriate preservation of sodium channel/transporter abundance seen in CDNOS1KO mice on an HS diet, as AngII is well known to stimulate sodium channels/transporters along the nephron.26, 27, 28 Although the mechanism of how CD NOS1β regulates renal AngII remains speculative, recent work has determined that renal AngII levels are predominantly derived from the liver via uptake of liver‐derived angiotensinogen (a megalin‐dependent mechanism).29, 30 In the current study, renal‐derived angiotensinogen levels were determined by mRNA analysis, and did not correlate with renal AngII levels in CDNOS1KO mice on an HS diet. Furthermore, cortical angiotensinogen protein abundance (which would reflect liver‐derived angiotensinogen and renal‐derived angiotensinogen) also did not correlate with renal AngII levels in the CDNOS1KO mouse. Thus, if there is increased liver‐derived uptake by proximal tubules in CDNOS1KO mice, it is converted to AngII at a rate such that there is not a detectable difference in cortical angiotensinogen. However, this study did not detect a difference in prorenin/renin expression, ACE1 or ACE2 expression, or ACE activity. This suggests that the increased cortical AngII in HS‐fed CDNOS1KO mice may be derived via renin‐independent and ACE‐independent mechanisms. There is a growing body of evidence of renin‐independent and ACE‐independent AngII production via chymase.31, 32 For example, in the experimental hypertension models, Goldblatt 2‐kidney, 1‐clip model or the unilateral nephrectomy plus HS diet model, in vivo chymase inhibition (with chymostatin) resulted in a significant 75% and 50%, respectively, reduction in renal AngII content.33 Further study is warranted to determine whether CD NOS1β regulates renal AngII concentration through angiotensinogen uptake and/or chymase activity.
Study Limitations
A limitation to our study is that plasma aldosterone and plasma renin concentration were measured from plasma collected from anesthetized mice. However, it seems unlikely that CDNOS1KO mice on an HS diet have higher circulating aldosterone levels because of the anesthesia for the following reasons: (1) urinary aldosterone excretion from conscious, unrestrained mice mirrored the higher plasma aldosterone level in CDNOS1KO mice on an HS diet; (2) inappropriate ENaC activation was observed only in CDNOS1KO mice on an HS diet; and (3) plasma renin concentration suppression by an HS diet was further confirmed by the reduced circulating AngII in both genotypes on an HS diet (measurements obtained from plasma collected from restrained but conscious mice). The inappropriate concentration of circulating aldosterone may be partially explained by an increase in adrenal angiotensin II receptor type 1 receptor expression with HS in the CDNOS1KO mice, suggesting that CDNOS1KO mice have an increased sensitivity to AngII. Adrenal angiotensin II receptor type 1 receptor activation is a fundamental pathway resulting in aldosterone production.34
Perspective
It is well established that sodium is consumed in excess amounts in the industrialized world. Clinical studies have shown that sodium sensitivity occurs not only in patients with hypertension but also in persons with normotension.35 Furthermore, even in young patients, sodium intake significantly affects BP and pulse pressure.36 Combined with a one‐third incidence of high BP in the adult population, it is clear that determining mechanisms of natriuresis and BP control is necessary for the betterment of human health. Our data demonstrated that CD NOS1β‐derived NO plays a critical role in promoting natriuresis even when systemic RAAS and intrarenal RAS are appropriate. However, if CD NOS1β is absent or potentially mutated to prevent full functional activation during HS feeding, there is an initial inability to properly excrete the excess sodium leading to a rightward shift in pressure‐natriuresis and a return to balance.1 Mutations in NOS1 have correlated with hypertension in patients,37 including a single nucleotide polymorphism in intron 1,38 intron 21, or exon 29.39 Whether these NOS1 single nucleotide polymorphisms or other single nucleotide polymorphisms in genes mediating activation of NOS1 correlate with sodium‐sensitive BP changes remain to be determined.
Conclusions
This study demonstrates that sodium homeostasis is maintained during HS intake through activation of NOS1β in the CD. Loss of NOS1β in the CD during an HS diet exhibited a significant increase in plasma sodium with inappropriately high circulating and urinary aldosterone. High dietary sodium leads to elevated plasma sodium and endothelial dysfunction in humans40, 41, 42, 43 as well as loss of endothelial NO.44 Studies are underway in our laboratory to further probe the relationship of HS‐mediated activation of NOS1β in the CD with HS‐mediated loss of endothelial NOS3‐derived NO.
Author Contributions
Hyndman and Pollock conceived the original idea; Hyndman, Mironova, Stockand, Giani, Dugas, Collins, McDonough, and Pollock designed and performed the experiments listed; Hyndman and Pollock wrote the article; and Hyndman, Mironova, Stockand, Giani, Dugas, Collins, McDonough, and Pollock provided critical feedback and approved the article.
Sources of Funding
The research reported in this publication was supported by National Institutes of Health National Institute of Diabetes and Digestive and Kidney Diseases under award number K01DK105038 to Hyndman and National Institutes of Health National Heart, Lung, and Blood Institute under award number P01HL95499 and P01HL136267 to Stockand and Pollock, and P01HL69999 and AHA 15SFRN2390002 to Pollock.
Disclosures
None.
Acknowledgments
We would like to acknowledge and thank Dr Johannes Loffing (Institute of Anatomy, University of Zurich, Zurich, Switzerland) for providing antibodies used in these studies. We appreciate the technical help with the immunohistochemistry provided by Ms Xiaofen Liu, University of Alabama at Birmingham.
(J Am Heart Assoc. 2017;6:e006896 DOI: 10.1161/JAHA.117.006896.)
References
- 1. Hyndman KA, Boesen EI, Elmarakby AA, Brands MW, Huang P, Kohan DE, Pollock DM, Pollock JS. Renal collecting duct NOS1 maintains fluid‐electrolyte homeostasis and blood pressure. Hypertension. 2013;62:91–98. [DOI] [PMC free article] [PubMed] [Google Scholar]
- 2. Smith C, Merchant M, Fekete A, Nyugen HL, Oh P, Tain YL, Klein JB, Baylis C. Splice variants of neuronal nitric oxide synthase are present in the rat kidney. Nephrol Dial Transplant. 2009;24:1422–1428. [DOI] [PMC free article] [PubMed] [Google Scholar]
- 3. Hyndman KA, Xue J, MacDonell A, Speed JS, Jin C, Pollock JS. Distinct regulation of inner medullary collecting duct nitric oxide production from mice and rats. Clin Exp Pharmacol Physiol. 2013;40:233–239. [DOI] [PMC free article] [PubMed] [Google Scholar]
- 4. Hyndman KA, Arguello AM, Morsing SK, Pollock JS. Dynamin‐2 is a novel NOS1beta interacting protein and negative regulator in the collecting duct. Am J Physiol Regul Integr Comp Physiol. 2016;310:R570–R577. [DOI] [PMC free article] [PubMed] [Google Scholar]
- 5. Hyndman KA, Bugaj V, Mironova E, Stockand JD, Pollock JS. NOS1‐dependent negative feedback regulation of the epithelial sodium channel in the collecting duct. Am J Physiol Renal Physiol. 2015;308:F244–F251. [DOI] [PMC free article] [PubMed] [Google Scholar]
- 6. Giani JF, Shah KH, Khan Z, Bernstein EA, Shen XZ, McDonough AA, Gonzalez‐Villalobos RA, Bernstein KE. The intrarenal generation of angiotensin II is required for experimental hypertension. Curr Opin Pharmacol. 2015;21:73–81. [DOI] [PMC free article] [PubMed] [Google Scholar]
- 7. Gonzalez‐Villalobos RA, Janjoulia T, Fletcher NK, Giani JF, Nguyen MT, Riquier‐Brison AD, Seth DM, Fuchs S, Eladari D, Picard N, Bachmann S, Delpire E, Peti‐Peterdi J, Navar LG, Bernstein KE, McDonough AA. The absence of intrarenal ACE protects against hypertension. J Clin Invest. 2013;123:2011–2023. [DOI] [PMC free article] [PubMed] [Google Scholar]
- 8. Navar LG, Ichihara A, Chin SY, Imig JD. Nitric oxide‐angiotensin II interactions in angiotensin II‐dependent hypertension. Acta Physiol Scand. 2000;168:139–147. [DOI] [PubMed] [Google Scholar]
- 9. Sanders GD, Coeytaux R, Dolor RJ, Hasselblad V, Patel UD, Powers B, Yancy WS Jr, Gray RN, Irvine RJ, Kendrick A. Angiotensin‐Converting Enzyme Inhibitors (ACEIs), Angiotensin II Receptor Antagonists (ARBs), and Direct Renin Inhibitors for Treating Essential Hypertension: An Update. Rockville, MD: Agency for Healthcare Research and Quality (US); 2011. [PubMed] [Google Scholar]
- 10. Gu Q, Burt VL, Dillon CF, Yoon S. Trends in antihypertensive medication use and blood pressure control among United States adults with hypertension: the National Health and Nutrition Examination Survey, 2001 to 2010. Circulation. 2012;126:2105–2114. [DOI] [PubMed] [Google Scholar]
- 11. Kobori H, Nishiyama A, Abe Y, Navar LG. Enhancement of intrarenal angiotensinogen in Dahl salt‐sensitive rats on high salt diet. Hypertension. 2003;41:592–597. [DOI] [PMC free article] [PubMed] [Google Scholar]
- 12. Chin SY, Wang CT, Majid DS, Navar LG. Renoprotective effects of nitric oxide in angiotensin II‐induced hypertension in the rat. Am J Physiol. 1998;274:F876–F882. [DOI] [PubMed] [Google Scholar]
- 13. Giani JF, Janjulia T, Kamat N, Seth DM, Blackwell WL, Shah KH, Shen XZ, Fuchs S, Delpire E, Toblli JE, Bernstein KE, McDonough AA, Gonzalez‐Villalobos RA. Renal angiotensin‐converting enzyme is essential for the hypertension induced by nitric oxide synthesis inhibition. J Am Soc Nephrol. 2014;25:2752–2763. [DOI] [PMC free article] [PubMed] [Google Scholar]
- 14. Ramkumar N, Ying J, Stuart D, Kohan DE. Overexpression of renin in the collecting duct causes elevated blood pressure. Am J Hypertens. 2013;26:965–972. [DOI] [PubMed] [Google Scholar]
- 15. Bugaj V, Mironova E, Kohan DE, Stockand JD. Collecting duct‐specific endothelin B receptor knockout increases ENaC activity. Am J Physiol Cell Physiol. 2012;302:C188–C194. [DOI] [PMC free article] [PubMed] [Google Scholar]
- 16. Bugaj V, Pochynyuk O, Mironova E, Vandewalle A, Medina JL, Stockand JD. Regulation of the epithelial Na+ channel by endothelin‐1 in rat collecting duct. Am J Physiol Renal Physiol. 2008;295:F1063–F1070. [DOI] [PMC free article] [PubMed] [Google Scholar]
- 17. Veiras LC, Han J, Ralph DL, McDonough AA. Potassium supplementation prevents sodium chloride cotransporter stimulation during angiotensin II hypertension. Hypertension. 2016;68:904–912. [DOI] [PMC free article] [PubMed] [Google Scholar]
- 18. Sorensen MV, Grossmann S, Roesinger M, Gresko N, Todkar AP, Barmettler G, Ziegler U, Odermatt A, Loffing‐Cueni D, Loffing J. Rapid dephosphorylation of the renal sodium chloride cotransporter in response to oral potassium intake in mice. Kidney Int. 2013;83:811–824. [DOI] [PubMed] [Google Scholar]
- 19. Neels HM, van Sande ME, Scharpe SL. Sensitive colorimetric assay for angiotensin converting enzyme in serum. Clin Chem. 1983;29:1399–1403. [PubMed] [Google Scholar]
- 20. Peters J. Local renin‐angiotensin systems in the adrenal gland. Peptides. 2012;34:427–432. [DOI] [PubMed] [Google Scholar]
- 21. van Kats JP, Chai W, Duncker DJ, Schalekamp MA, Danser AH. Adrenal angiotensin: origin and site of generation. Am J Hypertens. 2005;18:1104–1110. [DOI] [PubMed] [Google Scholar]
- 22. Meneton P, Loffing J, Warnock DG. Sodium and potassium handling by the aldosterone‐sensitive distal nephron: the pivotal role of the distal and connecting tubule. Am J Physiol Renal Physiol. 2004;287:F593–F601. [DOI] [PubMed] [Google Scholar]
- 23. Louis‐Dit‐Picard H, Barc J, Trujillano D, Miserey‐Lenkei S, Bouatia‐Naji N, Pylypenko O, Beaurain G, Bonnefond A, Sand O, Simian C, Vidal‐Petiot E, Soukaseum C, Mandet C, Broux F, Chabre O, Delahousse M, Esnault V, Fiquet B, Houillier P, Bagnis CI, Koenig J, Konrad M, Landais P, Mourani C, Niaudet P, Probst V, Thauvin C, Unwin RJ, Soroka SD, Ehret G, Ossowski S, Caulfield M; International Consortium for Blood P , Bruneval P, Estivill X, Froguel P, Hadchouel J, Schott JJ, Jeunemaitre X. KLHL3 mutations cause familial hyperkalemic hypertension by impairing ion transport in the distal nephron. Nat Genet. 2012;44:456–460, S451–453. [DOI] [PubMed] [Google Scholar]
- 24. Yang SS, Fang YW, Tseng MH, Chu PY, Yu IS, Wu HC, Lin SW, Chau T, Uchida S, Sasaki S, Lin YF, Sytwu HK, Lin SH. Phosphorylation regulates NCC stability and transporter activity in vivo. J Am Soc Nephrol. 2013;24:1587–1597. [DOI] [PMC free article] [PubMed] [Google Scholar]
- 25. Wolley MJ, Wu A, Xu S, Gordon RD, Fenton RA, Stowasser M. In primary aldosteronism, mineralocorticoids influence exosomal sodium‐chloride cotransporter abundance. J Am Soc Nephrol. 2017;28:56–63. [DOI] [PMC free article] [PubMed] [Google Scholar]
- 26. Castaneda‐Bueno M, Cervantes‐Perez LG, Vazquez N, Uribe N, Kantesaria S, Morla L, Bobadilla NA, Doucet A, Alessi DR, Gamba G. Activation of the renal Na+:Cl‐ cotransporter by angiotensin II is a WNK4‐dependent process. Proc Natl Acad Sci USA. 2012;109:7929–7934. [DOI] [PMC free article] [PubMed] [Google Scholar]
- 27. Mamenko M, Zaika O, Ilatovskaya DV, Staruschenko A, Pochynyuk O. Angiotensin II increases activity of the epithelial Na+ channel (ENaC) in distal nephron additively to aldosterone. J Biol Chem. 2012;287:660–671. [DOI] [PMC free article] [PubMed] [Google Scholar]
- 28. Nguyen MT, Han J, Ralph DL, Veiras LC, McDonough AA. Short‐term nonpressor angiotensin II infusion stimulates sodium transporters in proximal tubule and distal nephron. Physiol Rep. 2015;3(9). [DOI] [PMC free article] [PubMed] [Google Scholar]
- 29. Matsusaka T, Niimura F, Pastan I, Shintani A, Nishiyama A, Ichikawa I. Podocyte injury enhances filtration of liver‐derived angiotensinogen and renal angiotensin II generation. Kidney Int. 2014;85:1068–1077. [DOI] [PMC free article] [PubMed] [Google Scholar]
- 30. Matsusaka T, Niimura F, Shimizu A, Pastan I, Saito A, Kobori H, Nishiyama A, Ichikawa I. Liver angiotensinogen is the primary source of renal angiotensin II. J Am Soc Nephrol. 2012;23:1181–1189. [DOI] [PMC free article] [PubMed] [Google Scholar]
- 31. Ahmad S, Simmons T, Varagic J, Moniwa N, Chappell MC, Ferrario CM. Chymase‐dependent generation of angiotensin II from angiotensin‐(1‐12) in human atrial tissue. PLoS One. 2011;6:e28501. [DOI] [PMC free article] [PubMed] [Google Scholar]
- 32. Ahmad S, Varagic J, VonCannon JL, Groban L, Collawn JF, Dell'Italia LJ, Ferrario CM. Primacy of cardiac chymase over angiotensin converting enzyme as an angiotensin‐(1‐12) metabolizing enzyme. Biochem Biophys Res Commun. 2016;478:559–564. [DOI] [PMC free article] [PubMed] [Google Scholar]
- 33. Roszkowska‐Chojecka MM, Walkowska A, Gawrys O, Baranowska I, Kalisz M, Litwiniuk A, Martynska L, Kompanowska‐Jezierska E. Effects of chymostatin, a chymase inhibitor, on blood pressure, plasma and tissue angiotensin II, renal haemodynamics and renal excretion in two models of hypertension in the rat. Exp Physiol. 2015;100:1093–1105. [DOI] [PubMed] [Google Scholar]
- 34. van Kats JP, de Lannoy LM, Jan Danser AH, van Meegen JR, Verdouw PD, Schalekamp MA. Angiotensin II type 1 (AT1) receptor‐mediated accumulation of angiotensin II in tissues and its intracellular half‐life in vivo. Hypertension. 1997;30:42–49. [DOI] [PubMed] [Google Scholar]
- 35. Weinberger MH, Fineberg NS, Fineberg SE, Weinberger M. Salt sensitivity, pulse pressure, and death in normal and hypertensive humans. Hypertension. 2001;37:429–432. [DOI] [PubMed] [Google Scholar]
- 36. du Cailar G, Mimran A, Fesler P, Ribstein J, Blacher J, Safar ME. Dietary sodium and pulse pressure in normotensive and essential hypertensive subjects. J Hypertens. 2004;22:697–703. [DOI] [PubMed] [Google Scholar]
- 37. Padmanabhan S, Menni C, Lee WK, Laing S, Brambilla P, Sega R, Perego R, Grassi G, Cesana G, Delles C, Mancia G, Dominiczak AF. The effects of sex and method of blood pressure measurement on genetic associations with blood pressure in the PAMELA study. J Hypertens. 2010;28:465–477. [DOI] [PubMed] [Google Scholar]
- 38. Levinsson A, Olin AC, Bjorck L, Rosengren A, Nyberg F. Nitric oxide synthase (NOS) single nucleotide polymorphisms are associated with coronary heart disease and hypertension in the INTERGENE study. Nitric Oxide. 2014;39:1–7. [DOI] [PubMed] [Google Scholar]
- 39. Iwai N, Tago N, Yasui N, Kokubo Y, Inamoto N, Tomoike H, Shioji K. Genetic analysis of 22 candidate genes for hypertension in the Japanese population. J Hypertens. 2004;22:1119–1126. [DOI] [PubMed] [Google Scholar]
- 40. He FJ, MacGregor GA. Hypertension: salt: flawed research should not divert actions to reduce intake. Nat Rev Nephrol. 2016;12:514–515. [DOI] [PubMed] [Google Scholar]
- 41. He FJ, Markandu ND, Sagnella GA, de Wardener HE, MacGregor GA. Plasma sodium: ignored and underestimated. Hypertension. 2005;45:98–102. [DOI] [PubMed] [Google Scholar]
- 42. Suckling RJ, He FJ, Markandu ND, MacGregor GA. Dietary salt influences postprandial plasma sodium concentration and systolic blood pressure. Kidney Int. 2012;81:407–411. [DOI] [PubMed] [Google Scholar]
- 43. Matthews EL, Brian MS, Ramick MG, Lennon‐Edwards S, Edwards DG, Farquhar WB. High dietary sodium reduces brachial artery flow‐mediated dilation in humans with salt‐sensitive and salt‐resistant blood pressure. J Appl Physiol (1985). 2015;118:1510–1515. [DOI] [PMC free article] [PubMed] [Google Scholar]
- 44. Oberleithner H, Riethmuller C, Schillers H, MacGregor GA, de Wardener HE, Hausberg M. Plasma sodium stiffens vascular endothelium and reduces nitric oxide release. Proc Natl Acad Sci USA. 2007;104:16281–16286. [DOI] [PMC free article] [PubMed] [Google Scholar]