

Abstract
Background
Stroke is a leading cause of long‐term disability worldwide. However, current therapies that promote functional recovery from stroke are limited to physical rehabilitation. No pharmacological therapy is available. Thus, understanding the role of histone deacetylase 2 (HDAC2) in the pathophysiological process of stroke‐induced functional loss may provide a novel strategy for stroke recovery.
Methods and Results
Focal stroke was induced by photothrombosis. LV‐HDAC2‐shRNA‐GFP, LV‐GFP, Ad‐HDAC2‐Flag, or Ad‐inactive‐HDAC2‐Flag was microinjected into the peri‐infarct area immediately after stroke. HDAC inhibitors were microinjected into the peri‐infarct area 4 to 10 days after stroke. Grid‐walking task and cylinder task were conducted to assess motor function. Golgi‐Cox staining, chromatin immunoprecipitation, and electrophysiology were used to reveal the mechanisms underlying stroke recovery. Knockdown or knockout of HDAC2 promoted stroke recovery, whereas overexpression of HDAC2 worsened stroke‐induced functional impairment. More importantly, trichostatin A, a pan‐HDAC inhibitor, promoted functional recovery from stroke in WT mice when used in the delayed phase, but it was ineffective in Hdac2 conditional knockout (Hdac2 CKO) mice. Treatment with suberoylanilide hydroxamic acid, a selective HDAC1 and HDAC2 inhibitor, in the delayed phase of stroke produced sustained functional recovery in mice via epigenetically enhancing neuroplasticity of surviving neurons in the peri‐infarct zone.
Conclusions
Our novel findings provide evidence that HDAC2 is a crucial target for functional recovery from stroke. As there are clinically available HDAC inhibitors, our findings could be directly translated into clinical research of stroke.
Keywords: epigenetics, functional recovery, histone deacetylase 2, histone deacetylase inhibitor, stroke
Subject Categories: Animal Models of Human Disease, Basic Science Research, Epigenetics, Ischemic Stroke, Mechanisms
Clinical Perspective
What Is New?
Histone deacetylase 2 is a crucial target contributing to functional loss after stroke, and delayed administration of suberoylanilide hydroxamic acid promotes functional recovery from stroke.
What Are the Clinical Implications?
As histone deacetylase inhibitors are clinically available, our findings have great potential to translate into clinical stroke treatment.
Introduction
Stroke is a major public health problem leading to a high rate of disability in adults.1 Enhanced motor representations because of task‐specific training have been demonstrated for several decades in both human and animal studies,2 suggesting an ability of the brain to rewire itself to restore lost functions. The modification of neuronal connections after stroke may result from neuroplasticity.3, 4 Plasticity mechanisms include activity‐dependent rewiring and synapse strengthening.5 These raise the possibility that enhancing neuroplasticity may enhance functional recovery after stroke. However, current therapies that promote functional recovery from stroke are limited to physical rehabilitation, and no pharmacological therapy based on neuroplasticity is available. Because a rapid excitatory death occurs within minutes to hours inside the focal ischemic core,6, 7 no functional recovery is anticipated in the infarction itself. Alternatively, neuroplasticity‐mediated circuit reorganization occurs in the peri‐infarct zone,5, 8 the region surrounding the core infarct area, which is critical for the recovery of functional loss after stroke. Therefore, there is a great need to develop a pharmacological therapy that promotes neuroplasticity in the peri‐infarct zone to rescue the functional loss after stroke.
Based on the concept that heightened neuroplasticity promotes stroke recovery, several studies have referred to pharmacological means in order to remove restraints on recovery, such as reducing γ‐aminobutyric acid tonic inhibition in the peri‐infarct area.9 However, directly inhibiting extrasynaptic γ‐aminobutyric acidA receptors to reduce γ‐aminobutyric acid tonic inhibition improves functional recovery after stroke but might bring the side effect of seizures.10 Histone deacetylases (HDACs) remove acetyl groups from proteins, leading to a net decrease in histone acetylation levels and a more compact conformation that suppresses gene transcription. Inhibition of HDACs by HDAC inhibitors leads to a more transcriptionally active chromatin, upregulates the expression of a vast set of neuroplasticity‐related genes, and might be a promising strategy for promoting functional recovery from stroke.11, 12 HDACs have been divided into classes I (HDAC 1–3, 8), II (HDAC 4–7, 9, and 10), III (sirtuins), and IV (HDAC 11).13 Although a variety of HDAC inhibitors, including pan‐ and class‐specific inhibitors, when used before, immediately after, or within hours after stroke, can protect against ischemic damage and improve long‐term functional outcome,6, 14, 15 showing neuroprotection in the very early phase after stroke, it remains unknown whether HDAC inhibitors, when used in the delayed phase after stroke, are useful for promoting recovery. Delayed pharmacological therapy that promotes functional recovery is of great practical importance, because most patients with stroke go to hospitals hours or days after the initial event in developing countries.16 We now investigated whether HDAC2 is implicated in the pathological process of stroke‐induced functional loss, and if so, screened drugs targeting HDAC2 to promote functional recovery.
Materials and Methods
Animals
HDAC2flox/flox mice (C57/BL6 background), exons 5 and 6 with loxP recombination sites, were generated and maintained at Model Animal Research Center of Nanjing University (Nanjing, China). A total of 38 male HDAC2flox/flox mice were used in this study. Nervous system Hdac2 conditional knockout (Hdac2 CKO) mice were generated by crossing Nestin‐CRE+/− mice with HDAC2flox/flox mice (from Model Animal Research Center of Nanjing University, China). A total of 40 male Hdac2 CKO mice were used in experiments. A total of 492 male young adult (6–7 weeks) C57BL/6 mice (from Model Animal Research Center of Nanjing University, China) were used. An experimenter labeled all animals before allocation. Experiments were performed by investigators who were blinded to group allocation. All animal protocols were approved by the Institutional Animal Care and Use Committee of Nanjing Medical University.
Recombinant Virus Production and Stereotaxic Injection
The recombinant Ad‐HDAC2‐Flag and Ad‐inactive‐HDAC2‐Flag were produced by GeneChem Co, Ltd (Shanghai, China). To generate catalytically inactive HDAC2, the fusion protein of HDAC2 (amino acids 1–288) and β‐galactosidase (HDAC2‐LacZ) was expressed via the adenovirus system. The coding sequences of mouse HDAC2 and inactive HDAC2 were amplified by real‐time polymerase chain reaction (RT‐PCR). The primers were as follows. For Hdac2, forward: 5′‐CGG GTA CCG GTC GCC ACC ATG GCG TAC AGT CAA GGA G‐3′, reverse: 5′‐CGG AAT TCT CAC TTG TCA TCG TCA TCC TTG TAG TCA GGG TTG CTG AGT TGT TCT G‐3′; for inactive Hdac2, forward: 5′‐GAG GAT CCC CGG GTA CCG GTC GCC ACC ATG GCG TAC AGT CAA GGA G‐3′, reverse: 5′‐TCA TCC TTG TAG TCG CTT TTG ACA GTT AGA TTG AAA C‐3′. The PCR fragments and the pDC315 plasmid were digested with AgeI and EcoRI, and ligated with T4 DNA ligase to produce pDC315‐HDAC2‐Flag or pDC315‐inactive‐HDAC2‐Flag, which overexpress HDAC2 or inactive HDAC2 protein with a flag tag in the C terminal. The plasmid was used to transform competent DH5α Escherichia coli bacterial strains for identification. Using 10 μL Lipofectamine 2000 mixed with 50 μL DMEM, HEK293 cells were cotransfected with (5 μg pDC315‐HDAC2‐Flag or pDC315‐inactive‐HDAC2‐Flag) and 5 μg pBHG loxΔE1,3 cre plasmid as a helper plasmid to generate the recombinant adenovirus Ad‐HDAC2‐Flag and Ad‐inactive‐HDAC2‐Flag, respectively. Fifty days later, supernatant was harvested from HEK293 cells. After 2× virus amplification, the supernatant was filtered at 0.45 μm and purified using the adeno‐X virus purification kit (BD Bioscience Clontech). After resuspension, serially diluted adenovirus was used to transduce HEK293 cells. Seven days later, labeled HEK293 cells were counted to calculate the viral titer (1.5×10⁹ virus particles per mL).
The shRNA of HDAC2 was constructed and synthesized by GeneChem Co, Ltd (Shanghai, China). The target sequence used against mouse Hdac2 was as follows: 5′‐CAA TGA GTT GCC ATA TAA T‐3′. Recombinant lentivirus expression plasmid and packaging plasmids were generated using Lipofectamine 2000. The specificity and efficiency of the shRNAs were validated, and high titers of engineered lentiviruses (1×10⁹ virus particles per mL) were produced as described above.
The virus solution (2 nL/s, 2 μL) was delivered to the peri‐infarct area via stereotaxic injection (injection site: anterior–posterior, 0 mm from bregma; medial–lateral, 1.5 mm; dorsal–ventral, 1.3 mm from the brain surface). Injection needles were left in place for 10 minutes to assure even distribution of the virus after virus injection.
Photothrombotic Model of Stroke
Focal cortical ischemia was induced in mice by photothrombosis of cortical microvessels as previously described.9 Briefly, mice were anesthetized with isoflurane, and placed in a stereotaxic device. The skull was exposed by incising the midline, clearing connective tissue and keeping the surface dry. A cold light source (World Precision Instruments) attached to an opaque template with an opening for giving a 2‐mm‐diameter 12 000‐lux illumination was positioned 1.5 mm lateral from bregma. Rose Bengal solution (Sigma; 100 mg/kg, IP) was administered. Five minutes later, the brain was illuminated for 15 minutes through the intact skull. Through light excitation, singlet oxygen was generated from Rose Bengal, which damages and occludes vascular endothelium, leading to focal cortical stroke. Body temperature was maintained at 37±0.5°C with a thermostatically controlled infrared lamp. Animals were then returned to their cages and closely monitored until they recovered from anesthesia. Control mice received the same dose of Rose Bengal without illumination.
Neuroscore Assessment and Infarct Volume Measurement
The neuroscore assessment and infarct volume measurement were performed 3 days after photothrombotic stroke. Measurement of neurological functional outcome was determined by the modified Neurological Severity Score test.17 Neuroscore was graded from 0 to 18 (normal score, 0; maximal deficit score, 18). Severe injury is indicated by a score of 13 to 18, moderate injury 7 to 12, and mild injury 1 to 6. In the severity scores of impairment, 1 point is scored for the inability to perform the task or lacking proper response for a given reflex. After that, infarct size was determined by Nissl‐staining according to the manufacturer's instruction (Beyotime Biotechnology).
To establish a priori exclusion criteria for tested animals, the correlation between lesion size and neuroscore was estimated with Pearson correlation coefficient (R) at 3 days after photothrombotic stroke. The overall correlation was R=0.863 (n=12, P<0.001), suggesting that neuroscore correlates well with the lesion size after stroke (Figure S1). Thus, animals whose neuroscore was <7 (with mild lesion size) were excluded before functional recovery assessment. For drug experiments, animals whose neuroscore was <7 were excluded and the remaining animals were randomly allocated to groups at 3 days after stroke by computer‐generated randomization schedules. For recombinant virus experiments, animals were randomly allocated to groups before stroke by computer‐generated randomization schedules and animals whose neuroscore was <7 were excluded at 3 days after stroke.
Cannula Implantation and Drug Microinjection
The surgical procedure was the same as described above. Stainless steel guide cannulae (26 gauge, 3.5 mm, RWD Life Science Co, Ltd) were implanted into the core of the infarction (1.5 mm lateral from bregma, and 1.0 mm vertical from the cortical surface) and fixed to the skull with adhesive luting cement and acrylic dental cement. Following surgery, a stainless steel obturator was inserted into the guide cannula to avoid obstruction until microinjection was made. Mice were briefly head‐restrained, while the stainless steel obturator was removed and an injection tube (30 gauge, 4.0 mm, RWD Life Science Co, Ltd) was inserted into the guide cannula. The injection tube was designed to protrude 0.5 mm from the tip of the catheter, thus penetrating into the penumbra. A dose of drugs was slowly infused at a flow‐rate of 0.2 μL/min to a total volume of 2 μL. Following injection, the injection cannula was left in place for 5 minutes to allow drugs to reduce back‐flow. The stainless steel obturator was subsequently reinserted into the guide cannula.
Grid‐Walking Task
A 12‐mm square wire mesh with a grid area of 320×200×500 mm (length×width×height) was manufactured as the apparatus to conduct the grid‐walking task.9 A camera was positioned beneath the device to video footage in order to assess the stepping errors (foot faults). Each mouse was placed individually on the top of the elevated wire grid and allowed to freely move for 5 minutes. Analysis was performed offline by a rater who was blind to the treatment group of the animals in the study. The total number of foot‐fault and non‐foot‐fault steps for each limb were counted. A ratio between foot faults and total steps was calculated as follows: number of foot faults/(foot faults+number of non‐foot‐fault steps)×100. The differences between animals and trials in the degree of locomotion were excluded by calculating the ratio between foot faults and total steps taken. If a step was not providing support and the foot went through the grid hole, this was considered a fault. If an animal was resting with the grid at the level of the wrist, this was also defined as a fault.
Spontaneous Forelimb Task (Cylinder Task)
The use of forelimbs for vertical wall exploration was encouraged in the spontaneous forelimb task.18 When placed in a Plexiglas cylinder (150 mm in height with a diameter of 100 mm), the mouse spontaneously stood up by pressing the cylinder wall with either one or both of its forelimbs. Each mouse was allowed to freely explore for a period of 5 minutes and was videotaped. The video footage was analyzed offline by calculating the time (seconds) during each rear that each animal spent on either the right forelimb, the left forelimb, or on both forelimbs in slow motion (one fifth real time speed). Only rears in which both forelimbs could be clearly seen were included in our analysis. The percentage of time spent on each limb was calculated, and these data were used to derive an asymmetry index, as follows: (percent ipsilateral use)−(percent contralateral use).
Golgi‐Cox Staining, Imaging, and Analysis
Freshly dissected mouse brains were used for Golgi‐Cox staining with the FD Rapid GolgiStain kit (FD Neuro Technologies) according to the manufacturer's protocol. Briefly, mouse brains were incubated in Golgi solution A+B for 7 days followed by 1 day in solution C. Coronal sections (100 μm) were cut with a Vibratome (VT1200s, Leica) and stained. Images of Golgi‐stained neurons were acquired on a Zeiss Axio microscope. Each neuron was reconstructed using imaris 7.5.2 software, and all analyses were performed using the image J Sholl analysis Plugin; the center of all concentric circles was defined as the center of cell soma. To calculate spine density, a length of dendrite was traced and measured, the number of spines along which were counted, and the spine density was calculated from the number of spines divided by the length of dendrite. The total number of dendritic branches was counted at each order away from the cell body or dendritic shaft, and the total length of dendrites was the sum of the dendritic length from 1 neuron. To assess the complexity of neural dendrites, the number of dendrites that cross a series of concentric circles at 5‐μm intervals from the soma was determined using Adobe Illustrator CS5. Only pyramidal neurons in the peri‐infarct cortex (within 200 μm of the infarct) were included in our analyses. Per condition, 26 to 30 neurons from 6 animals were analyzed in a blinded manner.
Western Blot Analysis
Western blot analysis was performed as previously described in detail.19 Briefly, peri‐infarct cortex tissue was rapidly dissected around the stroke infarct core over the ice box as shown in Figure S2.9 The equivalent region of cortex was taken in sham mice. The primary antibodies were as follows: Rabbit anti‐HDAC2 (1:2000, ab32117, Abcam), rabbit anti‐HDAC3 (1:2000, ab16047, Abcam), rabbit anti‐histone H4 (1:500, ab10158, Abcam), rabbit anti‐acetylated histone H4 (acetyl‐K5) (1:1000, ab51997, Abcam), mouse anti‐Flag (1:1000, F1804, Sigma), rabbit anti‐synapsin (1:1000, AB1543, Millipore), rabbit anti‐spinophilin (1:2000, 06‐852, Millipore), or rabbit anti PSD‐95 (1:1000, 2507, CST). Mouse anti‐GAPDH (1:4000, KC‐5G4, KangChen Bio‐tech) or mouse anti‐β‐actin (1:4000, A1978, Sigma) was used as internal control. Appropriate horseradish peroxidase–linked secondary antibodies were used for detection by enhanced chemiluminescence (Pierce).
Chromatin Immunoprecipitation (ChIP)
ChIP assays were performed using a ChIP assay kit (EMD Millipore). Briefly, DNA and its associated proteins of the peri‐infarct tissue were chemically cross‐linked by addition of 37% formaldehyde (1% final concentration) for 15 minutes at 37°C. The cross‐link reaction was then quenched with glycine (0.125 mol/L final concentration) for 5 minutes. Branson Digital Sonifier 450 was used to shear the DNA to a size between 200 and 1000 base pairs through sonicating at 45% maximum amplitude for twenty‐five 20‐s pulses (50‐s pause between pulses). Cell debris was removed by centrifugation, and supernatants were diluted with ChIP dilution buffer. A fraction of the diluted supernatant was used for immunoprecipitation input control. The remainder was subjected to pre‐clearing by incubation with Protein A‐Sepharose beads for 30 minutes at 4°C, followed by immunoprecipitation overnight using antibody against acetylated histone H4 (acetyl‐K5, ab51997, Abcam). Immune complexes were collected by incubation with Protein A‐Sepharose beads for 1 hour at 4°C. Beads were collected and subjected to a series of sequential washes. Bound complexes were eluted from the beads by vortexing in elution buffer containing 1% SDS and 0.1 mol/L NaHCO3, and crosslinking was reversed by incubation overnight at 65°C. Purified DNA samples were normalized and subjected to real‐time PCR for 45 cycles, using primer pairs specific for 150 to 250 base pair segments corresponding to mouse gene promoter regions (regions upstream of the start codon, near the first exon). Real‐time PCR results were further analyzed by 2% agarose gel electrophoresis.
Real‐Time PCR
Real‐time PCR was performed with SYBR‐Green‐based reagents (FastStart Universal SYBR Green master; Roche), using a Lightcycler96 real‐time PCR Detection system (Roche). The relative quantities of immunoprecipitated DNA fragments were calculated by using the comparative cycle threshold (CT) method. All reactions were performed in triplicate.
Primer sequences used for PCR were as follows: Bdnf p1, 5′‐TGA TCA TCA CTC ACG ACC ACG‐3′ and 5′‐CAG CCT CTC TGA GCC AGT TAC G‐3′; Bdnf p4, 5′‐GCG CGG AAT TCT GAT TCT GGT AAT‐3′ and 5′‐GAG AGG GCT CCA CGC TGC CTT GAC G‐3′; Egr‐1, 5′‐CCT GGT AAG AGG CAA CTG CT‐3′ and 5′‐CGA ATC GGC CTC TAT TTC AA‐3′; Fos, 5′‐GAA AGC CTG GGG CGT AGA GT‐3′ and 5′‐CCT CAG CTG GCG CCT TTA T; Arc, 5′‐CAG CAT AAA TAG CCG CTG GT‐3′ and 5′‐GAG TGT GGC AGG CTC GTC‐3′; Psd95, 5′‐CCC CTA CCC CTC CTG AGA AT‐3′ and 5′‐GAG GGG AAG GAG AAG GTT GG‐3′; Synapsin2, 5′‐GGC TTT CCT TCC CTC CAC AC‐3′ and 5′‐TGT TAG CGA GGG AGC AGT GG‐3′; CaMK2a, 5′‐GAC CTG GAT GCT GAC GAA G‐3′ and 5′‐AGG TGA TGG TAG CCA TCC TG‐3′; Creb, 5′‐CTA CAC CAG CTT CCC CGG T‐3′ and 5′‐ACG GAA ACA GCC GAG CTC‐3′; Cdk5, 5′‐CGC AGC CTG TTG GAC TTT GT‐3′ and 5′‐GCG TTG CAG AGG AGG TGG TA‐3′.
Immunostaining, Imaging, and Analysis
The details of immunofluorescence for brain section have been reported previously.20 Briefly, mice were anesthetized with ketamine and perfused transcardially with 0.9% saline followed by 4% paraformaldehyde. The brain samples were removed and postfixed with 4% paraformaldehyde, and sectioned into 40‐μm floating slices using a Vibratome (VT1200s, Leica). Slices were blocked in PBS containing 3% normal goat serum, 0.3% (w/v) Triton X‐100, and 0.1% BSA at room temperature for 1 hour, followed by incubation in primary antibody at 4°C overnight. The primary antibodies were used as follows: Rabbit‐anti HDAC2 (1:1000, ab32117, Abcam), mouse‐anti NeuN (1:500, MAB377, Millipore), and chicken‐anti GFAP (1:1000, AB5541, Millipore). Secondary antibodies used were goat‐anti‐mouse Alexa488 (1:400, 115‐545‐003, Jackson ImmunoResearch Laboratories), goat‐anti‐rabbit Cy3 (1:200, 111‐165‐003, Jackson ImmunoResearch Laboratories), and goat‐anti‐chicken Alexa488 (1:400, 103‐545‐155, Jackson ImmunoResearch Laboratories). Images were captured with a fluorescence microscope (Axio Imager, Zeiss) or a confocal laser‐scanning microscope (LSM700, Zeiss) at identical settings at the highest intensity for each of the conditions.
HDAC Activity Assay
HDAC activity in peri‐infarct cortical samples was measured according to the manufacturer's protocol (EMD Millipore). For HDAC2‐specific activity, immunoprecipitation with HDAC2 antibody was performed before the assay as described previously.21 Briefly, tissue lysates prepared in immunoprecipitation buffer (50 mmol/L Tris‐HCl, 150 mmol/L NaCl, 5 mmol/L EDTA, 0.5% NP‐40, pH 8.0, supplemented with 1 mmol/L phenylmethyl sulfonylfluoride (PMSF)) were incubated with 0.5 μL mouse anti‐HDAC2 (ab32117, Abcam), and 20 μL protein G‐Agarose (Sigma) overnight on a tube rotator at 4°C. Then beads were centrifuged at 5000g and washed 5 times in PBS. HDAC assay substrate was added to the beads and incubated at 30°C for 40 minutes. Finally, activator solution containing trichostatin A (HDAC inhibitor) was used to stop the reaction, and the supernatant was used for fluorescent measurement. Fluorescent was measured in 384 wells plate by excitation wavelength 360 nm and emission wavelength 450 nm using a fluorescence plate reader (Molecular Devices). HDAC activity was normalized to total protein levels determined by Bradford assay.
Electrophysiology
Slice preparation
Photothrombotic stroke mice receiving suberoylanilide hydroxamic acid (SAHA) or vehicle through cannulae 4 to 10 days after stroke (once a day) were anesthetized by ethyl ether inhalation and decapitated at 11 days after stroke. Brains were quickly removed and placed into ice‐cold cutting solution containing 110 mmol/L choline chloride, 20 mmol/L glucose, 2.5 mmol/L KCl, 0.5 mmol/L CaCl2, 7 mmol/L MgCl2, 1.3 mmol/L NaH2PO4, 25 mmol/L NaHCO3, 1.3 mmol/L Na‐ascorbate, and 0.6 mmol/L Na‐pyruvate. Cortical slices (350 μm) were cut using a vibrating blade microtome (VT1200s, Leica) in the same solution and transferred to an interface‐style chamber containing normal artificial cerebrospinal fluid (ACSF) composed of 10 mmol/L glucose, 125 mmol/L NaCl, 2.5 mmol/L KCl, 2 mmol/L CaCl2, 1.3 mmol/L MgCl2, 1.3 mmol/L NaH2PO4, 25 mmol/L NaHCO3, 1.3 mmol/L Na‐ascorbate, and 0.6 mmol/L Na‐pyruvate. Slices were recovered at 34°C for at least 1 hour before recording. All solution was gassed with 95% O2 to 5% CO2. All drugs used in the electrophysiological experiments were purchased from Sigma or Tocris.
Miniature excitatory postsynaptic currents (mEPSCs) measurement
Whole cell recording from coronal slices of mice were made with patch pipettes containing 132.5 mmol/L Cs‐gluconate, 17.5 mmol/L CsCl, 2 mmol/L MgCl2, 0.5 mmol/L EGTA, 10 mmol/L HEPES, 4 mmol/L ATP, and 5 mmol/L QX‐314. To study mEPSC activity in isolation, tetrodotoxin (0.5 μmol/L) and bicuculline methiodide (20 μmol/L) were added to block action potentials and γ‐aminobutyric acid‐A receptor‐mediated currents, respectively. The recording was more than 5 minutes. Data were analyzed using Mini software. Up to 100 events from each cell were selected at a fixed sampling interval to generate cumulative probability. All data were from 5 animals for control, 8 animals for vehicle, and 8 animals for drug experiments. All experiments were performed in a blind fashion.
Statistical Analysis
All data are expressed as mean±SEM. Comparisons between 2 groups were made with a 2‐tailed Student t test. Behavioral data collected at repeating time points were analyzed using 2‐way repeated measures ANOVA, followed by Bonferroni post hoc test. Data for Western blot, ChIP, spine density, number of crossings, and frequency and amplitude of mEPSCs were analyzed using 1‐way ANOVA (1 factor) followed by Scheffe post hoc test. For cumulative comparisons including total dendritic length and total branch number, the Kolmogorov–Smirnov test was used. Statistical significance was set at P<0.05. The sample size was predetermined by analyzing pre‐experimental data with PASS (power analysis and sample size) software. For animal studies, the sample size was predetermined by our prior experiments.
Results
HDAC2 Upregulation Occurred in the Delayed Phase of Stroke
To examine whether stroke triggers delayed changes of histone deacetylase 2 (HDAC2) in the peri‐infarct zone adjacent to the infarct core, we produced a photothrombotic stroke to motor cortex in mice, in which ischemic infarct core and the peri‐infarct zone were well defined (Figure S2), and measured time course of HDAC2 expressions in the peri‐infarct cortex at 1, 3, 7, and 14 days after stroke. During 14 days after stroke, HDAC2 expression began to increase at 3 days, reached a peak at 7 days, and remained elevated at 14 days after stroke (Figure 1A). Consistent with HDAC2 expression after stroke, HDAC2 activity showed the same change trend after stroke (Figure 1B). Thus, HDAC2 in the peri‐infarct zone may be epigenetically implicated in neuroplasticity‐mediated functional recovery in the delayed phase after stroke.
Figure 1.
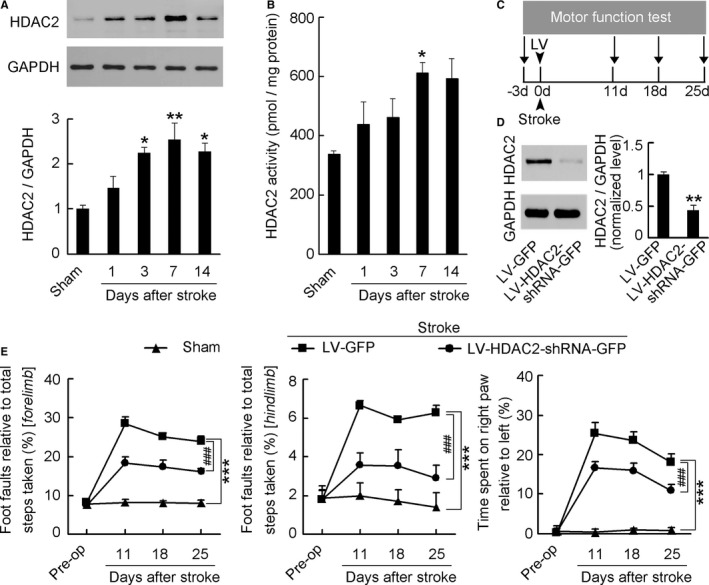
Time course of HDAC2 in the peri‐infarct cortex after stroke and effect of HDAC2 knockdown on motor recovery from stroke. A, Immunoblots showing the time course of HDAC2 levels in the peri‐infarct cortex after stroke (n=4 for each group per time point, 1‐way ANOVA, *P<0.05, **P<0.01, vs sham). B, Bar graph showing the time course of HDAC2 activity in the peri‐infarct cortex after stroke (n=6 for each group per time point, 1‐way ANOVA, *P<0.05, vs sham). C, Experimental design for (D and E). D, HDAC2 level in the peri‐infarct cortex at 7 days after LV‐HDAC2‐shRNA‐GFP or LV‐GFP infection (n=3 for each group, 2‐tailed t test, **P<0.01). E, Left: Foot faults of left forelimb in the grid‐walking task. Middle: Foot faults of left hindlimb in the grid‐walking task. Right: Forelimb symmetry in the cylinder task. (n=10, 13, and 13 for sham, LV‐GFP and LV‐HDAC2‐shRNA‐GFP, respectively, per time point, 2‐way ANOVA, ***P<0.001, vs sham; ### P<0.001, vs LV‐GFP). HDAC2 indicates histone deacetylase 2; GFP, green fluorescent protein; LV, lentivirus; shRNA, short hairpin RNA.
HDAC2 Plays a Role in Controlling Functional Recovery From Stroke
To test this, we generated a lentiviral vector containing shRNA of HDAC2, and named it LV‐HDAC2‐shRNA‐GFP. We infused it into the peri‐infarct cortex of mice immediately after stroke and detected motor function at 11, 18, and 25 days after stroke (Figure 1C). LV‐HDAC2‐shRNA‐GFP effectively infected the peri‐infarct cortex (Figure S3), significantly decreased HDAC2 level at 7 days after infection (Figure 1D), and substantially ameliorated stroke‐induced functional impairment during 11 to 25 days after stroke, compared with its control LV‐GFP (Figure 1E; Table S1). Moreover, we generated an adenovirus vector selectively expressing HDAC2 (Ad‐HDAC2‐Flag) and its control expressing inactive HDAC2 (Ad‐inactive‐HDAC2‐Flag), and infused them into the peri‐infarct cortex of mice immediately after stroke and detected motor function at 11, 18, and 25 days after stroke (Figure 2A). Ad‐HDAC2‐Flag effectively infected the peri‐infarct tissue (Figure 2B), substantially increased HDAC2 level at 7 days after infection (Figure 2C), and worsened the stroke‐induced functional impairment 11 to 25 days after stroke, compared with Ad‐inactive‐HDAC2‐Flag (Figure 2D; Table S2). Collectively, our findings demonstrate that HDAC2 is a crucial target negatively controlling behavioral recovery from stroke.
Figure 2.
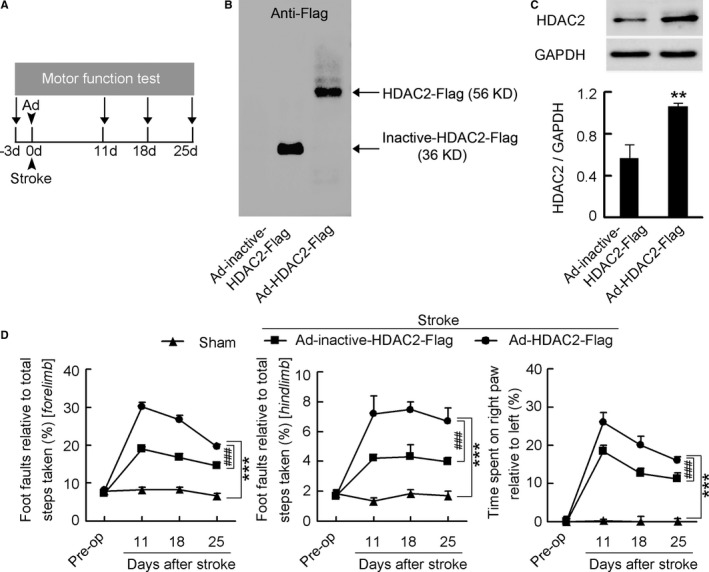
HDAC2 overexpression worsened functional impairment after stroke. A, Experimental design for (B through D). B, Representative gel showing inactive‐HDAC2‐Flag and HDAC2‐Flag expression in the peri‐infarct cortex of mice at 7 days after Ad‐inactive‐HDAC2‐Flag or Ad‐HDAC2‐Flag infection. C, HDAC2 levels in the peri‐infarct cortex at 7 days after Ad‐inactive‐HDAC2‐Flag or Ad‐HDAC2‐Flag infection (n=4 for each group, 1‐way ANOVA, **P<0.01). D, Left: Foot faults of left forelimb in the grid‐walking task. Middle: Foot faults of left hindlimb in the grid‐walking task. Right: Forelimb symmetry in the cylinder task. (n=10, 13, and 13 for sham, Ad‐inactive‐HDAC2‐Flag, and Ad‐HDAC2‐Flag, respectively, per time point, 2‐way ANOVA, ***P<0.001, vs sham; ### P<0.001, vs Ad‐inactive‐HDAC2‐Flag). Ad indicates adenovirus; HDAC2, histone deacetylase 2.
HDAC2 Is a Unique Target for Functional Recovery From Stroke
To further confirm the role of HDAC2 on stroke recovery and determine whether other HDACs participate in stroke recovery, we generated Hdac2 conditional knockout (Hdac2 CKO) mice, in which Hdac2 was deleted in all major cell types of the nervous system, by crossing HDAC2flox/flox mice with Nestin‐Cre transgenic mice.22 Immunostaining for HDAC2 in cortical sections of HDAC2flox/flox showed a high level of HDAC2 expression in the cortex and coexpression of HDAC2 with NeuN. In contrast, HDAC2 expression was largely absent in Hdac2 CKO mice (Figure 3A). This was further confirmed by Western blotting of HDAC2 expression in the cortical tissue (Figure S4). We then infused trichostatin A, a pan‐HDAC inhibitor, into the peri‐infarct cortex of conscious Hdac2 CKO mice and WT littermates 4 to 10 days after stroke, and tested motor function at 11, 18, and 25 days after stroke. Compared with vehicle, acetyl‐H4 level in the peri‐infarct cortex of WT mice was increased after trichostatin A treatment (Figure 3B). Compared with that found in WT mice, Hdac2 CKO mice displayed a significantly decreased number of foot faults and improved forelimb symmetry, suggesting that conditional knockout of Hdac2 promotes motor functional recovery from stroke. Although HDAC2 has been shown to mediate oxidative stress and induce cell death after brain ischemia, implying neuroprotective effect of HDAC2 deletion,23, 24 no difference in infarct volume was observed between WT and Hdac2 CKO mice (1.25±0.05 mm3 versus 1.21±0.12 mm3, n=8 for each group, P=0.75). Here we found that the embryonic deletion of HDAC2 led to a compensatory upregulation of HDAC3 (Figure S5), an isoform leading to cell death after stroke.25 A possible neuroprotective effect of HDAC2 deletion may be counteracted by the upregulation of HDAC3. Importantly, treatment with trichostatin A was ineffective in Hdac2 CKO mice, although the drug significantly ameliorated stroke‐induced functional impairment in WT littermates (Figure 3C; Tables S3 and S4), indicating the unique significance of HDAC2 in delayed stroke functional loss.
Figure 3.
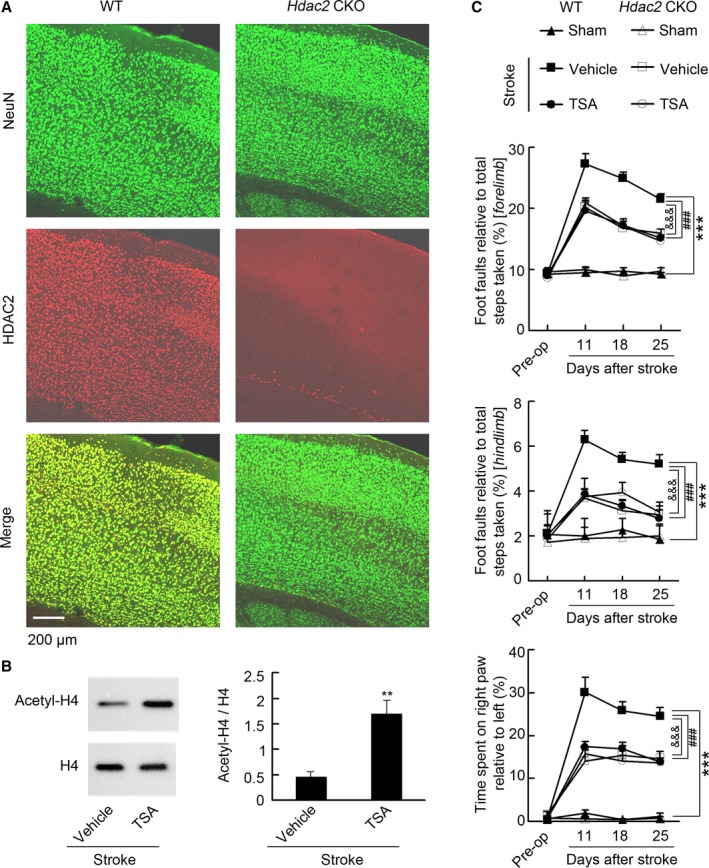
HDAC2 is a unique target that negatively regulates stroke recovery. A, Representative immunofluorescence showing that HDAC2 was deleted in the cortex in HDAC2flox/flox‐Nestin‐Cre mice. B, Representative immunoblots and bar graph showing that TSA significantly increased acetyl‐H4 level in the peri‐infarct cortex. TSA (0.5 μmol/L) or vehicle was microinjected into the peri‐infarct cortex during 4 to 10 days (2 μL/d) and immunoblots were performed at 11 d after stroke. (n=4 for each group, 2‐tailed t test, **P<0.01.) C, Top: Foot faults of left forelimb in the grid‐walking task. Middle: Foot faults of left hindlimb in the grid‐walking task. Bottom: Forelimb symmetry in the cylinder task. (n=7 for each group per time point, 2‐way ANOVA, ***P<0.001, WT: vehicle vs WT: sham; ### P<0.001, WT: TSA vs WT: vehicle; &&& P<0.001, Hdac2 CKO: vehicle vs WT: vehicle). Hdac2 CKO indicates Hdac2 conditional knockout; HDAC2, histone deacetylase 2; TSA, trichostatin A; WT, wild type.
Delayed SAHA Treatment Facilitates Stroke Recovery
Because of the absence of HDAC2‐specific inhibitor, we investigated whether SAHA, an inhibitor of HDAC1 and HDAC2, which has been approved by the US Food and Drug Administration to treat cutaneous T‐cell lymphoma,13, 26, 27 promotes recovery of motor function in the delayed phase after stroke. We infused SAHA into the peri‐infarct cortex of conscious mice during 4 to 10 days via an implanted microcannula (Figure 4A) and detected motor function by measuring the number of foot faults in the grid‐walking task and forelimb symmetry in the cylinder task at 11, 18, and 25 days after stroke (Figure 4B). SAHA treatment significantly increased acetyl‐H4 level in the peri‐infarct cortex, compared with vehicle (Figure 4C). Mice subjected to photothrombotic stroke in motor cortex showed a marked impairment of motor function and SAHA‐treated mice displayed significantly better motor function than vehicle‐treated mice did during 11 to 25 days after stroke (Figure 4D; Table S5), indicating a sustained functional recovery.
Figure 4.
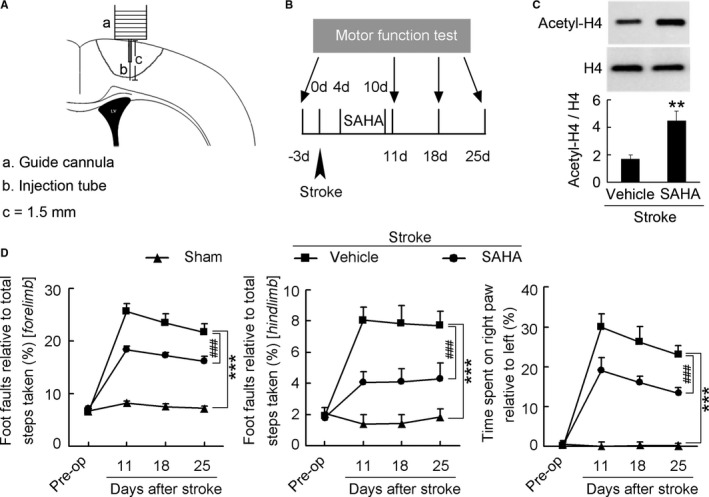
Delayed SAHA treatment promotes functional recovery from stroke. A, Diagram showing the microinjection of SAHA via an implanted microcannula into the peri‐infarct cortex of conscious mice. B, Diagram showing the design of the experiment (C and D). SAHA was microinjected into the peri‐infarct cortex of mice during 4 to 10 d after stroke. C, Immunoblots showing that SAHA significantly increased acetyl‐H4 level in the peri‐infarct cortex. SAHA (10 μmol/L) or vehicle was microinjected into the peri‐infarct cortex during 4 to 10 d (2 μL/d) and immunoblots were performed at 11 d after stroke. (n=4 for each group, 1‐way ANOVA, **P<0.01). D, Left: Foot faults of left forelimb in the grid‐walking task. Middle: Foot faults of left hindlimb in the grid‐walking task. Right: Forelimb symmetry in the cylinder task. (n=10, 13, and 13 for sham, vehicle, and SAHA, respectively, per time point, 2‐way ANOVA, ***P<0.001, vs sham; ### P<0.001, vs vehicle). SAHA indicates suberoylanilide hydroxamic acid.
Delayed SAHA Treatment Does Not Affect Infarct Size
Although a variety of HDAC inhibitors, including pan‐ and class‐specific inhibitors, decreased infarct size when used before, immediately after, or within hours after stroke,6, 14 no significant difference in infarct size was observed between mice treated with vehicle and SAHA during 4 to 10 days after stroke (0.83±0.08 mm3 versus 0.81±0.12 mm3, P=0.89, Figure S6).
HDAC2 Intervention Epigenetically Influences Neuroplasticity‐Related Gene Expression
Neuronal plasticity can lead to the remapping of function from damaged areas to peri‐infarct surviving tissue.5 HDAC2 has been shown to negatively regulate neuronal plasticity via epigenetically suppressing neuroplasticity‐associated genes expression.12 Accordingly, we performed ChIP to investigate whether SAHA promoted stroke recovery via epigenetic mechanisms. SAHA markedly reversed stroke‐induced decrease in promoter region acetylation of neural‐activity‐regulated genes including Bdnf‐p1, Bdnf‐p4, Egr‐1, Fos, and Arc, synaptic formation genes including Psd95, and Synapsin2, and synaptic plasticity genes including CaMK2a, Creb, and Cdk5, in the peri‐infarct cortex (Figure 5A and 5B). Moreover, we detected proteins critical for neuroplasticity, including PSD‐95, synapsin, and spinophilin, and found that SAHA significantly reversed stroke‐induced downregulation of PSD‐95, synapsin, and spinophilin (Figure 5C). To specifically assess the effect of HDAC2 intervention on neuroplasticity‐related proteins, peri‐infarct tissues were transfected with LV‐HDAC2‐shRNA‐GFP or Ad‐HDAC2‐Flag, and Western blotting was performed at 11 days after stroke. We found that HDAC2 knockdown reversed stroke‐induced downregulation of synapsin and spinophilin, whereas HDAC2 overexpression further augmented stroke‐induced downregulation of synapsin and spinophilin (Figure S7). Taken together, these findings suggest that inhibition of HDAC2 following stroke results in the chromatin being loose, thereby increasing histone acetylation‐mediated neuroplasticity at the level of gene expression.
Figure 5.
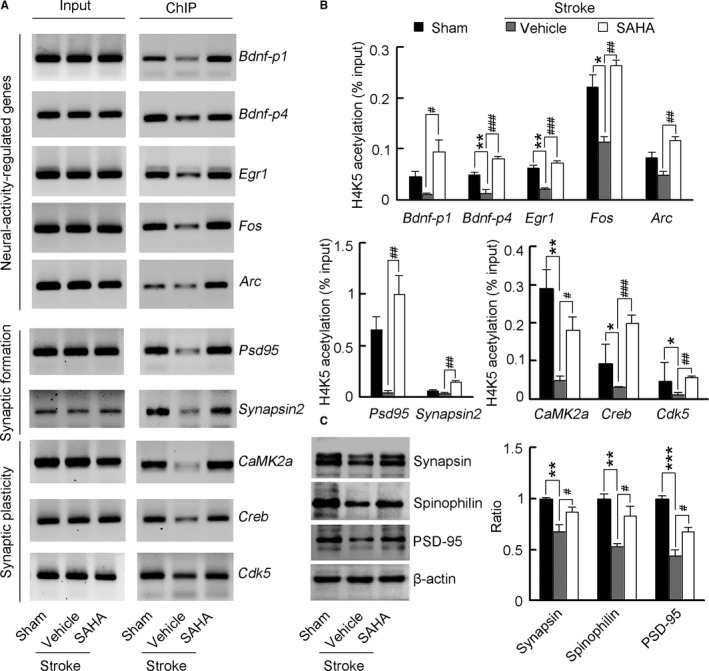
SAHA primes a transcriptional program for increased neuroplasticity. A, Images of electrophoretic gels showing semiquantitative PCR results from ChIP of samples according to the real‐time PCR signal (n=4 for each group). B, Bar graph showing changes in histone acetylation in neuroplasticity‐related genes promoter regions in the peri‐infarct tissue. Fragmented chromatin was immunoprecipitated with antibody recognizing acetyl‐H4 and quantified with real‐time PCR. SAHA (10 μmol/L) or vehicle was microinjected into the peri‐infarct cortex 4 to 10 d (2 μL/d) after stroke and ChIP experiments were performed at 11 d after stroke (n=4 for each group, 1‐way ANOVA, *P<0.05, **P<0.01, vs sham; # P<0.05, ## P<0.01, ### P<0.001, vs vehicle). C, Immunoblots showing levels of neuroplasticity‐related proteins in the peri‐infarct cortex. SAHA (10 μmol/L) or vehicle was microinjected into the peri‐infarct cortex 4 to 10 d (2 μL/d) after stroke and Western blots were performed at 11 d after stroke. For synapsin, n=5, 5, and 4 for sham, vehicle, and SAHA respectively; for spinophilin, n=4 for each group; For PSD‐95, n=3 for each group; 1‐way ANOVA, **P<0.01, ***P<0.001, vs sham; # P<0.05, vs vehicle. ChIP indicates chromatin immunoprecipitation; PCR, polymerase chain reaction; PSD‐95, postsynaptic density protein‐95; SAHA, suberoylanilide hydroxamic acid.
SAHA Enhances Structural Neuroplasticity
Next, we tested whether delayed administration of SAHA after stroke leads to enhancement of structural neuroplasticity in the peri‐infarct cortex. SAHA (10 μmol/L) or vehicle was microinjected into the peri‐infarct cortex 4 to 10 days (2 μL/d) after stroke, and Golgi‐Cox staining was performed at 11 days after stroke. Stroke caused substantial decreases in dendritic spine density, suggesting a spine loss. Treatment with SAHA during 4 to 10 days after stroke reversed the stroke‐induced spine loss (Figure 6A and 6B). Stroke also caused a significant reduction of dendritic length and branchings (Figure 6C), and SAHA significantly increased dendritic complexity compared with vehicle (Figure 6D). Collectively, these results indicate that SAHA promotes structural neuroplasticity accompanied by epigenetically increased neuroplasticity‐related gene expression after stroke.
Figure 6.
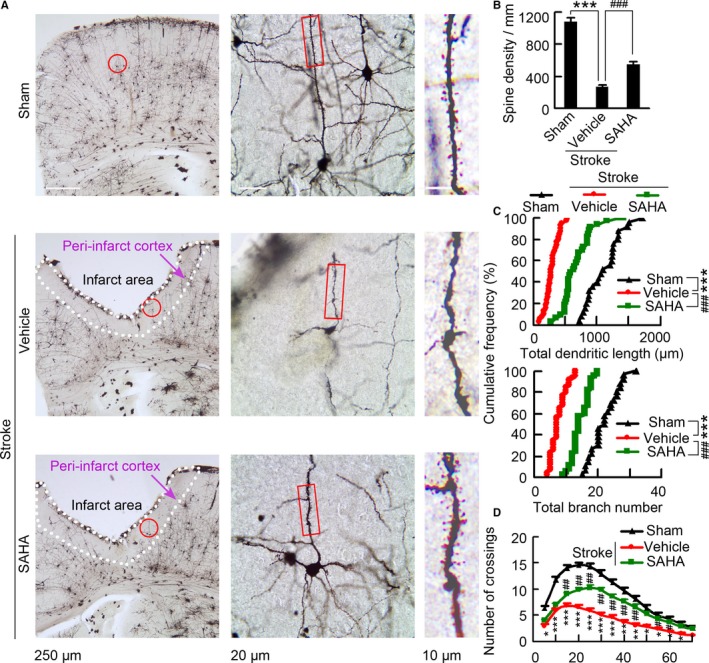
SAHA treatment leads to increases in spine density and dendritic complexity. A, Representative images with Golgi‐Cox staining showing neurons in the peri‐infarct cortex at 11 d after stroke. The middle is a high magnified image from a selected area in the left. The right is a high magnified image from a selected area in middle. B, Bar graph showing spine density in the peri‐infarct cortex at 11 d after stroke (n=6, 8, and 7 for sham, vehicle, and SAHA, respectively, 10 neurons per sample, 1‐way ANOVA, ***P<0.001, vs sham; ### P<0.001, vs vehicle). C, Quantification of total dendritic length and branch number of neurons in the peri‐infarct cortex at 11 d after stroke. Each symbol represents data from sham, vehicle, or SAHA. Symbols on the X axis represent mean values (n=4, 6, and 6 for sham, vehicle, and SAHA, respectively, 10 neurons per sample, Kolmogorov–Smirnov test, ***P<0.001, vs sham; ### P<0.001, vs vehicle). D, Sholl analysis of dendritic complexity of Golgi‐stained neurons in the peri‐infarct cortex at 11 d after stroke (n=4, 6, and 6 for sham, vehicle, and SAHA, respectively, 10 neurons per sample, 1‐way ANOVA, *P<0.05, **P<0.01, ***P<0.001, vehicle vs sham; # P<0.05, ## P<0.01, SAHA vs vehicle). SAHA indicates suberoylanilide hydroxamic acid.
SAHA Leads to Increase in Synaptic Transmission
Dendritic spines are the postsynaptic sites of excitatory synapses.28 To further ascertain whether structural plasticity might also be accompanied by increased functional plasticity, we performed whole‐cell voltage clamp recordings to assess mEPSCs in peri‐infarct pyramidal neurons in acute brain slices derived from poststroke mice and pyramidal neurons from the same site of sham‐operated mice (Figure 7A). Treatment with SAHA during 4 to 10 days after stroke reversed the stroke‐induced mEPSC frequency decrease (Figure 7B and 7C); however, no significant difference in amplitude was observed between groups (Figure 7B and 7D), in line with the observation that SAHA treatment increases the number of dendritic spines of surviving neurons in the peri‐infarct cortex (Figure 6A and 6B). Taken together, in addition to epigenetically enhanced neuroplasticity‐related gene expression, SAHA treatment also led to increased structural plasticity and synaptic transmission in the peri‐infarct area, which accounts for the mechanisms underlying SAHA‐induced functional recovery from stroke.
Figure 7.
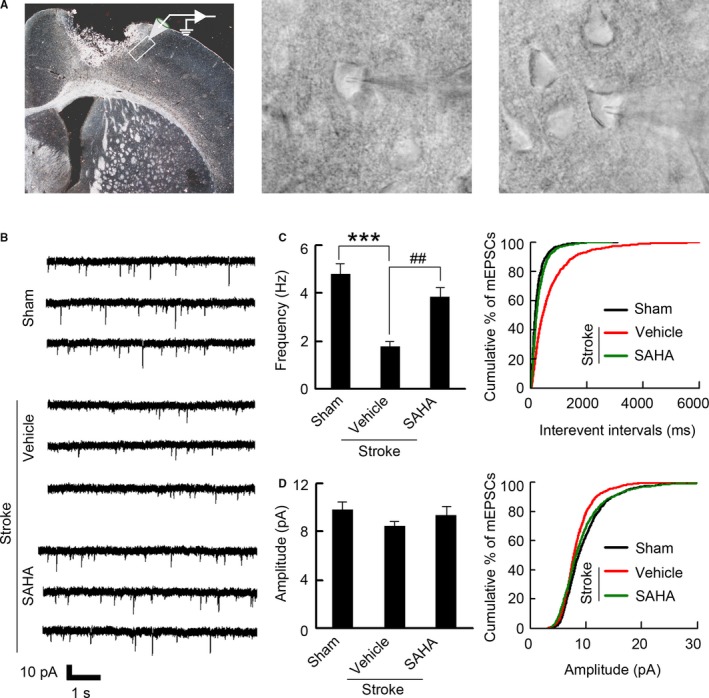
SAHA treatment results in increased frequency of mEPSCs. A, Left: Image showing the peri‐infarct recording site. Whole‐cell patch‐clamp recordings were made from poststroke brain slices, within 200 μm of the infarct (image under ×5 magnification). Middle: Representative image showing patch‐clamp from peri‐infarct pyramidal neuron (images under ×40 magnification). Right: Representative image showing control recording from pyramidal neuron at the same location as peri‐infarct area (images under ×40 magnification). B, Representative recordings of mEPSCs from the neurons in the peri‐infarct cortex. C, Bar graph and cumulative distribution plots showing mEPSCs frequency (n=14 for each group, from 5 to 8 animals per group, 1‐way ANOVA, ***P<0.001, vs sham; ## P<0.01, vs vehicle). D, Bar graph and cumulative distribution plots showing mEPSCs amplitude (n=14 for each group, from 5 to 8 animals per group, 1‐way ANOVA, P=0.578). mEPSCs indicates miniature excitatory postsynaptic currents; SAHA, suberoylanilide hydroxamic acid.
Discussion
Stroke is a leading cause of disability. To date, no pharmacological therapy promoting functional recovery from stroke is clinically available. The current study demonstrates that administration of SAHA in the delayed phase after stroke leads to sustained functional recovery. Interestingly, among class I HDACs, HDAC2 could be a crucial target, not only because HDAC2 loss of function facilitated functional recovery, whereas overexpression of HDAC2 impaired functional recovery, but also because the effect of pan‐HDAC inhibitor trichostatin A on functional recovery disappeared in Hdac2 CKO mice.
Functional recovery after stroke is currently attributed to both brain remodeling and neuroplasticity.5, 9 Structural neuroplasticity may result from axonal sprouting, neurogenesis, or remodeling of dendritic arbors.20, 29, 30 Here we showed that delayed administration of SAHA reversed stroke‐induced decreases in promoter acetylation of a key set of neuroplasticity‐related genes, and upregulated neuroplasticity‐related proteins, suggesting an increased molecular neuroplasticity. Furthermore, SAHA treatment reversed the stroke‐induced spine loss, and increased dendritic complexity, indicating an enhanced structural neuroplasticity. On a functional level, we found that SAHA treatment rescued stroke‐induced decrease in frequency of mEPSCs. These findings suggest that SAHA is a poststroke neuroplasticity‐promoting drug that facilitates functional recovery.
Many of the genes and proteins that are important for early brain development show a limited period of changed expression following stroke.5 It has been known that HDACs manipulate a vast variety of nuclear processes involved in neuronal plasticity.12 We found that stroke upregulated HDAC2 level during 3 to 14 days in the peri‐infarct cortex after stroke. More importantly, delayed treatment with pan‐HDAC inhibitor produced substantial functional recovery in WT mice, but was ineffective in Hdac2 CKO mice. Thus, HDAC2 may epigenetically control the delayed period of neuroplasticity‐mediated functional recovery after stroke.
Specific pattern of distribution among cells and subcellular locations, and specific regulation of target genes may explain the unique role of HDAC2 in stroke recovery. Class I HDACs are generally restricted to the nucleus where they impose transcriptional control.14 In the ischemic penumbra, HDAC1 is prominently expressed in proximal axons and dendrites of neurons and in astrocyte nuclei, whereas HDAC2 is confined to the neuron nuclei, and displays an extensive presence in nuclei, cell body, and end‐feet in astrocytes.31 HDAC1 and HDAC2 often affect different sets of target genes in brains.32 It has been reported that neuron‐specific overexpression of HDAC2, but not HDAC1, decreased dendritic spine density, synapse number, synaptic plasticity, and memory formation.26 Moreover, expressions of HDACs are clearly different among neuronal groups.33
Collectively, our data show that HDAC2 is a crucial target for functional recovery from stroke. In the delayed phase after stroke, administration of SAHA promoted functional recovery via epigenetically increased neuroplasticity‐related genes expression leading to circuit reorganization in the peri‐infarct area (Figure 8). Because there are clinically available HDAC inhibitors, our findings could be directly translated into clinical research on stroke. Moreover, because of the important significance of HDAC2, developing HDAC2‐specific inhibitors may open a new avenue in stroke recovery.
Figure 8.
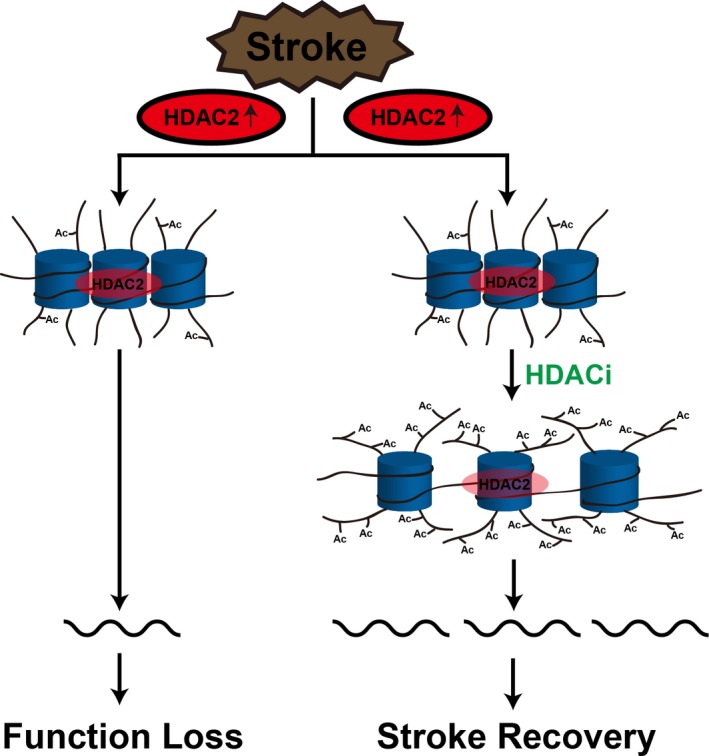
Schematic summary. HDACis epigenetically prime the expression of neuroplasticity‐related genes to rescue the decreased peri‐infarct cortex neuroplasticity and thereby promote functional recovery after stroke. HDAC2 indicates histone deacetylase 2; HDACis, histone deacetylase inhibitors.
Sources of Funding
This work was supported by grants from National Natural Science Foundation of China (91232304, 31530091, 81571188, and 81222016), the National Basic Research Program of China (973 Program) (2011CB504404) and the Natural Science Foundation of Jiangsu Province (BK2011029) and Distinguished Young Scientists Fund (BK20130040) and the Collaborative Innovation Center for Cardiovascular Disease Translational Medicine.
Disclosures
None.
Supporting information
Table S1. Behavioral Assessment of HDAC2 Knockdown on Functional Recovery From Stroke
Table S2. Behavioral Assessment of HDAC2 Overexpression on Functional Recovery From Stroke
Table S3. Behavioral Assessment of TSA on Functional Recovery From Stroke in WT Mice
Table S4. Behavioral Assessment of TSA on Functional Recovery From Stroke in Hdac2 CKO Mice
Table S5. Behavioral Assessment of SAHA on Functional Recovery From Stroke
Figure S1. Scatterplot for correlation between neuroscore and lesion size after stroke.
Figure S2. Diagram and immunostaining showing peri‐infarct cortex.
Figure S3. Confirmation of LV‐HDAC2‐shRNA‐GFP infection.
Figure S4. Elimination of HDAC2 protein expression in the cortex is demonstrated by Western analysis.
Figure S5. Hdac2 CKO leads to compensatory upregulation of HDAC3.
Figure S6. Administration of SAHA during 4 to 10 d after stroke has no effect on infarct size.
Figure S7. HDAC2 knockdown reversed, whereas HDAC2 overexpression further augmented stroke‐induced downregulation of neuroplasticity‐related proteins.
(J Am Heart Assoc. 2017;6:e007236 DOI: 10.1161/JAHA.117.007236.)
Contributor Information
Chun‐Xia Luo, Email: chunxialuo@njmu.edu.cn.
Dong‐Ya Zhu, Email: dyzhu@njmu.edu.cn.
References
- 1. Mendis S, Davis S, Norrving B. Organizational update: the World Health Organization global status report on noncommunicable diseases 2014; one more landmark step in the combat against stroke and vascular disease. Stroke. 2015;46:e121–e122. [DOI] [PubMed] [Google Scholar]
- 2. Lang CE, Lohse KR, Birkenmeier RL. Dose and timing in neurorehabilitation: prescribing motor therapy after stroke. Curr Opin Neurol. 2015;28:549–555. [DOI] [PMC free article] [PubMed] [Google Scholar]
- 3. Carmichael ST. Themes and strategies for studying the biology of stroke recovery in the poststroke epoch. Stroke. 2008;39:1380–1388. [DOI] [PMC free article] [PubMed] [Google Scholar]
- 4. Ueno Y, Chopp M, Zhang L, Buller B, Liu Z, Lehman NL, Liu XS, Zhang Y, Roberts C, Zhang ZG. Axonal outgrowth and dendritic plasticity in the cortical peri‐infarct area after experimental stroke. Stroke. 2012;43:2221–2228. [DOI] [PMC free article] [PubMed] [Google Scholar]
- 5. Murphy TH, Corbett D. Plasticity during stroke recovery: from synapse to behaviour. Nat Rev Neurosci. 2009;10:861–872. [DOI] [PubMed] [Google Scholar]
- 6. Langley B, Brochier C, Rivieccio MA. Targeting histone deacetylases as a multifaceted approach to treat the diverse outcomes of stroke. Stroke. 2009;40:2899–2905. [DOI] [PubMed] [Google Scholar]
- 7. Zhou L, Li F, Xu HB, Luo CX, Wu HY, Zhu MM, Lu W, Ji X, Zhou QG, Zhu DY. Treatment of cerebral ischemia by disrupting ischemia‐induced interaction of nNOS with PSD‐95. Nat Med. 2010;16:1439–1443. [DOI] [PubMed] [Google Scholar]
- 8. Sigler A, Mohajerani MH, Murphy TH. Imaging rapid redistribution of sensory‐evoked depolarization through existing cortical pathways after targeted stroke in mice. Proc Natl Acad Sci USA. 2009;106:11759–11764. [DOI] [PMC free article] [PubMed] [Google Scholar]
- 9. Clarkson AN, Huang BS, Macisaac SE, Mody I, Carmichael ST. Reducing excessive GABA‐mediated tonic inhibition promotes functional recovery after stroke. Nature. 2010;468:305–309. [DOI] [PMC free article] [PubMed] [Google Scholar]
- 10. Staley K. Stroke: recovery inhibitors under attack. Nature. 2010;468:176–177. [DOI] [PubMed] [Google Scholar]
- 11. Robert T, Vanoli F, Chiolo I, Shubassi G, Bernstein KA, Rothstein R, Botrugno OA, Parazzoli D, Oldani A, Minucci S, Foiani M. HDACs link the DNA damage response, processing of double‐strand breaks and autophagy. Nature. 2011;471:74–79. [DOI] [PMC free article] [PubMed] [Google Scholar]
- 12. Gräff J, Joseph NF, Horn ME, Samiei A, Meng J, Seo J, Rei D, Bero AW, Phan TX, Wagner F, Holson E, Xu J, Sun J, Neve RL, Mach RH, Haggarty SJ, Tsai LH. Epigenetic priming of memory updating during reconsolidation to attenuate remote fear memories. Cell. 2014;156:261–276. [DOI] [PMC free article] [PubMed] [Google Scholar]
- 13. Haberland M, Montgomery RL, Olson EN. The many roles of histone deacetylases in development and physiology: implications for disease and therapy. Nat Rev Genet. 2009;10:32–42. [DOI] [PMC free article] [PubMed] [Google Scholar]
- 14. Aune SE, Herr DJ, Kutz CJ, Menick DR. Histone deacetylases exert class‐specific roles in conditioning the brain and heart against acute ischemic injury. Front Neurol. 2015;6:145. [DOI] [PMC free article] [PubMed] [Google Scholar]
- 15. Kassis H, Shehadah A, Li C, Zhang Y, Cui Y, Roberts C, Sadry N, Liu X, Chopp M, Zhang ZG. Class IIa histone deacetylases affect neuronal remodeling and functional outcome after stroke. Neurochem Int. 2016;96:24–31. [DOI] [PMC free article] [PubMed] [Google Scholar]
- 16. Jin H, Zhu S, Wei JW, Wang J, Liu M, Wu Y, Wong LK, Cheng Y, Xu E, Yang Q, Anderson CS, Huang Y; ChinaQUEST (Quality Evaluation of Stroke Care and Treatment) Investigators . Factors associated with prehospital delays in the presentation of acute stroke in urban China. Stroke. 2012;43:362–370. [DOI] [PubMed] [Google Scholar]
- 17. Ding J, Zhao Z, Wang C, Wang CX, Li PC, Qian C, Teng GJ. Bioluminescence imaging of transplanted human endothelial colony‐forming cells in an ischemic mouse model. Brain Res. 2016;1642:209–218. [DOI] [PubMed] [Google Scholar]
- 18. Baskin YK, Dietrich WD, Green EJ. Two effective behavioral tasks for evaluating sensorimotor dysfunction following traumatic brain injury in mice. J Neurosci Methods. 2003;129:87–93. [DOI] [PubMed] [Google Scholar]
- 19. Zhu LJ, Li TY, Luo CX, Jiang N, Chang L, Lin YH, Zhou HH, Chen C, Zhang Y, Lu W, Gao LY, Ma Y, Zhou QG, Hu Q, Hu XL, Zhang J, Wu HY, Zhu DY. CAPON‐nNOS coupling can serve as a target for developing new anxiolytics. Nat Med. 2014;20:1050–1054. [DOI] [PubMed] [Google Scholar]
- 20. Luo CX, Lin YH, Qian XD, Tang Y, Zhou HH, Jin X, Ni HY, Zhang FY, Qin C, Li F, Zhang Y, Wu HY, Chang L, Zhu DY. Interaction of nNOS with PSD‐95 negatively controls regenerative repair after stroke. J Neurosci. 2014;34:13535–13548. [DOI] [PMC free article] [PubMed] [Google Scholar]
- 21. Nott A, Watson PM, Robinson JD, Crepaldi L, Riccio A. S‐Nitrosylation of histone deacetylase 2 induces chromatin remodelling in neurons. Nature. 2008;455:411–415. [DOI] [PubMed] [Google Scholar]
- 22. Tronche F, Kellendonk C, Kretz O, Gass P, Anlag K, Orban PC, Bock R, Klein R, Schütz G. Disruption of the glucocorticoid receptor gene in the nervous system results in reduced anxiety. Nat Genet. 1999;23:99–103. [DOI] [PubMed] [Google Scholar]
- 23. Peng S, Zhao S, Yan F, Cheng J, Huang L, Chen H, Liu Q, Ji X, Yuan Z. HDAC2 selectively regulates FOXO3a‐mediated gene transcription during oxidative stress‐induced neuronal cell death. J Neurosci. 2015;35:1250–1259. [DOI] [PMC free article] [PubMed] [Google Scholar]
- 24. Formisano L, Guida N, Valsecchi V, Cantile M, Cuomo O, Vinciguerra A, Laudati G, Pignataro G, Sirabella R, Di Renzo G, Annunziato L. Sp3/REST/HDAC1/HDAC2 complex represses and Sp1/HIF‐1/p300 complex activates ncx1 gene transcription, in brain ischemia and in ischemic brain preconditioning, by epigenetic mechanism. J Neurosci. 2015;35:7332–7348. [DOI] [PMC free article] [PubMed] [Google Scholar]
- 25. Yang X, Wu Q, Zhang L, Feng L. Inhibition of histone deacetylase 3 (HDAC3) mediates ischemic preconditioning and protects cortical neurons against ischemia in rats. Front Mol Neurosci. 2016;9:131. [DOI] [PMC free article] [PubMed] [Google Scholar]
- 26. Guan JS, Haggarty SJ, Giacometti E, Dannenberg JH, Joseph N, Gao J, Nieland TJ, Zhou Y, Wang X, Mazitschek R, Bradner JE, DePinho RA, Jaenisch R, Tsai LH. HDAC2 negatively regulates memory formation and synaptic plasticity. Nature. 2009;459:55–60. [DOI] [PMC free article] [PubMed] [Google Scholar]
- 27. Krämer OH. HDAC2: a critical factor in health and disease. Trends Pharmacol Sci. 2009;30:647–655. [DOI] [PubMed] [Google Scholar]
- 28. Tran TS, Rubio ME, Clem RL, Johnson D, Case L, Tessier‐Lavigne M, Huganir RL, Ginty DD, Kolodkin AL. Secreted semaphorins control spine distribution and morphogenesis in the postnatal CNS. Nature. 2009;462:1065–1069. [DOI] [PMC free article] [PubMed] [Google Scholar]
- 29. Wahl AS, Omlor W, Rubio JC, Chen JL, Zheng H, Schröter A, Gullo M, Weinmann O, Kobayashi K, Helmchen F, Ommer B, Schwab ME. Asynchronous therapy restores motor control by rewiring of the rat corticospinal tract after stroke. Science. 2014;344:1250–1255. [DOI] [PubMed] [Google Scholar]
- 30. Zhou HH, Tang Y, Zhang XY, Luo CX, Gao LY, Wu HY, Chang L, Zhu DY. Delayed administration of Tat‐HA‐NR2B9c promotes recovery after stroke in rats. Stroke. 2015;46:1352–1358. [DOI] [PubMed] [Google Scholar]
- 31. Baltan S, Bachleda A, Morrison RS, Murphy SP. Expression of histone deacetylases in cellular compartments of the mouse brain and the effects of ischemia. Transl Stroke Res. 2011;2:411–423. [DOI] [PMC free article] [PubMed] [Google Scholar]
- 32. Montgomery RL, Hsieh J, Barbosa AC, Richardson JA, Olson EN. Histone deacetylases 1 and 2 control the progression of neural precursors to neurons during brain development. Proc Natl Acad Sci USA. 2009;106:7876–7881. [DOI] [PMC free article] [PubMed] [Google Scholar]
- 33. Takase K, Oda S, Kuroda M, Funato H. Monoaminergic and neuropeptidergic neurons have distinct expression profiles of histone deacetylases. PLoS One. 2013;8:e58473. [DOI] [PMC free article] [PubMed] [Google Scholar]
Associated Data
This section collects any data citations, data availability statements, or supplementary materials included in this article.
Supplementary Materials
Table S1. Behavioral Assessment of HDAC2 Knockdown on Functional Recovery From Stroke
Table S2. Behavioral Assessment of HDAC2 Overexpression on Functional Recovery From Stroke
Table S3. Behavioral Assessment of TSA on Functional Recovery From Stroke in WT Mice
Table S4. Behavioral Assessment of TSA on Functional Recovery From Stroke in Hdac2 CKO Mice
Table S5. Behavioral Assessment of SAHA on Functional Recovery From Stroke
Figure S1. Scatterplot for correlation between neuroscore and lesion size after stroke.
Figure S2. Diagram and immunostaining showing peri‐infarct cortex.
Figure S3. Confirmation of LV‐HDAC2‐shRNA‐GFP infection.
Figure S4. Elimination of HDAC2 protein expression in the cortex is demonstrated by Western analysis.
Figure S5. Hdac2 CKO leads to compensatory upregulation of HDAC3.
Figure S6. Administration of SAHA during 4 to 10 d after stroke has no effect on infarct size.
Figure S7. HDAC2 knockdown reversed, whereas HDAC2 overexpression further augmented stroke‐induced downregulation of neuroplasticity‐related proteins.