Abstract
Population studies of brain function with resting-state functional magnetic resonance imaging (rs-fMRI) largely rely on the accurate inter-subject registration of functional areas. This is typically achieved through registration of the corresponding T1-weighted MR images with more structural details. However, accumulating evidence has suggested that such strategy cannot well-align functional regions which are not necessarily confined by the anatomical boundaries defined by the T1-weighted MR images. To mitigate this problem, various registration algorithms based directly on rs-fMRI data have been developed, most of which have utilized functional connectivity (FC) as features for registration. However, most of the FC-based registration methods usually extract the functional features only from the thin and highly curved cortical grey matter (GM), posing a great challenge in accurately estimating the whole-brain deformation field. In this paper, we demonstrate that the additional useful functional features can be extracted from brain regions beyond the GM, particularly, white-matter (WM) based on rs-fMRI, for improving the overall functional registration. Specifically, we quantify the local anisotropic correlation patterns of the blood oxygenation level-dependent (BOLD) signals, modeled by functional correlation tensors (FCTs), in both GM and WM. Functional registration is then performed based on multiple components of the whole-brain FCTs using a multichannel Large Deformation Diffeomorphic Metric Mapping (mLDDMM) algorithm. Experimental results show that our proposed method achieves superior functional registration performance, compared with other conventional registration methods.
Keywords: Resting-state fMRI, Registration, LDDMM
1 Introduction
Resting-state functional magnetic resonance imaging (rs-fMRI) is an effective noninvasive brain functional imaging technique for characterizing spontaneous neural activities and their structured interactions [1]. Brain functional networks can further be constructed by measuring the temporal correlation of the blood oxygenation level-dependent (BOLD) signals among different brain regions. Then, the changes in the brain networks between healthy subjects and patients can be regarded as potential imaging biomarkers for various brain diseases [2]. Note that, in all these applications, it is important to have accurate inter-subject registration of rs-fMRI data for helping to improve both group comparison statistical power and the biomarker detection sensitivity.
Typically, rs-fMRI inter-subject registration is achieved through the alignment of their corresponding T1-weighted MR images since the latter have better structural details [3–5]. However, structural alignment does not necessarily ensure functional alignment, since functional regions are not always confined by anatomical boundaries [6]. In other words, even after reasonable structural alignment, the brain's functional regions may be still not well-aligned across subjects [7].
A few attempts have been made to directly employ fMRI data for the functional registration based on functional connectivity (FC) features. However, most existing FC-based registration methods often use just part of the functional features extracted from thin and highly-convoluted cortical grey matter (GM) for guiding the registration [6, 8]. This type of strategies has posed a great challenge in estimating accurate whole-brain deformation field that is essential for registration. For example, FC information from the GM was used to estimate cortical deformation field which is then interpolated to estimate the whole-brain deformation field [6]. This may cause large registration error in the deep-buried white matter (WM) structure and could, in turn, deteriorate the registration of the cortical GM. A more reasonable solution is to consider functional information not only on the cortical GM layers, but also on the sub-cortical WM tissue. In this way, more information can be utilized from the whole brain for estimating final deformation field; this should achieve better alignment of the functional regions. However, almost all previous studies ignored functional signals in WM, and thus their respective information is not used for functional registration.
Motivated by the feasibility of using fMRI to detect WM activations [9] and connectivities not only over a long distance [10] but also in a local range [11], we propose a novel functional registration algorithm by incorporating functional information in both GM and WM to guide the subsequent registration. There are at least three aspects of contribution in our proposed method. First, a robust method for calculating FC anisotropic information is developed with patch-based functional correlation tensors (PFCTs). Second, the PFCTs are calculated on both WM and GM to cover the entire brain for better whole-brain functional registration. Third, a multi-channel Large Deformation Diffeomorphic Metric Mapping algorithm (mLDDMM) [12] is employed for utilizing the complementary information contained by the multiple components (i.e., channels) of the PFCTs to guide more accurate functional registration.
2 Method
There are two major steps in our proposed functional registration method, as briefly summarized below and illustrated in Fig. 1.
Fig. 1.
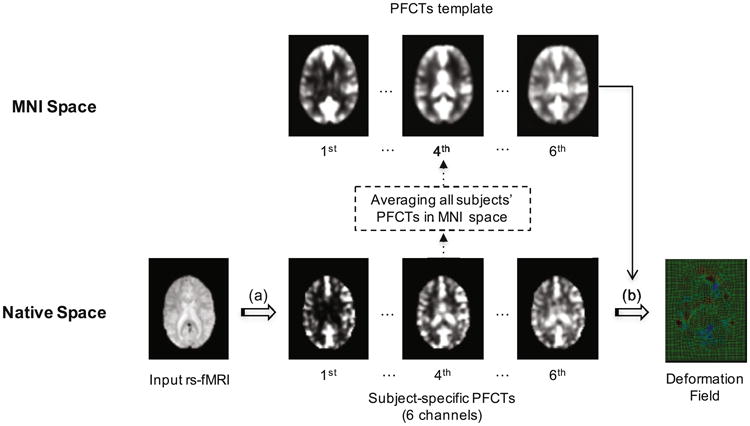
Overview of the proposed method: (a) PFCT construction, (b) mLDDMM registration.
2.1 Functional Correlation Tensors (FCTs)
FCTs are used to describe the directional biases of local FC pattern, which can provide more functional synchrony information across different subjects to help guide more accurate functional registration. Two steps of FCTs construction are described as follows:
Local FC pattern
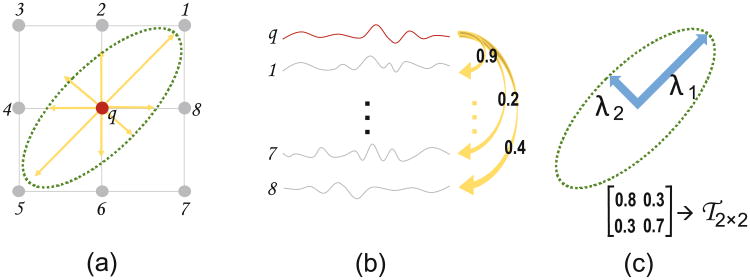
The FC between a center voxel and each of its neighboring voxels can vary, which create a non-uniform local FC pattern. Figure 2a shows an example, the local FCs from a voxel q to the eight neighboring voxels (1–8) are different from each other. We can define a directional vector pointing from q to each of its neighboring positions, e.g., position 1 (see the directed arrow from q to 1 in Fig. 2a). The length of this directional vector can be defined as the FC strength between voxels q and 1, by measuring the Pearson's correlation between the corresponding rs-fMRI BOLD signal (Fig. 2b). In above manner, we can calculate pair-wise FCs between the rs-fMRI signal in voxel q and those in its eight neighboring voxels one by one (Fig. 2b), with the highly correlated rs-fMRI time series corresponding to longer directional vectors, and vice versa. In this way, as shown in Fig. 2a, eight directional vectors may have their respective lengths, which could generate a specific local FC pattern.
Fig. 2.
An example of 2D FCT: (a) directional vectors pointing from voxel q to its 8 neighbors 1–8; (b) time series corresponding to the BOLD signals from voxels in (a), where numbers on yellow arrows denote the respective correlation coefficients; (c) FCT modeled by a 2D tensor.
Local FC pattern modeled by tensors
To model such a pattern, a tensor can be adopted, in a 2-by-2 covariance matrix, i.e.,τ2×2, with three free parameters due to the symmetry of matrix (Fig. 2c). The shape of this tensor can be further modeled by the two major axes λ1 and λ2. Note that, for easy understanding, we use this 2D example of the tensor, which is specifically called as functional correlation tensor (FCT) in this paper. For real fMRI data, the neighboring voxels are modeled by a 3D tensor, i.e., τ3×3.
The structured BOLD signal correlations exist in WM and follow the main direction of the fiber bundles, which are the foundation of using FCT to characterize the underlying functional organization patterns in WM. However, the biological mechanism of WM-fMRI signals is under investigation. The most promising hypothesis is as follows: the supportive micro blood vasculature and capillary vessels in WM follow the main direction of the fiber bundles due to the space constraint. Other supportive cells such as astrocytes could also be spatially confined by the main direction of the fibers and require blood oxygen. BOLD signal from fMRI has close relationship with the blood flow/volume/oxygen. Therefore, WM could have structured BOLD signal correlations.
2.2 PFCTs Construction
In real applications, rs-fMRI can be noisy. Various imaging noise and physiological artifacts may pose a great problem during pair-wise FC calculation. This will, in turn, affect following FCT estimation and result in noisy FCT maps. Using such noise contaminated FCTs as the functional features for registration could be problematic and lead to suboptimum inter-subject alignment.
In order to improve the signal-to-noise ratio (SNR) in FCT calculation, we construct PFCTs, in a patch-based manner, to capture the inherent local FC anisotropic patterns in the whole brain for each subject. In this method, rather than using single voxel's rs-fMRI signal to conduct pair-wise FC, a 3D patch containing multiple voxels is used to conduct FC analysis to its neighboring 3D patch to generate a robust FC value. Specially, the patch-based FC is calculated by averaging all FC values across the voxel pairs consisting of corresponding voxels of two patches (e.g., the upper left corner voxel in patch A with other upper left corner voxel in the neighboring patch B). In this way, FCTs can be more robustly estimated. We call this method patch-based FCT (PFCT).
Figure 3 shows an example of the PFCT-based “FA”, “MD” and three axial diffusivity maps based on a randomly selected subject's real rs-fMRI data. It can be observed that, PFCTs on WM tend to be anisotropic with small magnitudes, while PFCTs on GM tend to be isotropic with large magnitudes. Specifically, as shown by the “FA” map, most WM structures have greater anisotropic PFCTs; while in the “MD” map, GM has generally larger mean “diffusivity”. These results suggest that the PFCTs provide both magnitude and directional information of the local FC, characterizing complementary and biological meaningful functional information in GM and WM.
Fig. 3.

An example of PFCT-derived metric maps based on the real rs-fMRI data of a randomly selected subject. FA: fractional anisotropy; MD: mean diffusivity; λ1–3: three eigenvalue maps.
Of note, instead of using spatial smoothing in the rs-fMRI preprocessing, we use PFCTs to obtain good functional features while preventing from excessively blurring those feature maps.
2.3 Multi-channel LDDMM
We then use the PFCT maps to conduct functional registration. Both feature maps, like FA, MD, and six elements of the upper triangle of the symmetric tensor τ3×3 can represent the PFCTs. Here, for simplification, we only adopt six elements of PFCTs for fMRI registration. Previous algorithms are often useful for single feature map for de-formation filed estimation. In this study, to fully take advantage of the six feature maps, we sought to use another strategy. Multi-channel LDDMM is an algorithm that works on multimodal imaging-based registration. In this study, the six PFCT component maps are regarded as different “modalities”; and the mLDDMM is used to estimate diffeomorphisms.
3 Experimental Results
The rs-fMRI data of 20 healthy subjects were obtained from the New York dataset B in the 1000 Functional Connectomes Project, shared by International Neuroimaging Data-Sharing Initiative (http://fcon_1000.projects.nitrc.org). Each rs-fMRI image consists of 175 frames with a temporal resolution of 2 s. The data were preprocessed based on the conventional pipeline in SPM8 (https://www.fil.ion.ucl.ac.uk/spm/software/spm8/). Specifically, the preprocessing steps included slice-timing correction, head-motion correction, band-pass filtering with 0.01–0.1 Hz, and resampling to 3 × 3 × 3 mm3. For accurate feature extraction, head motion profiles (i.e., the Friston's 24-parameter model) were regressed out from the preprocessed rs-fMRI data. There is no WM-mean-signal regression, as we intend to exploit the information contained in the WM; removal of the mean WM signal could introduce artifacts. No spatial smoothing is conducted as it will blur the functional signals [8].
To show the superiority of our method, we compared it with three well-adopted registration techniques that are implemented in the SPM8 toolkit: (1) Registration based on the mean rs-fMRI image to an EPI template (SPM_EPI) [3]; (2) Registration based on T1 MR images to an T1 template (SPM_T1) [4]; (3) Registration based on Tissue Probability Maps derived from T1 image segmentation (SPM_TPM) [5]. We also include a recently proposed functional registration method [8], which represents the state of the art, for comparison.
We adopt the same evaluation metrics as used in [8], including (1) the peak value of the group-level t maps by voxel-wise one sample t-tests on a brain functional network, (2) spatial overlap between individual functional networks and the group-level network, and (3) inter-subject correlation between individual functional networks. A previous extensively investigated functional network, i.e., the default mode network (DMN), is used to evaluate the performance of functional registration. We apply two popular DMN-detection methods: (1) group independent component analysis (ICA) [13] and (2) seed-based correlation analysis, for comprehensively evaluate the functional registration algorithms. For seed-based correlation, the seed voxel is placed at the posterior cingulate cortex (PCC) with the MNI coordinates of [0, −53, 26] as in [16].
Our results indicate that direct structural registration is unable to align functional regions satisfactorily, and that PFCT is significantly more robust to noise than FCT.
3.1 Group-Level Performance
The inter-subject functional consistency of DMN can be measured by one sample t-test. Under the same FC level, a higher t-value indicates greater inter-subject consistency. Figure 4 shows the group-level t-maps of DMN using two network extraction methods. For the DMN derived from ICA, the peak t-values for SPM_EPI, SPM_T1, SPM_TPM, and our proposed methods are 12.29, 11.90, 12.49, and 17.10, respectively. The seed-based method produces a similar result (20.98, 25.42, 19.46, and 30.16). Particularly, when compared with the recently proposed functional registration method [8], which gives a 28.78% improvement in the peak t-values over the T1-based registration (SPM_T1), our method achieves 43.69% improvement over the T1-based registration (SPM_T1) when applied to the same dataset. Note that our method uses only the rs-fMRI data for functional registration, whereas the method in [8] uses T1 MR image-based structural registration as an initialization for the subsequent functional registration.
Fig. 4.
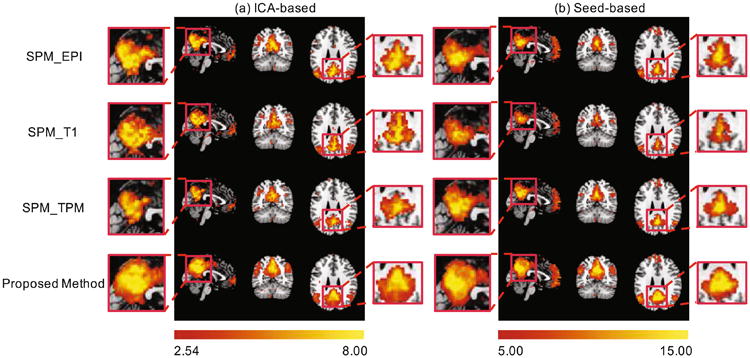
The group-level t-maps of DMN using two validation methods: (a) ICA and (b) seed-based correlation.
3.2 Individual-Level Performance
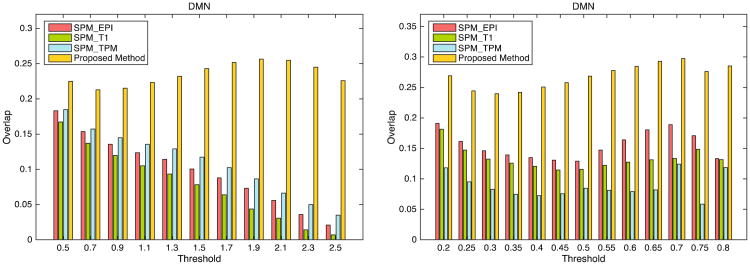
Figure 5 illustrates the overlap between individual DMN FC maps (left: ICA-derived individual z maps; right: seed correlation-derived individual r maps) and the group-level DMN maps across all subjects with different thresholds. It can be observed that the best performance is achieved using our method in all cases.
Fig. 5.
The overlap between the subject-specific DMN-related component and the group-level DMN component with different thresholds using two validation methods: (a) ICA and (b) seed-based correlation.
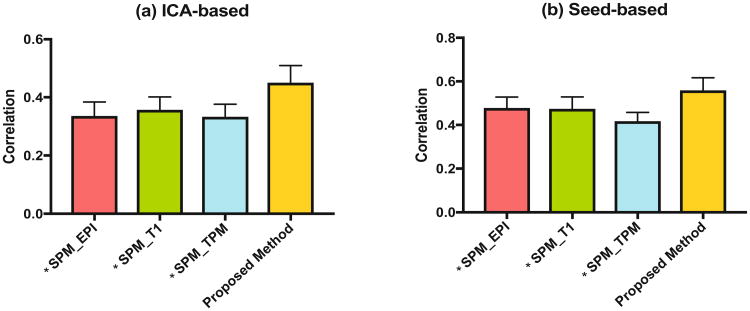
Figure 6 shows the correlation between individual DMN FC maps (left: ICA-derived individual z maps; right: seed correlation-derived individual r maps). Our method obtained significant improvement in all cases.
Fig. 6.
The correlation of inter-subjects' DMN-related component using two validation methods: (a) ICA and (b) seed-based correlation. *denotes significant pair-wise differences for each method vs. our proposed method.
4 Conclusion
In this paper, we have proposed a novel whole-brain functional registration method for rs-fMRI data. It is implemented via a multi-channel Large Deformation Diffeomorphic Metric Mapping (mLDDMM) based on functional correlation tensors (PFCTs) extracted from both GM and WM tissues. Results demonstrate that our method significantly increases inter-subject consistency of functional regions after registration, compared with results by structural image based or cortical functional feature based registration methods.
Acknowledgments
This work was supported in part by NIH grants NS093842 and EB022880.
References
- 1.van den Heuvel MP, Pol HEH. Exploring the brain network: a review on resting-state fMRI functional connectivity. Eur Neuropsychopharm. 2010;20:519–534. doi: 10.1016/j.euroneuro.2010.03.008. [DOI] [PubMed] [Google Scholar]
- 2.Filippini N, MacIntosh BJ, Hough MG, Goodwin GM, Frisoni GB, Smith SM, Matthews PM, Beckmann CF, Mackay CE. Distinct patterns of brain activity in young carriers of the APOE-epsilon 4 allele. Proc Natl Acad Sci USA. 2009;106:7209–7214. doi: 10.1073/pnas.0811879106. [DOI] [PMC free article] [PubMed] [Google Scholar]
- 3.Ashburner J, Friston KJ. Nonlinear spatial normalization using basis functions. Hum Brain Mapp. 1999;7:254–266. doi: 10.1002/(SICI)1097-0193(1999)7:4<254::AID-HBM4>3.0.CO;2-G. [DOI] [PMC free article] [PubMed] [Google Scholar]
- 4.Ashburner J, Friston KJ. Unified segmentation. Neuroimage. 2005;26:839–851. doi: 10.1016/j.neuroimage.2005.02.018. [DOI] [PubMed] [Google Scholar]
- 5.Ashburner J. A fast diffeomorphic image registration algorithm. Neuroimage. 2007;38:95–113. doi: 10.1016/j.neuroimage.2007.07.007. [DOI] [PubMed] [Google Scholar]
- 6.Sabuncu MR, Singer BD, Conroy B, Bryan RE, Ramadge PJ, Haxby JV. Function-based intersubject alignment of human cortical anatomy. Cereb Cortex. 2010;20:130–140. doi: 10.1093/cercor/bhp085. [DOI] [PMC free article] [PubMed] [Google Scholar]
- 7.Frost MA, Goebel R. Measuring structural-functional correspondence: spatial variability of specialised brain regions after macro-anatomical alignment. Neuroimage. 2012;59:1369–1381. doi: 10.1016/j.neuroimage.2011.08.035. [DOI] [PubMed] [Google Scholar]
- 8.Jiang D, Du Y, Cheng H, Jiang T, Fan Y. Groupwise spatial normalization of fMRI data based on multi-range functional connectivity patterns. Neuroimage. 2013;82:355–372. doi: 10.1016/j.neuroimage.2013.05.093. [DOI] [PubMed] [Google Scholar]
- 9.Weber B, Fouad K, Burger C, Buck A. White matter glucose metabolism during intracortical electrostimulation: a quantitative [18 F] fluorodeoxyglucose autoradiography study in the rat. Neuroimage. 2002;16:993–998. doi: 10.1006/nimg.2002.1104. [DOI] [PubMed] [Google Scholar]
- 10.Mazerolle EL, Beyea SD, Gawryluk JR, Brewer KD, Bowen CV, D'arcy RC. Confirming white matter fMRI activation in the corpus callosum: co-localization with DTI tractography. Neuroimage. 2010;50:616–621. doi: 10.1016/j.neuroimage.2009.12.102. [DOI] [PubMed] [Google Scholar]
- 11.Ding Z, Xu R, Bailey SK, Wu TL, Morgan VL, Cutting LE, Anderson AW, Gore JC. Visualizing functional pathways in the human brain using correlation tensors and magnetic resonance imaging. Magn Reson Imaging. 2016;34:8–17. doi: 10.1016/j.mri.2015.10.003. [DOI] [PMC free article] [PubMed] [Google Scholar]
- 12.Zhang P, Niethammer M, Shen DG, Yap PT. Large deformation diffeomorphic registration of diffusion-weighted imaging data. Med Image Anal. 2014;18:1290–1298. doi: 10.1016/j.media.2014.06.012. [DOI] [PMC free article] [PubMed] [Google Scholar]


