Abstract
Background
US opioid overdose death rates have increased between 2000 and 2014. While, the increase in prescription opiate opioid use has been linked to the increase in heroin use, there are reasons to view this relationship as a partial explanation for the recent increase in heroin-related harms. This study documents the differences in trends in prescription opiate overdose (POD) and heroin overdose (HOD) hospitalizations.
Methods
Data come from the National Inpatient Sample (NIS) for the years 2000 through 2014. POD and HOD hospitalizations were abstracted from ICD-9 codes. Rates of POD and HOD by census region and census division were constructed along with separate rates for age and race. Regression analysis analyzing trends across region were estimated along with graphs for documenting differences in POD and HOD rates.
Results
POD hospitalization rates were highest in the South and lowest in the Northeast. HOD hospitalization rates were highest in the Northeast region and grew the fastest in the Midwest. There was statistically significant heterogeneity in HOD trends but not POD trends across the four regions between 2000 and 2014. Between 2012 and 2014 POD rates decreased in eight of the nine census divisions, with only New England showing an increase. HOD hospitalization rates increased in all nine census divisions between 2012 and 2014. Both POD and HOD rates show different demographic patterns across the nine census divisions.
Conclusion
Comparing POD and HOD hospitalization trends reveals significant disparities in geographic as well as demographic distributions. These Mepidemics are evolving and the simple opioid-to-heroin transition story is both supported and challenged by this paper. The opioid pill, heroin and fentanyl crises are intertwined yet increasingly have drivers and outcomes that support examining them as distinct. Addressing these complex and interrelated epidemics require innovative public health research and interventions which need to consider local and regional contexts.
Keywords: Heroin, Overdose, Prescription, Opiate, Overdose
Introduction
It is well documented that drug overdose death rates have increased dramatically between 2000 and 2014 in the US and that opioid drugs are the largest contributor to these deaths (Hedegaard, Warner, & Minino, 2017; Rudd, Seth, David, & Scholl, 2016). However, overdose deaths represent the tip the iceberg of harm associated with licit and illicit opioid (e.g. medical and non-medical prescription opioids and heroin) drug use. The increase in opioid overdoses could be attributable to several mechanisms that can broadly be distilled to one of two main causes: (1) increased number of users or (2) increased danger of use.
The widespread availability of prescription opioids (PO) is well documented and has resulted in increases in both their medical and non-medical use (Compton, Jones, & Baldwin, 2016; Dart et al., 2015). Prevalence estimates from nationally representative population studies suggest that PO use increased between 1999 and 2012 but has been flat since then (Frenk, Porter, & Paulozzi, 2015). However, these trends mask a divergence between non-medical prescription opioid (NMPO) use which peaked in 2010 and has since declined and rates of PO medical use which have not declined from their peak (Dart et al., 2015; Frenk et al., 2015).
More recently the number of heroin users in the US has increased. Between the 2002 and 2013 past year heroin use has increased from 1.6 per 1000 persons to 2.6 per 1000 (Jones, Logan, Gladden, & Bohm, 2015; Martins, Sarvet, & Santaella-Tenorio, 2017). While the increase in Heroin Use Disorder has been spread evenly across the 4 census regions, it has been concentrated in white non-Hispanic males under the age of 44 (Martins et al., 2017).
This reduction in the use of NMPO and corresponding increase in heroin use have led to a hypothesis that the opioid and heroin epidemics are intertwined (G. J. Unick, Rosenblum, Mars, & Ciccarone, 2013). Many investigators have linked the increase in prescription opioid use to the increase in heroin use (Banerjee et al., 2016; Cerda, Santaella, Marshall, Kim, & Martins, 2015; Cicero, Ellis, & Harney, 2015; Cicero, Ellis, Surratt, & Kurtz, 2014; Dart et al., 2015; Jones, 2013; G. J. Unick et al., 2013). There are several reasons to believe that there is a causal relationship between PO availability and use and the recent rise in heroin use. First, from the perspective of a person highly dependent on opioids, PO and heroin are substitutable, i.e., both can stave off withdrawal symptoms and produce the desired psychoactive effects. While many users have preferences for one type of opioid or another based on route of administration, desired effects, etc., availability and cost will also have an effect of which drugs users buy and consume. For example, the recent change in high-dose extended-release oxycodone (brand name OxyContin) to an abuse deterrent formulation may have reduced non-medical use of this drug by increasing its price and decreasing its availability relative to heroin(Cicero et al., 2014). A second reason to suspect that NMPO use set the stage for the recent increase in heroin use is research which reports young heroin users initially developing dependence on opioids with PO but switching to heroin due to its greater availability and lower cost (Mars, Bourgois, Karandinos, Montero, & Ciccarone, 2014). These studies suggest that PO use has been a recent gateway for initiation of heroin use (Cicero et al., 2014; Compton et al., 2016; Grau et al., 2007; Mars et al., 2014). The implication of these findings is that the reduction in access or relative desirability of PO for non-medical use has led to an increase in the number of individuals using heroin and thus responsible for the increase in heroin-related harm.
However, there are reasons to view the causal relationship between PO availability and use and heroin use as only a partial explanation for the recent increase in heroin use and subsequent harms. First, drug use gateway arguments in general have been widely discredited and should be viewed with caution (Kleinig, 2015). Second, there is reason to believe that other factors are affecting rates of drug overdoses for both prescription opioids and heroin. Survey data suggest that the number of individuals using prescription opioids plateaued between 2003 and 2006 but that the number of prescriptions and the morphine equivalence of those prescriptions continued to increase (Cicero et al., 2014; Frenk et al., 2015). Logically, these data suggest that use intensified for those that were prescribed opioids and perhaps even for those whom obtained PO through diverted supply. Escalating dosage of PO per userand the corresponding higher levels of opiate dependency is a potential explanation for the increasing harms seen after transition to heroin.
There are also reasons to believe that the heroin supply is changing and maybe becoming more dangerous. Recent reports on overdose due to synthetic opioids highlights the role of illicitly manufactured fentanyl and fentanyl analogs in the adulteration of the heroin supply (Gladden, Martinez, & Seth, 2016). Fentanyl’s potency, 30–40 times that of heroin (author DC’s calculation), and fluctuations in potency are implicated in heroin-related overdose (Ciccarone, Mars, & Ondocsin, 2017; Lucyk & Nelson, 2017; Mars; Somerville et al., 2017). Furthermore, there is evidence that the macro heroin supply is changing with the introduction of a new source-form of heroin coming from Mexico; with unknown risk implications for individuals and user populations (Ciccarone, 2017; Ciccarone et al., 2017; G. Unick, Rosenblum, Mars, & Ciccarone, 2014).
Furthermore, evidence from ecological data suggest that there is a positive synergy between prescription opioid related harm and heroin related harms rather than a substitution. Prior work has found that increases in POD hospitalizations are associated with subsequent year increases in HOD hospitalization and that the converse is true as well(G. J. Unick et al., 2013). This suggests that rather than a substitution of heroin for prescription opioids, increases in observable drug related harm happen concurrently, which is consistent with several hypotheses other than a simple pills-to-heroin transition story.
The purpose of this study is to document differences in distribution of and trends in POD and HOD hospitalizations. POD and HOD hospitalizations make a limited but unique contribution to the literature on opioid related harms. Overdoses that result in hospitalization encompass a wider range of overdose severity, and so capture events that may be missed in the death data. Hospitalizations also are well documented and available for long time frames, allowing a more detailed assessment of the demographic and medical factors associated with the overdose event (Reardon, Harmon, Schult, Staton, & Waller, 2016). Biases in the coding of hospital data are likely to be different than those affecting death data and so present an opportunity to triangulate with excising literature on POD and HOD deaths. We will look at the rates of POD and HOD at the Census Region and Division geographic levels and examine variation in the distribution of the demographics of overdose related hospitalization. The goal of this paper is to provide a map of POD and HOD hospitalizations to identify deviation from the simple pills-to-heroin transition story. This map can then serve as a guide for future studies seeking to identify more detailed and specific causal mechanisms behind the recent increase in HOD and heterogeneity in POD to inform surveillance and prevention efforts.
Methods
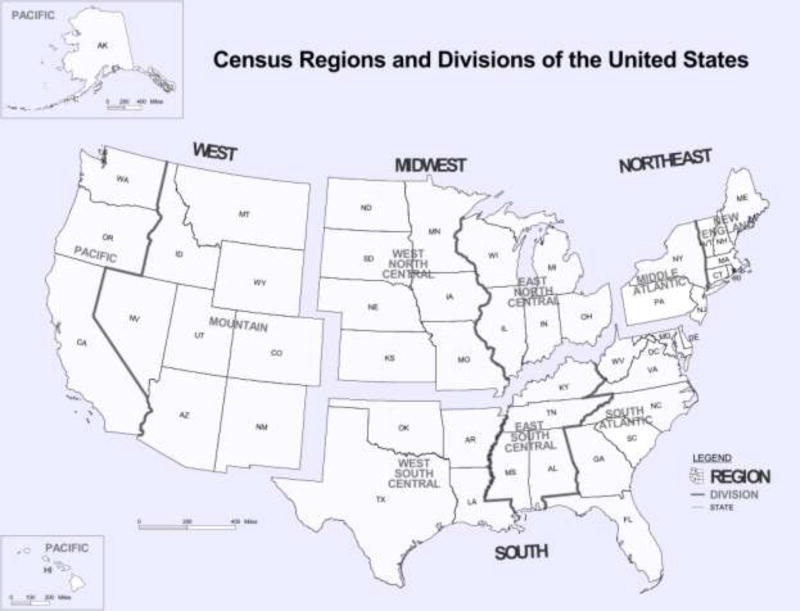
Data come from the National Inpatient Sample (NIS), an approximately 20-percent stratified national sample of United States Community Hospitals(Houchens, Ross, Elixhauser, & Jiang, 2014). The 2000 through 2014 NIS were used to estimate the number of POD and HOD. Because of design changes to the NIS we used the trends weights file for the 2000 to 2011 data as recommended by HCUP(Healthcare Cost and Utilization Project (HCUP), 2015). The 2000 through 2011 NIS sampling strategy used Census Regions, the 2012 through 2014 NIS used Census Divisions. For the initial analysis of the 2000 through 2014 POD and HOD trends we use the hospital region as the geographic unit but switch to the hospital division for the 2012 through 2014 analysis.
Cases of POD and HOD were coded using ICD-9 codes included in the billing records reported by participating states to the NIS. An admission was considered a POD or HOD if one of the two following conditions was met: any diagnosis of 965.00, 965.01, 965.02 or 965.09, or an E code of E850.0, E850.1, or E8502. Recent research suggests that use of any diagnoses is more sensitive without a loss of specificity compared with primary diagnoses(Slavova, Bunn, & Talbert, 2014). Overdoses were split into HOD and POD. HOD were restricted to diagnoses coded as 965.01 or an E code of E850.0. POD were restricted to diagnoses coded as 965.00, 965.02 or 965.09, or an E code of E850.1 or E8502.
The goal of this analysis is primarily descriptive and designed to characterize changing geographic and demographic patterns of hospital admissions for POD and HOD. Both Stata 14.2 and SAS 9.2 were used in data coding and analysis(SAS Institute Inc, 2013; StataCorp, 2015). Proc Surveyfreq was used to estimate the number of admissions adjusting the estimates for the sampling design using weights, strata and sampling units. The use of weights and complex sample design characteristics allows for representative estimates nationally, within census regions for all years and within census divisions for years 2012 through 2014. Cross tabulations of POD and HOD with race, gender, age categories in five-year increments, and by region, were estimated. Yearly rates of overdose admissions per 100,000 US population were constructed for each of the above demographic groups. CDC Wonder data for region, division and different age and race categories were used as the population denominators for the rate calculations. We used Stata 14.2 to estimate regression models predicting the rate of POD and HOD respectively. For these analyses, we used the 2000 to 2014 time series data that was estimated for each of the four Census Regions (see Figure 1) and estimated models with linear and quadratic time functions and interactions with the region to document differences in the POD and HOD epidemics. For graphics showing the 15 years of POD and HOD data we smoothed the rates using a moving average, weighing the lag and leading years at 0.5 weights. The data on POD and HOD hospitalizations by Census Division was only available for the 2012 through 2014 data. For these data, we estimated rates by division for the above mentioned demographic groups.
Figure 1.
Map of Census Regions and Divisions
Results
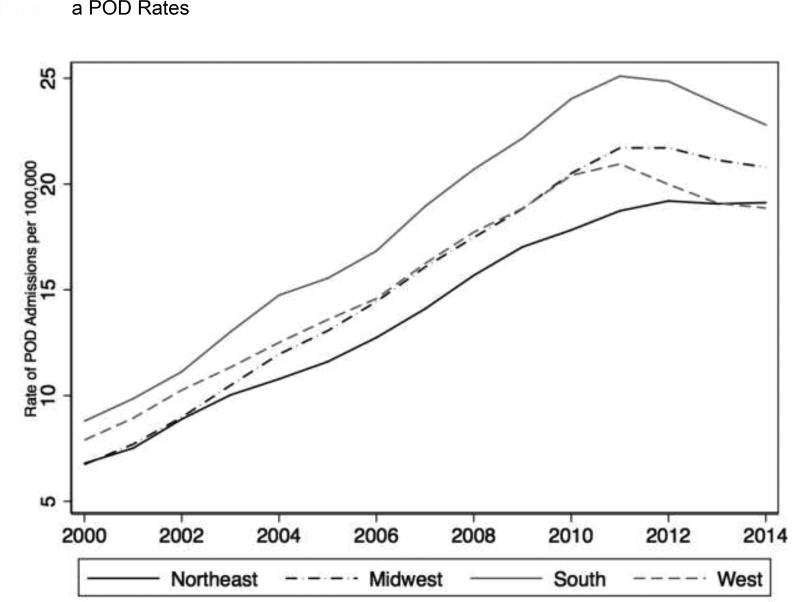
Figure 2a shows the change in POD hospitalization rates per 100,000 by region between 2000 and 2014. Changes in rate were modeled using a regression with a quadratic time function and an interaction between linear time and region with the South Region used as the baseline. The results of this model are shown in table 1. According to the model, POD rates show a steady increase across all 4 census regions between 2000 and 2010 but then attenuate and even decrease between 2011 and 2014 as indicated by the negative time2 coefficient. Compared to the grand mean rate across time and region, only the South region (p< 0.01) had a statistically significant higher marginal mean rate of POD, while the Northeast had a statistically significantly lower marginal mean rate of POD (p=0.02). Yearly increases in POD hospitalizations per 100,000 in 2000 were largest in the South region (2.04 POD/100000 per year), statistically significantly larger than the Northeast (1.80) and the West (1.75) but indistinguishable from the Midwest (1.98). We also estimated a model with an interaction between region and the quadratic time function but these parameters did not statistically improve the model suggesting that the change in the rate of POD was statistically indistinguishable across all four regions.
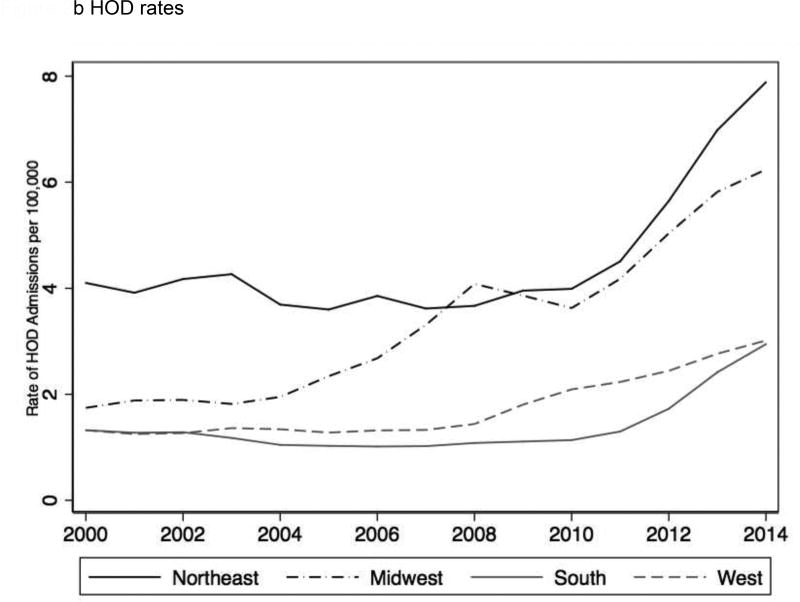
Figure 2.
a POD Rates
b HOD rates
Table 1.
Regression of POD and HOD rates on Census Region
| POD | HOD | |||||
|---|---|---|---|---|---|---|
| b | ci95 | p | b | ci95 | p | |
| Year | 2.04 | [1.75,2.32] | 0.000 | −0.56 | [−0.82, −0.31] | 0.000 |
| Year2 | −0.06 | [−0.07, −0.04] | 0.000 | 0.05 | [0.04,0.07] | 0.000 |
| Northeast | −2.51 | [−4.10, −0.92] | 0.003 | ref | - | . |
| Midwest | −2.32 | [−3.91,−0.73] | 0.005 | −3.09 | [−4.18, −2.00] | 0.000 |
| South | ref | - | . | −3.15 | [−4.25, −2.06] | 0.000 |
| West | −0.68 | [−2.27,0.90] | 0.391 | −3.39 | [−4.48, −2.30] | 0.000 |
| Northeast * Time | −0.24 | [−0.43, −0.05] | 0.016 | Ref | - | . |
| Midwest * Time | −0.06 | [−0.25,0.14] | 0.570 | 0.60 | [0.24,0.97] | 0.002 |
| South * Time | Ref | - | . | 0.28 | [−0.09,0.64] | 0.131 |
| West * Time | −0.29 | [−0.48, −0.10] | 0.004 | 0.45 | [0.09,0.82] | 0.015 |
| Northeast * Time2 | ref | - | . | |||
| Midwest * Time2 | −0.03 | [−0.06, −0.01] | 0.009 | |||
| South * Time2 | −0.03 | [−0.05, −0.00] | 0.027 | |||
| West * Time2 | −0.04 | [−0.06, −0.01] | 0.004 | |||
| Constant | 7.72 | [6.47,8.96] | 0.000 | 4.79 | [4.02,5.56] | 0.000 |
| R-squared | 0.96 | 0.91 | ||||
| N | 60.00 | 60.00 | ||||
Figure 2b shows the HOD rate of hospitalization per 100,000 between 2000 and 2014. The HOD regression model is also shown in Table 1. The Northeast had the highest rate of HOD, which was over twice as high in 2000 as the other three regions. Slopes of the rate of HOD over time were flat or negative until 2008–2010 for all regions except for the Midwest, which had the earliest upswing starting in 2003–2004. The quadratic term shows the estimate for the yearly increase in the acceleration of the rate of HOD hospitalizations per 100,000 and the interaction between the time2 term and region show differences in the rate of acceleration. According to the model, by 2014 the Midwest was showing estimated yearly increases of 5.1 in the rate of HOD hospitalization per 100,000, followed by the Northeast (2.85), while the South (0.3) and the West (0.6) showed small increases in HOD hospitalizations. While the Midwest had the largest increase over time, the Northeast had the fastest rate of acceleration in the slope after 2010 as indicated by the negative interaction terms for the region by time2 coefficients for the three other regions.
Two additional regression models were estimated (not shown) including the rates of POD and HOD hospitalizations for 5-year age categories and racial and ethnic groups along with interactions with the time variable. These models allow us to identify age groups or racial/ethnic groups that had changes in POD or HOD hospitalizations that were statistically different. With respect to age categories, individuals 55 – 59 and older had statistically significant higher increases in yearly rates of POD hospitalizations compared to those aged below 50. For example, between 2009 and 2010, 55–59 year olds had an estimated 1.93 increase in the rate per 100,000 POD hospitalizations, while 25–29 year olds had an estimated increase of 0.23 POD hospitalizations per 100,000. For HOD, 25–29 year olds had the largest increases in year over year HOD hospitalization rates. The rates of 25–29 year olds were statistically significantly higher compared with all groups except for 20–24 year olds. For example, between 2009 and 2010, 25–29 year olds had an increase of 1.03 HOD hospitalizations per 100,000, while 50–54 year olds had an increase of 0.49 HOD hospitalizations per 100,000.
For both the POD and HOD race-ethnicity models, non-Hispanic whites had statistically significantly steeper increases in rates of hospitalization per 100,000 compared with other categories. As shown in figure 1a, POD hospitalization rates peak around 2010–2011. Between 2009 and 2010 whites had an estimated increase of 1.26 POD hospitalizations per 100,000, while blacks had an increase of 0.7 POD hospitalization per 100,000. For HOD, during this 2009 to 2010 period, whites had an increase of 0.37 HOD per 100,000, while blacks had an increase of 0.25 HOD per 100,000.
Switching from Census Regions to an analysis of POD and HOD hospitalization rates in nine Census Divisions shortens the time frame of the analysis to the years 2012 to 2014, but allows a more detailed geographic assessment of recent trends. Table 2 shows the POD and HOD rates for 2012 through 2014 for all 9 census divisions and the relative percent change during that time frame. For every Census Division POD rates decrease except for the New England Division. East South Central has the highest rate of POD but also the largest percentage decrease during these three years. The Mountain and South Atlantic Divisions had the next highest rates. The Mid Atlantic, West South Central and West Divisions had the lowest rates.
Table 2.
2012 through 2014 POD and HOD Rates by Census Division
| Census Division | 2012 POD Rate |
2013 POD Rate |
2014 POD Rate |
Relative Percent Change |
2012 HOD Rate |
2013 HOD Rate |
2014 HOD Rate |
Relative Percent Change |
|---|---|---|---|---|---|---|---|---|
| New England | 15.19 | 15.75 | 17.02 | 12.03% | 6.45 | 7.79 | 8.68 | 34.63% |
| Mid Atlantic | 13.94 | 13.27 | 13.37 | −4.09% | 4.08 | 5.52 | 6.48 | 58.77% |
| East North Central | 15.92 | 14.16 | 14.26 | −10.45% | 5.49 | 6.28 | 6.71 | 22.24% |
| West North Central | 16.04 | 16.01 | 15.09 | −5.93% | 2.82 | 2.23 | 3.26 | 15.71% |
| South Atlantic | 19.03 | 18.23 | 17.15 | −9.92% | 1.55 | 2.15 | 3.45 | 122.16% |
| East South Central | 28.54 | 26.29 | 23.30 | −18.37% | 1.64 | 2.67 | 3.46 | 111.30% |
| West South Central | 13.83 | 12.82 | 11.98 | −13.35% | 1.13 | 1.25 | 1.30 | 14.55% |
| Mountain | 20.20 | 18.56 | 18.90 | −6.43% | 2.87 | 3.36 | 3.15 | 9.52% |
| West | 13.35 | 13.16 | 12.98 | −2.73% | 1.85 | 1.97 | 2.44 | 31.79% |
In contrast to the POD rates, HOD rates increase in every division. New England has the highest rate of HOD hospitalizations, followed by the East North Central. The South Atlantic and East South Central had lower rates but had higher relative increases in the rates between 2012 and 2014. The West South Central and West Divisions had the lowest rates and the lowest percentage increase in rates.
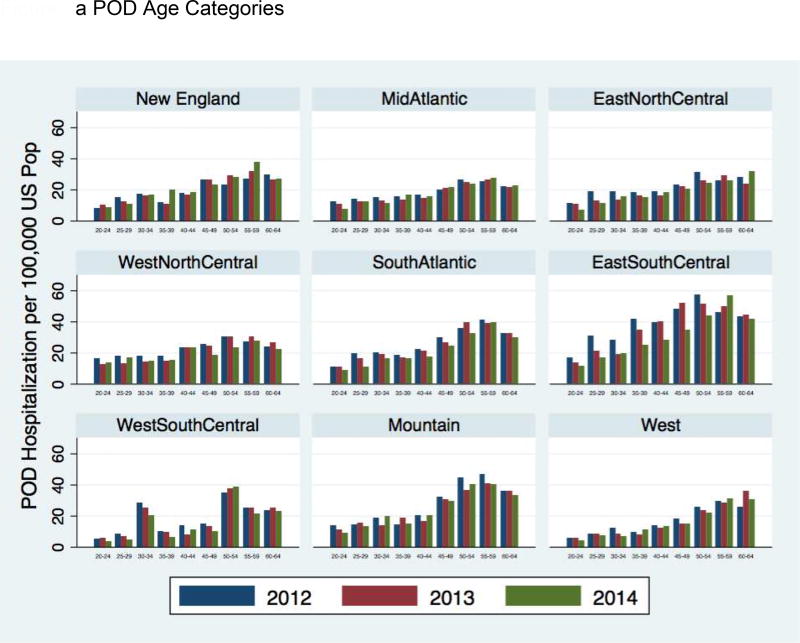
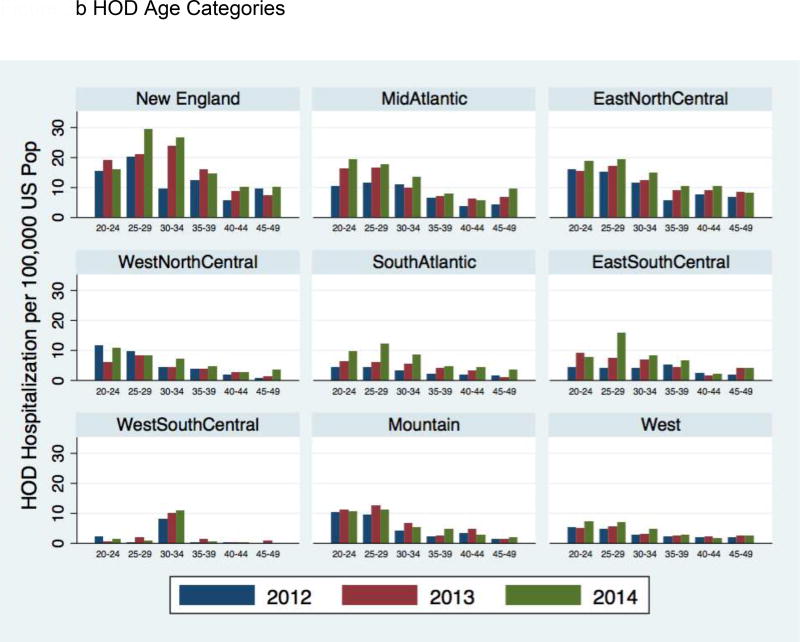
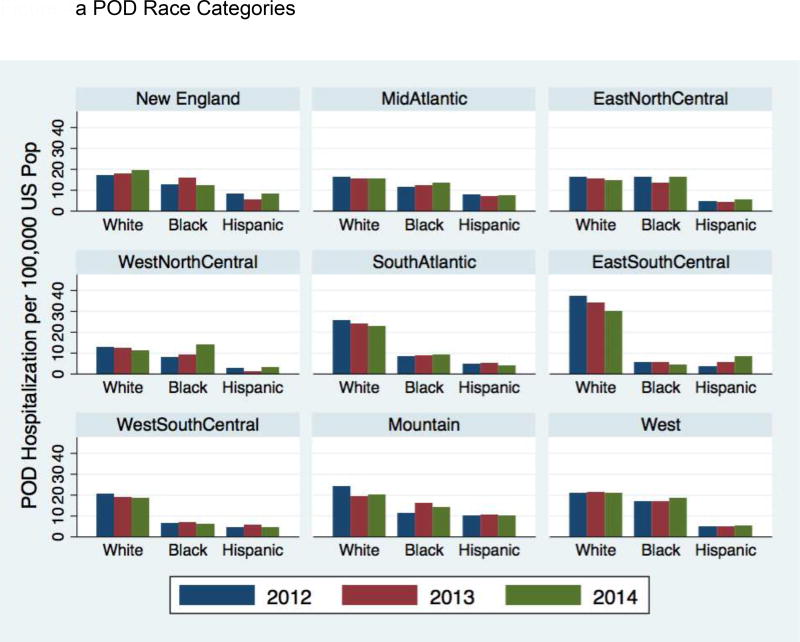
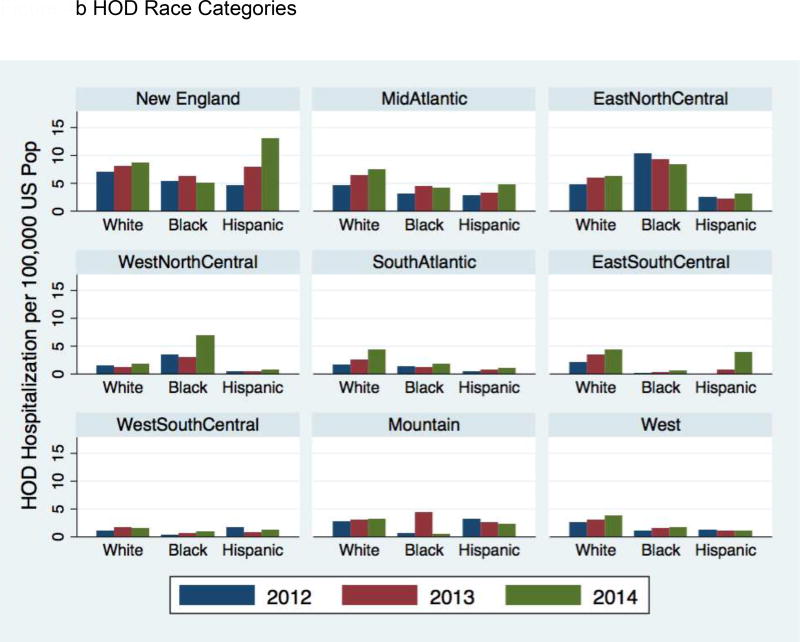
Demographically, the analysis of the Census Divisions reveals a similar pattern in general to the one described above in the Region analysis, but with some caveats. Figure 3a shows the POD rates by 5-year age categories for the nine Census Divisions. The most dramatic changes are in the East South Central, which for the NIS only samples Kentucky and Tennessee, where all age categories between 20 and 54 show substantial declines on the rate of POD hospitalization between 2012 and 2014. Other regions show some decrease in POD rates but not consistently across age categories. Figure 3b shows the rates of HOD by age categories for the nine Census Divisions. Most divisions had increases during this time frame for individuals in their 20s and early 30s, with the Mountain region being the exception. Figure 4a shows the POD hospitalization rate by race-ethnicity for the nine Census Divisions. Overall whites had the highest rates of POD hospitalizations with the East South Central being the most dramatic example. Figure 4b shows the HOD hospitalization rate by race-ethnicity for each Division. Whites had increases in HOD rates in most of the divisions. Blacks had a mixed profile with increases in the West North Central but flat or decreasing in other divisions. Hispanics had mixed changes in rates across the divisions except for New England where they had the largest increase in HOD rates during this period, which is unique among the divisions.
Figure 3.
a POD Age Categories
b HOD Age Categories
Figure 4.
a POD Race Categories
b HOD Race Categories
Discussion
Comparing POD and HOD hospitalization trends reveals significant disparities in geographic as well as demographic distributions. While POD trends are mostly even across regions, HOD trends contrast across regions, with the much highest rates in the Midwest and Northeast. This is reflected in the statistical analysis of the Census Regions and in the more detailed geographic analysis of the Divisions. In the more recent time analysis, 2012–4, POD is trending downward in eight of nine census divisions while HOD is rising in every division with the Northeast, East North Central and Mid-Atlantic divisions showing the highest increases.
The POD and HOD epidemics are evolving and the simple opioid-to-heroin transition story is both supported and challenged by the findings presented in this paper. Difference in age distributions between POD and HOD may support the notion of a different population at-risk. While not directly addressed by this data, an explanation for these findings is that a smaller, younger, subset of risky persons coming out of the much larger population at-risk using opioid pills are making the transition to heroin. In examining the nine Census divisions, certain ones, eg East South Central and New England, have simultaneous and proportional rises in HOD rates as POD rates decline, supporting the transition story. However, geographic disparities in HOD require a different explanation.
Contrasting this data on heroin-related harms to survey data provides evidence that the recent increase in HOD hospitalizations is not just about growing prevalence of heroin use. Population surveys reveal that heroin use increased evenly across the four Census Regions suggesting that the increase in the population at risk has been even (Jones et al., 2015; Martins et al., 2017). However, the divergence in HOD hospitalization rates across geographic locations, supported by these results, suggest that some areas are experiencing increases in risk from heroin use, not just an increase in the number of heroin users.
There are a number of hypotheses that would explain the geographic divergence of heroin-related harms concurrent with homogenous geographic increases in the population at risk. A prime explanation is that heroin has become more dangerous due to adulteration with the chemical family of fentanyls. Fentanyl adulterated or substituted heroin is a substantial change in the risk environment for users (Ciccarone, 2017; Ciccarone et al., 2017). There are reports of increasing fentanyls in the drug supply (U.S. Drug Enforcement Administration Diversion Control Division, 2017) and dramatically rising synthetic opioid-related overdose mortality (including fentanyls but not methadone) (Somerville et al., 2017); both report 2013 as a significant year in the rise of the fentanyl problem. A key report from the US Centers for Disease Control and Prevention (CDC) highlights that the regional distribution of the fentanyls supply aligns with states that have higher synthetic opioid-related overdose (Gladden et al., 2016). Furthermore, the geographic disparities in HOD noted in this paper align with these reports on synthetic overdose, suggesting that, at least to some degree, heroin overdoses may involve fentanyl or other synthetic opioids. Seven states identified by the CDC as having the highest increase in rates of synthetic opioid overdose (2013–2014) are identified in our 2012–2014 analysis as also having the highest rise in HOD rates – New England (Massachusetts, New Hampshire, Maine), South Atlantic (Maryland, West Virginia), East North Central (Ohio) and East South Central (Kentucky).
Fentanyls adulteration is a reasonable but not altogether sufficient explanation of the cause of rising rates of HOD hospitalization and its geographic differences. Changes in the supply of fentanyls and in synthetic opioid overdose began in 2013 while HOD rates have been rising in some regions, particularly the Midwest, starting much earlier. Further research on the drivers of HOD would include investigation of rising numbers of heroin users and their vulnerabilities.
Speculatively, new, and younger, heroin users may be more vulnerable to HOD in several ways. Intensity of habit or differences in modes of administration may be the mechanisms in increasing risk of heroin use, explaining in part the rise of heroin-related harms. For example, users switching from PO to heroin may have deeper opioid dependency compared with previous generations of heroin users who had never used opioids prior to heroin (Mars et al., 2014). New initiates may have faster uptake of injecting heroin over other safer routes of consumption, eg, insufflation. This may be driven by users’ level of dependency or by cultural forces, eg, fostered by endemic heroin use in the Northeast. Ethnographic evidence suggests that injecting is a skill taught by one injector to another, thus requiring a population of existing injection instructors to propagate the practice (Goldsamt, Harocopos, Kobrak, Jost, & Clatts, 2010).
Limitations
There are several limitations to this study. One obvious limitation is that the denominator for the rates presented is the general population not the number of individuals at risk. Hospitalizations are not the typical outcome associated with drug overdoses and may have geographic confounds that are not related to the prevalence of users or the harms of drug use. Both limitations would have a large effect on the rates presented here. Furthermore, use of ICD9 codes has relatively high specificity but lower sensitivity (Reardon et al., 2016). Some of the differences in rates may be due to coding procedures and areas with histories of higher levels of heroin or prescription drug use may be more likely to code these events producing differences in specificity of these codes across geographic areas.
Conclusion
The opioid pill, heroin and fentanyl crises are intertwined yet increasingly have outcomes that support examining them as distinct. Both the rise in Mexican-sourced heroin in the eastern US and the regional contamination with fentanyls represent a supply shock to the US heroin supply (Ciccarone, 2017). Innovation in products, including fentanyl-adulterated and -substituted heroin (Ciccarone, Mars, Ondocsin, same issue, 2017), as well as novel powdered heroin from Mexico is driving an unprecedented and deadly heroin crisis in America. Teasing these vectors apart will require innovative public health research incorporating both qualitative and quantitative study (Ciccarone, 2003). Interventions should be considered within local and regional contexts and include expanded treatment, wider and ample distribution of the opioid antagonist naloxone (Frank & Pollack, 2017), improved surveillance strategies (Ciccarone, 2017) and supervised injection facilities (Potier, Laprévote, Dubois-Arber, Cottencin, & Rolland, 2014).
Footnotes
Publisher's Disclaimer: This is a PDF file of an unedited manuscript that has been accepted for publication. As a service to our customers we are providing this early version of the manuscript. The manuscript will undergo copyediting, typesetting, and review of the resulting proof before it is published in its final citable form. Please note that during the production process errors may be discovered which could affect the content, and all legal disclaimers that apply to the journal pertain.
References
- Banerjee G, Edelman EJ, Barry DT, Becker WC, Cerda M, Crystal S, Marshall BD. Non-medical use of prescription opioids is associated with heroin initiation among US veterans: a prospective cohort study. Addiction. 2016;111(11):2021–2031. doi: 10.1111/add.13491. [DOI] [PMC free article] [PubMed] [Google Scholar]
- Cerda M, Santaella J, Marshall BD, Kim JH, Martins SS. Nonmedical Prescription Opioid Use in Childhood and Early Adolescence Predicts Transitions to Heroin Use in Young Adulthood: A National Study. J Pediatr. 2015;167(3):605–612. e601–602. doi: 10.1016/j.jpeds.2015.04.071. [DOI] [PMC free article] [PubMed] [Google Scholar]
- Ciccarone D. With both eyes open: notes on a disciplinary dialogue between ethnographic and epidemiological research among injection drug users. International Journal of Drug Policy. 2003;14(1):115–118. [Google Scholar]
- Ciccarone D. Editorial. Int J Drug Policy, Forthcomming 2017 [Google Scholar]
- Ciccarone D, Mars S, Ondocsin J. Heroin uncertainties: exploring users’ perceptions of fentanyl-adulterated and -substituted ‘heroin’. Int J Drug Policy, Same Issue. 2017 doi: 10.1016/j.drugpo.2017.06.004. [DOI] [PMC free article] [PubMed] [Google Scholar]
- Cicero TJ, Ellis MS, Harney J. Shifting Patterns of Prescription Opioid and Heroin Abuse in the United States. N Engl J Med. 2015;373(18):1789–1790. doi: 10.1056/NEJMc1505541. [DOI] [PubMed] [Google Scholar]
- Cicero TJ, Ellis MS, Surratt HL, Kurtz SP. The changing face of heroin use in the United States: a retrospective analysis of the past 50 years. JAMA Psychiatry. 2014;71(7):821–826. doi: 10.1001/jamapsychiatry.2014.366. [DOI] [PubMed] [Google Scholar]
- Compton WM, Jones CM, Baldwin GT. Relationship between Nonmedical Prescription-Opioid Use and Heroin Use. N Engl J Med. 2016;374(2):154–163. doi: 10.1056/NEJMra1508490. [DOI] [PMC free article] [PubMed] [Google Scholar]
- Dart RC, Surratt HL, Cicero TJ, Parrino MW, Severtson SG, Bucher-Bartelson B, Green JL. Trends in opioid analgesic abuse and mortality in the United States. N Engl J Med. 2015;372(3):241–248. doi: 10.1056/NEJMsa1406143. [DOI] [PubMed] [Google Scholar]
- Frank RG, Pollack HA. Addressing the Fentanyl Threat to Public Health. N Engl J Med. 2017;376(7):605–607. doi: 10.1056/NEJMp1615145. [DOI] [PubMed] [Google Scholar]
- Frenk SM, Porter KS, Paulozzi LJ. Prescription opioid analgesic use among adults: United States, 1999–2012. NCHS Data Brief. 2015;(189):1–8. [PubMed] [Google Scholar]
- Gladden RM, Martinez P, Seth P. Fentanyl Law Enforcement Submissions and Increases in Synthetic Opioid-Involved Overdose Deaths - 27 States, 2013–2014. MMWR Morb Mortal Wkly Rep. 2016;65(33):837–843. doi: 10.15585/mmwr.mm6533a2. [DOI] [PubMed] [Google Scholar]
- Goldsamt LA, Harocopos A, Kobrak P, Jost JJ, Clatts MC. Circumstances, pedagogy and rationales for injection initiation among new drug injectors. J Community Health. 2010;35(3):258–267. doi: 10.1007/s10900-010-9231-z. [DOI] [PMC free article] [PubMed] [Google Scholar]
- Grau LE, Dasgupta N, Harvey AP, Irwin K, Givens A, Kinzly ML, Heimer R. Illicit use of opioids: is OxyContin a"gateway drug"? Am J Addict. 2007;16(3):166–173. doi: 10.1080/10550490701375293. [DOI] [PubMed] [Google Scholar]
- Healthcare Cost and Utilization Project (HCUP) Trend HCUP NIS Trend Weights. 2015 Retrieved from www.hcup-us.ahrq.gov/db/nation/nis/trendwghts.jsp.
- Hedegaard H, Warner M, Minino AM. Drug Overdose Deaths in the United States, 1999–2015. NCHS Data Brief. 2017;(273):1–8. [PubMed] [Google Scholar]
- Houchens R, Ross D, Elixhauser A, Jiang J. Nationwide Inpatient Sample (NIS) Redesign Final Report. 2014 Retrieved from http://www.hcup-us.ahrq.gov/reports/methods/methods.jsp.
- Jones CM. Heroin use and heroin use risk behaviors among nonmedical users of prescription opioid pain relievers - United States, 2002–2004 and 2008–2010. Drug Alcohol Depend. 2013;132(1–2):95–100. doi: 10.1016/j.drugalcdep.2013.01.007. [DOI] [PubMed] [Google Scholar]
- Jones CM, Logan J, Gladden RM, Bohm MK. Vital Signs: Demographic and Substance Use Trends Among Heroin Users - United States, 2002–2013. MMWR Morb Mortal Wkly Rep. 2015;64(26):719–725. [PMC free article] [PubMed] [Google Scholar]
- Kleinig J. Ready for Retirement: The Gateway Drug Hypothesis. Subst Use Misuse. 2015;50(8–9):971–975. doi: 10.3109/10826084.2015.1007679. [DOI] [PubMed] [Google Scholar]
- Lucyk SN, Nelson LS. Novel Synthetic Opioids: An Opioid Epidemic Within an Opioid Epidemic. Ann Emerg Med. 2017;69(1):91–93. doi: 10.1016/j.annemergmed.2016.08.445. [DOI] [PubMed] [Google Scholar]
- Mars S. It’s not heroin anymore! Perceptions and Use of Evolving Heroin in Baltimore, MD. Journal of Psychoactive Drugs. doi: 10.1080/02791072.2017.1394508. [DOI] [PMC free article] [PubMed] [Google Scholar]
- Mars S, Bourgois P, Karandinos G, Montero F, Ciccarone D. "Every 'never' I ever said came true": transitions from opioid pills to heroin injecting. Int J Drug Policy. 2014;25(2):257–266. doi: 10.1016/j.drugpo.2013.10.004. [DOI] [PMC free article] [PubMed] [Google Scholar]
- Martins SS, Sarvet A, Santaella-Tenorio J. Changes in US Lifetime Heroin Use and Heroin Use Disorder. JAMA Psychiatry. 2017;74(4):445–455. doi: 10.1001/jamapsychiatry.2017.0113. [DOI] [PMC free article] [PubMed] [Google Scholar]
- Potier C, Laprévote V, Dubois-Arber F, Cottencin O, Rolland B. Supervised injection services: what has been demonstrated? A systematic literature review. Drug and alcohol dependence. 2014;145:48–68. doi: 10.1016/j.drugalcdep.2014.10.012. [DOI] [PubMed] [Google Scholar]
- Reardon JM, Harmon KJ, Schult GC, Staton CA, Waller AE. Use of diagnosis codes for detection of clinically significant opioid poisoning in the emergency department: A retrospective analysis of a surveillance case definition. BMC Emerg Med. 2016;16:11. doi: 10.1186/s12873-016-0075-4. [DOI] [PMC free article] [PubMed] [Google Scholar]
- Rudd RA, Seth P, David F, Scholl L. Increases in Drug and OpioidInvolved Overdose Deaths - United States, 2010–2015. MMWR Morb Mortal Wkly Rep. 2016;65(5051):1445–1452. doi: 10.15585/mmwr.mm655051e1. [DOI] [PubMed] [Google Scholar]
- SAS Institute Inc. SAS/ACCESS 9.4 Interface to ADABAS: Reference. Cary, NC: SAS Institute Inc; 2013. [Google Scholar]
- Slavova S, Bunn TL, Talbert J. Drug overdose surveillance using hospital discharge data. Public Health Rep. 2014;129(5):437–445. doi: 10.1177/003335491412900507. [DOI] [PMC free article] [PubMed] [Google Scholar]
- Somerville NJ, O'Donnell J, Gladden RM, Zibbell JE, Green TC, Younkin M, Walley AY. Characteristics of Fentanyl Overdose - Massachusetts, 2014–2016. MMWR Morb Mortal Wkly Rep. 2017;66(14):382–386. doi: 10.15585/mmwr.mm6614a2. [DOI] [PMC free article] [PubMed] [Google Scholar]
- StataCorp. Stata Statistical Software: Release 14. StataCorp LP; 2015. [Google Scholar]
- U.S. Drug Enforcement Administration Diversion Control Division. NFLIS Brief: Fentanyl, 2001–2015. 2017. Retrieved from Springfield, VA: [Google Scholar]
- Unick G, Rosenblum D, Mars S, Ciccarone D. The relationship between US heroin market dynamics and heroin-related overdose, 1992–2008. Addiction. 2014;109(11):1889–1898. doi: 10.1111/add.12664. [DOI] [PMC free article] [PubMed] [Google Scholar]
- Unick GJ, Rosenblum D, Mars S, Ciccarone D. Intertwined epidemics: national demographic trends in hospitalizations for heroin- and opioid-related overdoses, 1993–2009. PLoS One. 2013;8(2):e54496. doi: 10.1371/journal.pone.0054496. [DOI] [PMC free article] [PubMed] [Google Scholar]


