Abstract.
Changes in arterial wall perfusion mark the onset of atherosclerosis. A characteristic change is the increased spatial density of vasa vasorum (VV), the microvessels in the arterial walls. Measuring this increased VV (IVV) density using contrast-enhanced computed tomography (CT) has had limited success due to blooming effects from contrast media. If the system point-spread function (PSF) is known, then the blooming effect can be modeled as a convolution between the true signal and the PSF. We report the application of image deconvolution to improve the CT number accuracy in the arterial wall of a phantom and in a porcine model of IVV density, both scanned using a whole-body research photon-counting CT scanner. A 3D-printed carotid phantom filled with three concentrations of iodinated contrast material was scanned to assess blooming and its effect on wall CT number accuracy. The results showed a reduction in blooming effects following image deconvolution, and, consequently, a better delineation between lumen and wall was achieved. Results from the animal experiment showed improved CT number difference between the carotid with IVV density and the normal carotid artery after deconvolution, enabling the detection of VV proliferation, which may serve as an early indicator of atherosclerosis.
Keywords: vasa vasorum, atherosclerosis, photon-counting computed tomography, contrast media, point spread function, blooming
1. Introduction
Vasa vasorum (VV), the microvessels that supply blood and nutrients to the arterial wall, undergo marked changes preceding atherosclerosis.1 An increase in the spatial density of VV affects the arterial wall perfusion, indicating the onset of atherosclerosis.2 During contrast-enhanced computed tomography (CT), a small fraction of the injected contrast media enters the VV, resulting in a CT number enhancement of the artery wall. This CT number enhancement is proportional to the spatial density of the VV in the artery’s wall. However, detection of this spatial enhancement using CT is limited due to inherent partial volume averaging caused by larger detector pixel sizes, and blooming effects from the contrast media in lumen of the main artery that obscures the small enhancement in the arterial wall. Blooming effects are primarily caused by the limited spatial resolution of the imaging system and are more pronounced when imaging hyperdense materials, such as calcifications3 and contrast media. During contrast-enhanced CT examinations, blooming causes overestimation of the CT numbers in the visualized arterial walls,4 thereby making quantitative assessment of wall opacification difficult.
Assuming a linear imaging system, the blooming effect can be formulated as a convolution process between the true signal and the system’s point-spread function (PSF),3,5 which can be measured using a spatial resolution phantom. Then, a deconvolution framework can be formulated to reverse the adverse effects of blooming based on the measured PSF. Previously, others have adopted this deconvolution approach to reduce calcium blooming from vascular calcifications,3,5 iterative deblurring for CT metal artifact reduction,6 and improving stent delineation in cardiac CT images.7 The purpose of this study was to enable accurate assessment of the CT numbers in an arterial wall by reducing blooming effects from contrast media in the lumen using image deconvolution and to demonstrate the feasibility of detecting increased VV (IVV) density in the carotid artery using a large animal model and a whole-body photon-counting CT (PCCT) system.
2. Materials and Methods
We used a prototype whole-body PCCT scanner8,9 (Siemens Healthcare, Forchheim, Germany) in this study. This PCCT system has been shown to provide clinically acceptable image quality at clinical dose levels and dose rates and to exhibit a better contrast-to-noise ratio for iodinated contrast agents compared with conventional CT.10 The PCCT scanner is comprised of two subsystems, one with a conventional energy-integrating detector (EID) and a second with a cadmium telluride photon-counting detector (PCD). The in-plane field of view (FOV) is 50 cm for the EID subsystem and 27.5 cm for the PCD subsystem. The limited FOV for the PCD subsystem causes data truncation while scanning larger objects ( at the isocenter). To correct this data truncation, an additional low-dose data completion scan with the EID subsystem is required.11 At the time of this study, two data acquisition modes were available in the PCCT scanner, namely macro mode and chess mode. In our study, the PCCT scanner was operated in macro mode with two energy thresholds and a 0.5-mm detector size at the isocenter.
2.1. Image Deconvolution
Given the blurring function of an imaging system, image deconvolution can be formulated as a minimization problem12 given by
| (1) |
where is the true signal (to be recovered), is the point spread function of the imaging system, is the observed signal (reconstructed CT image with blooming), is the regularization weight, is the CT image voxel index, is a penalty function, and is a first order derivative filter ( and ). The output of the derivative filters is generally sparse and renders the optimization problem nonconvex and computationally slow. To solve this, an alternating minimization approach using variable splitting can be used. Using half-quadratic splitting,12 the above problem can be reformulated as
| (2) |
where is the optimization weight, and are the auxiliary variables, and . For a fixed , Eq. (2) can be minimized iteratively by alternating and solving for given , and given . Methods to solve this alternating subproblem optimization can be found elsewhere.12,13 We used a Laplacian model of the image gradients, where the exponent α = 1, and λ = 100 and β = 29 were empirically determined to best retain the geometric accuracy in the images and have little to no edge overshoot at the object boundaries in the CT images.
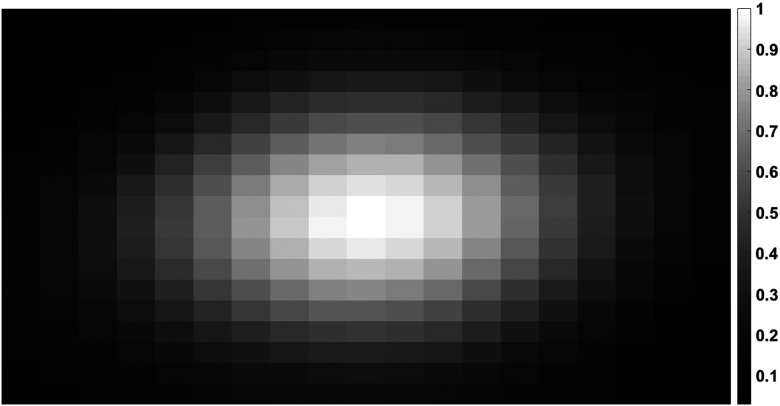
The convolution kernel , i.e., the PSF used in image deconvolution, was measured using a wire phantom made from a diameter steel wire. The wire phantom was positioned at the scanner isocenter, aligned parallel to the longitudinal direction, and scanned in macro mode at 140 kV with energy thresholds of 30 and 65 keV. Axial images reconstructed with a medium smooth (D30) quantitative kernel were used to measure the PSF with a voxel size of (see Fig. 1). D30 is typically used in carotid CT angiography to provide a balance between spatial resolution and image noise. The two-dimensional image deconvolution was applied to axial images from the phantom scans and axial images from two of the four scan locations from the animal scans.
Fig. 1.
PSF kernel (2-D) used in image deconvolution obtained using a 127 μm thin-wire phantom. The axial image was reconstructed using FBP with a smooth kernel (D30). The PCCT image corresponds to an energy range of 30 to 140 keV. Display window range (0, 1) normalized for display purpose.
2.2. Phantom Experiment
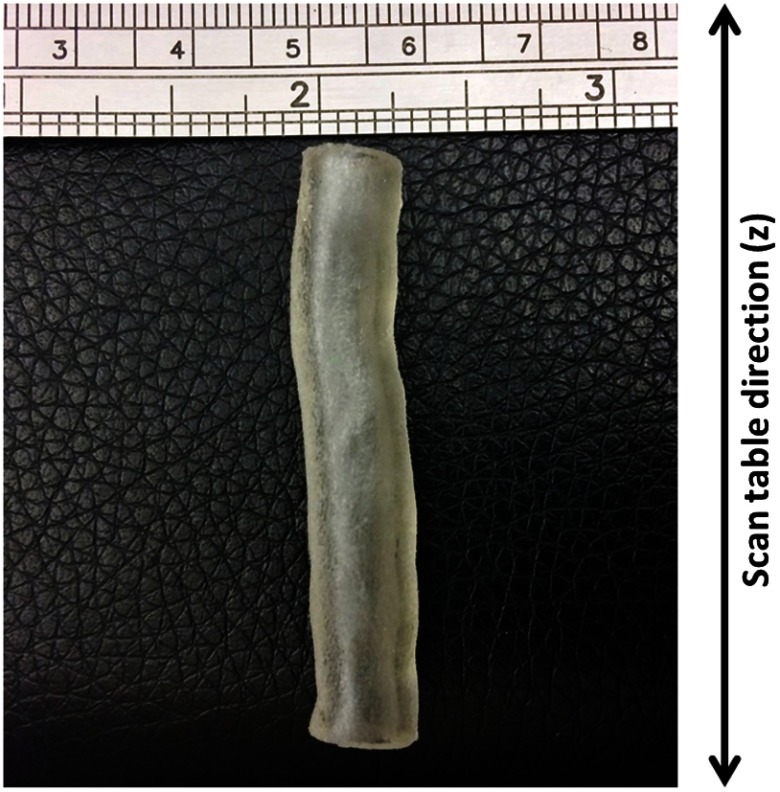
A three-dimensional (3-D) carotid artery voxel model was obtained from CT angiographic images of a patient. This model was 3-D printed using a polymer base material. The 3-D-printed artery (Fig. 2) had a 5-mm lumen diameter and a 2-mm thick wall (dimensions are approximate). Four sequential scans were performed: (1) the lumen filled with water and (2 to 4) the lumen filled with diluted iodinated contrast agent (Omnipaque, GE Healthcare, Princeton, New Jersey) at 10, 20, and , respectively. The carotid phantom was placed in a 20-cm water phantom to mimic the attenuation of the human neck, and was aligned parallel to the table direction. PCCT scans were performed at 120 kV and 340 mAs with energy thresholds set at 25 and 52 keV in the macro mode. Since the phantom was smaller than the PCD’s in-plane FOV, a data completion scan was not required. Images were reconstructed using a weighted filtered back projection14 with a medium-smooth, quantitative D30 kernel. The PCCT images corresponding to an energy range from 25 to 120 keV were used with the deconvolution process to assess the reduction in blooming effects.
Fig. 2.
Photograph of the 3-D-printed carotid phantom used in the phantom experiments. The basic model was generated using CT angiographic images from a patient. The lumen is in diameter, and the wall is thick.
To assess CT number changes in the phantom wall, the lumen boundary was identified using the half maximum CT number value from the contrast-enhanced lumen region, and a binary mask was created. The lumen contour was traced using the generated mask and a contour tracing scheme.15 An annular region of interest (ROI) was placed to encompass the wall using the lumen contour as a reference, thereby allowing the ROI to follow the shape of the lumen boundary. Multiple annular ROIs were placed at different radial distances away from the lumen boundary and the mean CT number of each annular ROI was recorded at different radial distances from the lumen boundary to assess contamination from blooming effects as a function of distance from the lumen. The mean CT number from the noncontrast image (lumen filled with water) served as the ground truth for the expected wall CT number without blooming effects.
2.3. Animal Experiment
A porcine model of altered VV density originally developed in rabbits was used in our study.4,16 The study was approved by our Institutional Animal Care and Use Committee (Mayo Clinic, Rochester, Minnesota). The left carotid artery (referred to as the IVV artery hereafter) was injured to increase the VV density, whereas the right carotid artery was used as the control, with normal VV density. To perform the wall injury, the animal was anesthetized (Telazol/ketamine/xylazine) and a midline incision was performed to expose the carotid arteries. A 0.1 mL aliquot of autologous blood was injected into the left arterial wall at six sequential locations between the bifurcation and a caudal location proximal to the bifurcation. The right artery (control) was exposed but not injected. The animal was allowed to recover from the anesthesia following the closure of the incision. After six weeks, the animal was reanesthetized for the PCCT scans. A low-dose, noncontrast data completion scan (120 kV, 150 mAs) scan was first performed covering the exposed regions of the arteries. Sequential time-resolved scans were performed at four locations (referred to numerically, e.g., location 1) caudal to the bifurcation using 120 kV tube voltage and two macro mode energy thresholds set at 25 and 52 keV. To achieve low-noise PCCT images, a tube current of 550 mAs was used. A 60 mL contrast bolus (Omnipaque 350, GE Healthcare, Inc.) was injected into the femoral vein at synchronously with the start of data acquisition at each scan location, followed by a 30 mL saline chaser. The scan was repeated every 2 s for a period of 1 min, resulting in 20 time points per location. The procedure was repeated for each of the four locations.
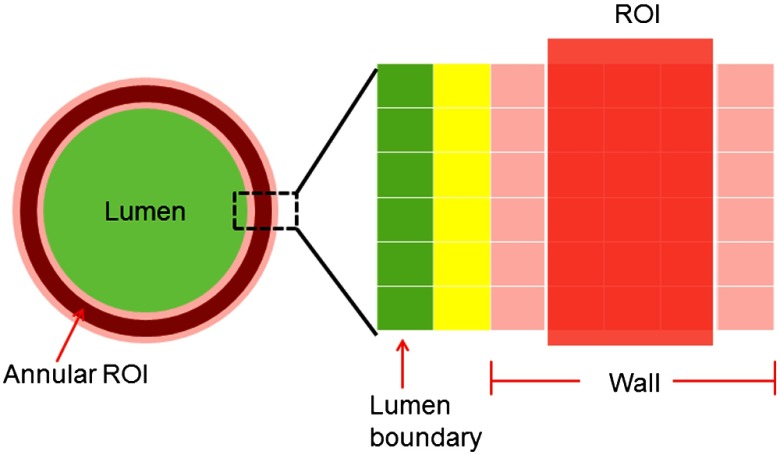
The mean CT numbers in the wall of both arteries (IVV and control) were measured using a semiautomated routine that segmented the wall from the lumen using CT number thresholding and placed annular ROIs in the wall. First, small image patches () over the left and right carotids were extracted from a single axial image. The half-maximum value of the lumen CT number was used as a threshold to approximate the location of the lumen boundary. Binary masks of the lumen were created separately for the IVV artery and the control artery images. This lumen mask was extended to all time points of the multiphase study. ROI placement was performed using the lumen contour as the reference, as described in Sec. 2.2. In this case, the ROI location was defined using a specified distance from the lumen boundary and the annular thickness of the ROI. This process is shown in Fig. 3.
Fig. 3.
Illustration of ROI selection and placement for the carotid arteries used in our study. The annular ROI was defined by its thickness and its distance from the lumen boundary. In this illustration, the annular ROI is three pixels thick and is placed two pixels away from the lumen boundary. The mean CT number in this annular ROI was used to measure the wall perfusion. The lumen–wall interface (marked in yellow), which was likely influenced by partial volume averaging, was excluded from our analysis.
Typically, the carotid wall thickness is about 30% of the radius of the lumen1,4 (e.g., if the lumen is 3 mm in radius, then the wall thickness is ). The axial images used in this study were reconstructed using a small voxel size (), so 6 to 9 voxels were required to cross the artery wall. A three-pixel-thick annular ROI (see Fig. 2) was placed two pixels away from the identified lumen boundary to avoid partial-volume averaging from the lumen–wall interface. The segmentation and ROI placement steps were performed independently on the control and IVV images, before and after deconvolution. Image analysis was performed on representative slices from locations 1 and 2 caudal to the carotid bifurcation due to its proximity to the injected site.
3. Results
3.1. Phantom Experiment
The results of image deconvolution applied to the carotid artery phantom images are shown in Fig. 4. Blooming effects were reduced after deconvolution, as confirmed by the line profile that shows sharper delineation between the lumen and wall in the carotid phantom after deconvolution.
Fig. 4.
PCCT images of 3-D printed carotid phantom before and after image deconvolution. Lumen filled with (a) water, (b) of iodine, (c) of iodine, and (d) of iodine. The line profile was obtained from the images in (d) in the region marked in black. A sharper delineation between the lumen and wall can be seen after deconvolution. The left images in (a)–(d) correspond to the original image, and the right images correspond to deconvolved images. Display window [, 150] HU for (a), [, 200] HU for (b), and [, 300] HU for (c) and (d). .
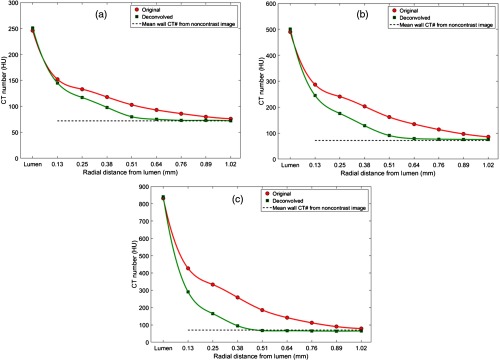
The reduction in blooming and the subsequent effect on the wall CT number were quantified using the changes in CT number traveling radially outward from the lumen boundary, as shown in Fig. 5. After deconvolution, the CT number remained constant at radial distances into the wall of the phantom, while the original images showed relatively higher CT numbers in the wall region due to blooming effects from the lumen, even when the ROI was placed in the homogeneous (polymer) wall region.
Fig. 5.
Mean CT number from the phantom wall for a one pixel-thick annular region of interest radially drawn at one-pixel intervals from the lumen boundary before and after deconvolution. The data point marked “lumen” in the -axis of the plots corresponds to the mean CT number of the contrast-filled lumen. The measurements were obtained from PCCT image at 25 to 120 keV with iodine concentrations of (a) , (b) , and (c) in the lumen compared against the mean wall CT number (71 HU, dotted black line) obtained from the original noncontrast image [Fig. 4(a)].
3.2. Animal Experiment
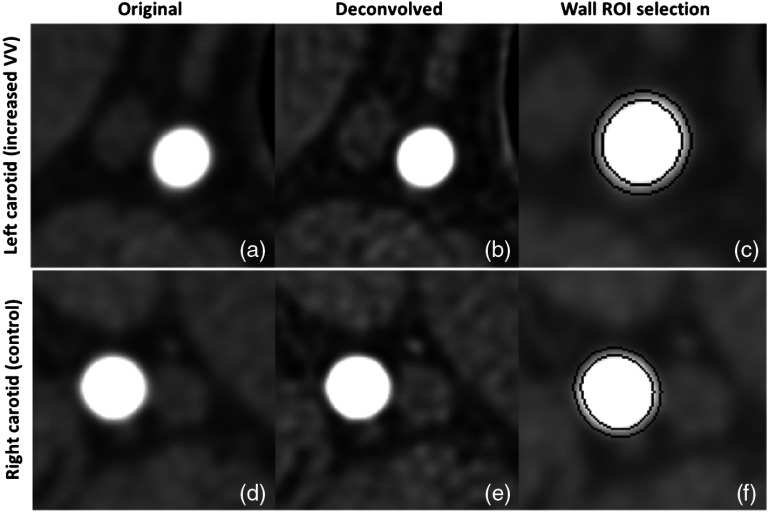
Figure 6 shows the results of deconvolution applied to images of the IVV and control arteries, with the corresponding annular ROI masks for CT number measurements. A visible reduction in blooming and better structural delineation can be seen after deconvolution in both cases. The mean CT numbers between the two concentric rings [Figs. 6(c) and 6(f)] were used to assess the density of VV.
Fig. 6.
Image deconvolution applied to IVV artery and control artery PCCT images at [25 to 120] keV. (a) and (d) Original IVV and control artery images with severe blooming (display window [,400] HU), (b) and (e) corresponding deconvolved images with reduced blooming effect. Note the improved image sharpness as a result of deconvolution (display window [,400] HU), and (c) and (f) ROI placements to measure wall CT number. The mean CT number of voxels between the two black concentric rings (three-pixel thick region) was used to quantify the wall perfusion (display window [, 450] HU).
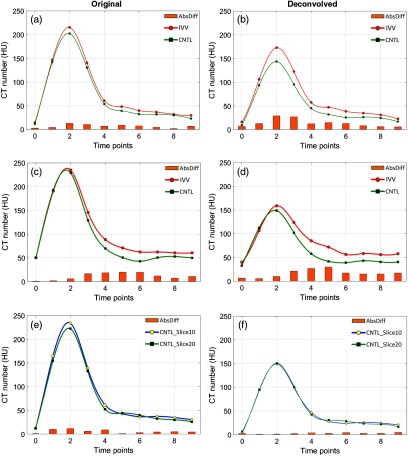
Figure 7 shows the plots corresponding to the CT number measurements at the arterial wall sites (IVV and control) before and after deconvolution. The CT number difference was enhanced between the IVV (Fig. 7) and control (CNTL in Fig. 7) artery slices. The maximum CT number difference was noted at (6 s after contrast injection) for location 1 [Figs. 7(a) and 7(b)] and at (16 s after contrast injection) for location 2 [Figs. 7(c) and 7(d)]. After deconvolution, the CT number difference between the control and IVV arterial walls was enhanced at all the time points, demonstrating a relative increase in the arterial wall perfusion of the IVV artery. To ensure that the difference noticed between the two arteries was indeed due to the difference in spatial density of VV, two images from the control artery (location-2) were also compared [Figs. 7(e) and 7(f)], and these showed similar CT numbers in the artery wall. In this case, image deconvolution improved the CT number consistency between the two slices corresponding to the control artery [overlapping CT number profiles, Fig. 7(f)]. Also, note the peak CT number for the control plots remained consistent after deconvolution (Figs. 7(b), 7(d), and 7(f)).
Fig. 7.
Wall CT number measurements for representative slices from locations 1 and 2 of the pig scan. (a) and (b) Wall CT number plots for CNTL (normal control artery) and IVV (increased VV) arteries from location 1 before and after deconvolution, respectively. (c) and (d) Wall CT number plots for the two arteries from location 2 before and after deconvolution respectively. (e) and (f) Wall CT number plot for two different slices from the control artery (CNTL) in location 2. Notice the increased CT number difference after deconvolution (b) and (d) between IVV and CNTL and the restored CT number consistency after deconvolution between two slices from the control artery (f). The peak CT number of the CNTL curves in B, D, and F remained consistent after deconvolution
4. Discussion
The key outcomes of this study are twofold. First, a reduction in blooming effects from contrast media by employing a CT image deconvolution technique was demonstrated in PCCT images from phantom and animal experiments. By modeling the blooming effect as a convolution process between the measured CT image and the system PSF, we were able to achieve a reduction in blooming effects in PCCT images, and more importantly, improve the CT number accuracy. Second, image deconvolution of PCCT images can improve the measurement of changes in arterial wall perfusion, which reflect the spatial density of VV. We demonstrated that image deconvolution can improve the arterial wall CT number measurements in an animal model with induced proliferation of VV in the carotid artery. Existing literature relevant to CT image deconvolution mainly focuses on calcium deblooming for vascular calcifications, where the primary aim is restoring the morphology of the calcifications to avoid an overestimation of luminal narrowing. In our study, we focused on the CT number accuracy in the vicinity (artery wall) of bloom-inducing regions (contrast-media from lumen) to extract information pertaining to atherosclerosis from the artery wall. VV is known to play an important role in the development of atherosclerosis1,4 and, hence, was our main interest in this study.
Our implementation of image deconvolution was limited to the axial plane (2-D). However a 3-D extension is possible when imaging arteries such as the coronaries that are oblique to the axial plane. The proposed methods for measuring arterial wall perfusion using deconvolution is not specific to PCCT, and can be applied to conventional CT images. However, PCCT is evolving as a promising imaging modality with better electronic noise handling capabilities,17 improved iodine contrast-to-noise ratio (CNR) and soft tissue signal-to-noise ratio, high resolution imaging enabled by smaller detector sizes,18,19 and reduced radiation doses.20,21 We used a PCCT system due to its ability to provide improved CNR that could help detect the subtle CT number enhancements of the wall due to vasa vasorum proliferation. Other image enhancing techniques such as the use of sharp reconstruction kernels may lead to undesirable effects such as over-emphasized edges and boundaries. Sharp kernels emphasize the high frequency components of the image, consequently resulting in increased image noise. An iterative reconstruction technique (for example, a model-based iterative reconstruction) would be required to reduce image noise while retaining quantitative accuracy.
Our study using the whole-body research PCCT system described in this paper is a proof of principle and has the following limitations: first, the spectral information from the imaging modality was not fully utilized. PCCT produces multienergy images that can be used to discriminate materials and quantify their densities using the energy-specificity of x-ray attenuation.22 Nonetheless, blooming effects and other artifacts are likely to influence the accuracy of material decomposition techniques, and image deconvolution could be applied to multienergy images prior to material decomposition. Secondly, additional statistical analysis may be required to confirm the predictive value of CT arterial wall perfusion enabled by image deconvolution. Also, high-resolution imaging modes18,19 have been recently introduced in the PCCT system described in this study. This capability can inherently reduce blooming effects and partial volume averaging, and improve the CT number accuracy of artery walls. However, high-resolution images generated by smaller detector pixels are prone to increased image noise, and wall perfusion measurements may require additional CT image denoising23,24 or the use of iterative reconstruction.
5. Conclusions
A reduction in blooming artifacts from iodinated contrast media was achieved using image deconvolution, and subsequent improvements in CT number accuracy of the arterial wall in phantom and animal experiments involving a whole-body research PCCT was reported. CT number constancy of the arterial wall in a 3-D-printed phantom was demonstrated, and the CT number difference between a normal carotid artery and a carotid with induced proliferation of the VV in a porcine model was enhanced, allowing detection of the IVV.
Acknowledgments
Research reported in this paper was supported by the National Institutes of Health under Award Nos. C06 RR018898 and R01 EB016966. The authors would like to thank Mark Korinek, Mayo Clinic, Rochester, Minnesota, for his support in this study.
Biographies
Kishore Rajendran received his BE degree in biomedical engineering in 2009 from Anna University, his MS degree in medical electronics in 2011 from Coventry University, and his PhD in radiology in 2016 from the University of Otago. Currently, he is a research fellow in the Department of Radiology at Mayo Clinic, Rochester, Minnesota. His current research focuses on photon-counting CT for early detection of vascular diseases, CT image reconstruction, and CT noise reduction.
Shuai Leng received his BS degree in engineering physics in 2001, his MS degree in engineering physics in 2003 from Tsinghua University, and his PhD degree in medical physics in 2008 from the University of Wisconsin, Madison. He is an associate professor of medical physics at the Mayo Clinic in Rochester, Minnesota. He has authored over 100 peer-reviewed articles. His research interest is technical development and clinical application of x-ray and CT imaging.
Steven M. Jorgensen is an associate in research and is currently the micro-CT system lead engineer in the Physiological Image Research Lab at the Mayo Clinic College of Medicine, Rochester, Minnesota. He obtained his BSEE from South Dakota School of Mines and Technology in 1979. His projects include working with whole-body spectral x-ray imaging with the Mayo’s Computed Tomography Clinical Innovation Center and spectral micro-CT x-ray imaging in the x-ray imaging core.
Jill L. Anderson is currently a supervisor of the Neural Engineering Lab, Woodrum Interventional Radiology Lab, x-ray imaging core and is manager overall of the XRI core at the Mayo Clinic, Rochester, Minnesota. She obtained her animal health technology degree in 1980 at the University of MN-Technical College in Waseca, MN, and her MN Certified Vet Tech license in 1984. She also has a BA management and communication degree from Concordia College in 2000.
Ahmed F. Halaweish received his BS degree in electrical engineering in 2005 from South Dakota State University and his PhD in biomedical engineering from the University of Iowa in 2011. He completed a postdoctoral research fellowship at Duke University School of Medicine in 2013. He is currently a staff scientist and R&D collaborations manager for the Computed Tomography Division of Siemens Healthineers. His research interests include preclinical and clinical multimodality CT and MR imaging.
Dilbar Abdurakhimova received her bachelor’s degree from Bemidji State University in 2013 and her master’s degree from Minnesota State University in Mathematics in 2015. Her main research interests include CT image reconstruction.
Erik L. Ritman developed, evaluated, and used whole body CT imaging of the cardiovascular system. He was a principal investigator of an NIH grant that developed the first multislice high speed CT scanner in the late 1970s. In the early 1990s, he developed and used micro-CT of tissue specimens and small animals to study the microcirculation. He is coprincipal investigator of an NIH grant to evaluate a photon counting spectral CT scanner.
Cynthia H. McCollough is a professor of radiological physics and biomedical engineering at Mayo Clinic, where she directs the CT Clinical Innovation Center. Her research interests include CT dosimetry, advanced CT technology, and new clinical applications, such as dual-energy and multispectral CT. She is an NIH-funded investigator, and is active in numerous professional organizations. She is a fellow of the AAPM and ACR. She received her doctorate from the University of Wisconsin in 1991.
Disclosures
The content is solely the responsibility of the authors and does not necessarily represent the official views of the National Institutes of Health. The equipment used in this work is based on a research device and is not commercially available.
References
- 1.Ritman E. L., Lerman A., “The dynamic vasa vasorum,” Cardiovasc. Res. 75(4), 649–658 (2007). 10.1016/j.cardiores.2007.06.020 [DOI] [PMC free article] [PubMed] [Google Scholar]
- 2.Gossl M., et al. , “Increased spatial vasa vasorum density in the proximal LAD in hypercholesterolemia—implications for vulnerable plaque-development,” Atherosclerosis 192(2), 246–252 (2007). 10.1016/j.atherosclerosis.2006.07.004 [DOI] [PubMed] [Google Scholar]
- 3.Liang Z., et al. , “Calcium de-blooming in coronary CT image,” in IEEE 7th Int. Symp. on BioInformatics and BioEngineering, pp. 257–262 (2007). 10.1109/BIBE.2007.4375574 [DOI] [Google Scholar]
- 4.Jorgensen S. M., et al. , “Arterial wall perfusion measured with photon counting spectral x-ray CT,” Proc. SPIE 9967, 99670B (2016). 10.1117/12.2238817 [DOI] [PMC free article] [PubMed] [Google Scholar]
- 5.Hofmann C., Knaup M., Kachelrieß M., “Removing blooming artifacts with binarized deconvolution in cardiac CT,” Proc. SPIE 9033, 90330J (2014). 10.1117/12.2036559 [DOI] [Google Scholar]
- 6.Wang G., et al. , “Iterative deblurring for CT metal artifact reduction,” IEEE Trans. Med. Imaging 15(5), 657–664 (1996). 10.1109/42.538943 [DOI] [PubMed] [Google Scholar]
- 7.Castillo-Amor A. M., et al. , “Reduction of blooming artifacts in cardiac CT images by blind deconvolution and anisotropic diffusion filtering,” in 11th Int. Symp. on Medical Information Processing and Analysis (SIPAIM 2015), p. 96810P (2015). [Google Scholar]
- 8.Yu Z., et al. , “Evaluation of conventional imaging performance in a research whole-body CT system with a photon-counting detector array,” Phys. Med. Biol. 61(4), 1572–1595 (2016). 10.1088/0031-9155/61/4/1572 [DOI] [PMC free article] [PubMed] [Google Scholar]
- 9.Kappler S., et al. , “Multi-energy performance of a research prototype CT scanner with small-pixel counting detector,” Proc. SPIE 8668, 86680O (2013). 10.1117/12.2006747 [DOI] [Google Scholar]
- 10.Gutjahr R., et al. , “Human imaging with photon counting-based computed tomography at clinical dose levels: contrast-to-noise ratio and cadaver studies,” Invest. Radiol. 51(7), 421–429 (2016). 10.1097/RLI.0000000000000251 [DOI] [PMC free article] [PubMed] [Google Scholar]
- 11.Yu Z., et al. , “How low can we go in radiation dose for the data-completion scan on a research whole-body photon-counting computed tomography system,” J. Comput. Assisted Tomogr. 40(4), 663–670 (2016). 10.1097/RCT.0000000000000412 [DOI] [PMC free article] [PubMed] [Google Scholar]
- 12.Krishnan D., Fergus R., “Fast image deconvolution using hyper-Laplacian priors,” in Neural Information Processing Systems, pp. 1033–1041 (2009). [Google Scholar]
- 13.Wang Y., et al. , “A new alternating minimization algorithm for total variation image reconstruction,” SIAM J. Imag. Sci. 1(3), 248–272 (2008). 10.1137/080724265 [DOI] [Google Scholar]
- 14.Stierstorfer K., et al. , “Weighted FBP—a simple approximate 3D FBP algorithm for multislice spiral CT with good dose usage for arbitrary pitch,” Phys. Med. Biol. 49(11), 2209–2218 (2004). 10.1088/0031-9155/49/11/007 [DOI] [PubMed] [Google Scholar]
- 15.Haralick R. M., Shapiro L. G., Computer and Robot Vision, Addison-Wesley, Reading, Massachusetts: (1992). [Google Scholar]
- 16.Lee S. C., et al. , “Temporal characterization of the functional density of the vasa vasorum by contrast-enhanced ultrasonography maximum intensity projection imaging,” JACC Cardiovasc. Imaging 3(12), 1265–1272 (2010). 10.1016/j.jcmg.2010.08.017 [DOI] [PMC free article] [PubMed] [Google Scholar]
- 17.Yu Z., et al. , “Noise performance of low-dose CT: comparison between an energy integrating detector and a photon counting detector using a whole-body research photon counting CT scanner,” J. Med. Imaging 3(4), 043503 (2016). 10.1117/1.JMI.3.4.043503 [DOI] [PMC free article] [PubMed] [Google Scholar]
- 18.Leng S., et al. , “A high-resolution imaging technique using a whole-body, research photon counting detector CT system,” Proc. SPIE 9783, 97831I (2016). 10.1117/12.2217180 [DOI] [PMC free article] [PubMed] [Google Scholar]
- 19.Leng S., et al. , “Dose-efficient ultrahigh-resolution scan mode using a photon counting detector computed tomography system,” J. Med. Imaging 3(4), 043504 (2016). 10.1117/1.JMI.3.4.043504 [DOI] [PMC free article] [PubMed] [Google Scholar]
- 20.Rolf S., et al. , “Low-dose lung cancer screening with photon-counting CT: a feasibility study,” Phys. Med. Biol. 62(1), 202 (2017). 10.1117/1.JMI.3.4.043504 [DOI] [PMC free article] [PubMed] [Google Scholar]
- 21.Kalender W. A., et al. , “Technical feasibility proof for high-resolution low-dose photon-counting CT of the breast,” Eur. Radiol. 27(3), 1801–1086 (2017). 10.1007/s00330-016-4459-3 [DOI] [PubMed] [Google Scholar]
- 22.Polster C., et al. , “Improving material decomposition by spectral optimization of photon counting computed tomography,” Proc. SPIE 9783, 97831O (2016). 10.1117/12.2216711 [DOI] [Google Scholar]
- 23.Li Z., et al. , “Adaptive nonlocal means filtering based on local noise level for CT denoising,” Med. Phys. 41(1), 011908 (2014). 10.1118/1.4851635 [DOI] [PubMed] [Google Scholar]
- 24.Yu Z., et al. , “Spectral prior image constrained compressed sensing (spectral PICCS) for photon-counting computed tomography,” Phys. Med. Biol. 61(18), 6707–6732 (2016). 10.1088/0031-9155/61/18/6707 [DOI] [PMC free article] [PubMed] [Google Scholar]


