Abstract
We report measured line intensities and temperature-dependent broadening coefficients of NH3 with Ar, N2, O2, CO2, H2O, and NH3 for nine sQ(J,K) transitions in the ν2 fundamental band in the frequency range 961.5–967.5 cm−1. This spectral region was chosen due to the strong NH3 absorption strength and lack of spectral interference from H2O and CO2 for laser-based sensing applications. Spectroscopic parameters were determined by multi-line fitting using Voigt lineshapes of absorption spectra measured with two quantum cascade lasers in thermodynamically-controlled optical cells. The temperature dependence of broadening was measured over a range of temperatures between 300 and 600 K. These measurements aid the development of mid-infrared NH3 sensors for a broad range of gas mixtures and at elevated temperatures.
Keywords: Ammonia, Spectroscopy, Mid-infrared, Quantum cascade laser, Line intensity, Broadening
1. Introduction
Spectroscopic sensors for gaseous ammonia are important for a number of applications, ranging from environmental monitoring [1,2], industrial process control [2], clinical analysis of human breath [3–6], and the recycling of bio-waste water [7]. Trace detection at ppb to ppm levels is often required [7–10]. Laser absorption techniques have been implemented in various forms for trace NH3 detection, e.g., rapid-scan direct absorption [11,12], wavelength-modulation spectroscopy (WMS) [4,13], frequency-modulation spectroscopy (FMS) [14], cavity ring-down spectroscopy [6,15], and photoacoustic spectroscopy (PAS) [3,9,16], all using different types of near-infrared or mid-infrared distributed-feedback (DFB) lasers [9,11,13,14,17], vertical cavity surface-emitting lasers (VCSEL) [12], or quantum cascade lasers (QCL) [4,6,15]. The appropriate wavelength for spectroscopic detection generally depends on relative spectral strength and isolation from other components in the gas mixture.
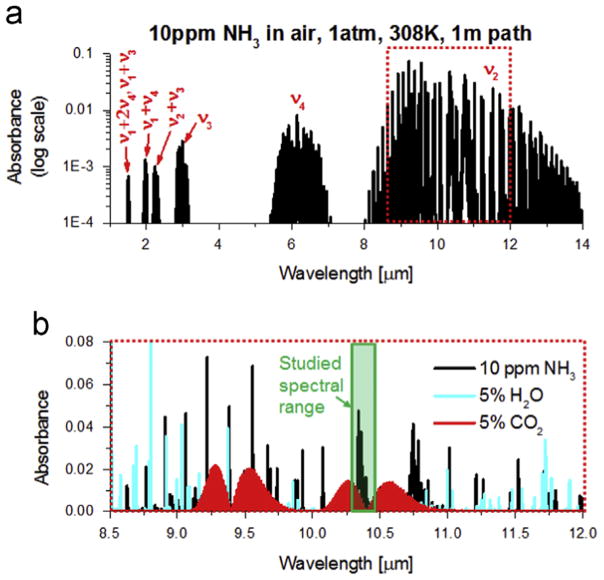
Fig. 1(a) shows the simulated rovibrational absorption spectrum of 10 ppm NH3 in air at 308 K (typical human breath temperature, 35 °C), 1 atm for an optical path length of 1 m. Ammonia (NH3) has six vibrational modes – symmetric stretch (ν1), symmetric bend (ν2), doubly-degenerate asymmetric stretch (ν3), and doubly-degenerate asymmetric bend (ν4). Moreover, ammonia is a symmetric top molecule with two rotational quantum numbers, J and K, where J represents the total angular momentum and K represents the angular momentum about the primary axis of symmetry. The near-infrared wavelength range of 1–2.5 μm, composed of combination bands and overtones, is the most widely used spectral region for detection of ammonia, primarily for atmospheric sensing and combustion slip measurements [11,14]. However, as can be seen from Fig. 1(a), the NH3 ν2 fundamental absorption band is the strongest of all the IR bands with nearly 50–100X larger absorption strength than the NIR bands, and provides a possibility for more sensitive detection. The recent availability of compact and coherent light sources in the mid-infrared has led to the development of highly sensitive and low-interference diagnostics for ammonia utilizing NH3 transitions near 965.35 cm−1[1], 967.35 cm−1 [5,6,18,19], 1046.4 cm−1 [3,16] and 1103.4 cm−1 [4,20], with applications in the atmosphere and exhaled human breath. For laser absorption measurements to be accurate and calibration-free, a comprehensive characterization of the fundamental spectroscopy is required in the wavelength domain of interest.
Fig. 1.
(a) Simulation of NH3 bands in the infrared at 308 K (35 °C) from HITRAN’12, (b) Close-up of the region studied in relation to the interfering species in this region.
Several studies on ammonia spectroscopy have been reported in the literature. The HITRAN 2000 database lists several NH3 lines as reported by Kleiner et al. [21]. In the ν2 rovibrational band of ammonia, line intensities and broadening parameters due to various different collision partners including NH3, N2, O2, H2, CO2 and H2O were measured with FTIR spectrometers [22–26] and QCL-based spectroscopic techniques [27]. All these studies are restricted to the sP(J,K) and sR(J,K) manifolds. In addition, line intensities and broadening parameters due to multiple collision partners (e.g. self, N2, O2, CO2, H2, Ar and air) have been measured and calculated in the ν4 [28–30] and ν1 [31–33] NH3 rovibrational bands. The effect of water vapor broadening on ammonia transitions near 1.51 μm has also been studied by Schilt [34]. However, the sQ(J,K) manifold of the ν2 band including the lines near 962.17 cm−1, 965.35 cm−1 and 967.35 cm−1 are not well-characterized despite the common selection of these wavelengths for gas sensing [1,5,6,18,19] and a high demand for mid-infrared experimental NH3 data noted in the literature [35,36]. This motivates the current high-resolution spectroscopic study of the Q-branch of the ν2 fundamental rovibrational band of NH3.
As shown by the shaded box in Fig. 1(b), the Q-branch lies in a region with minimal interference from H2O and CO2, the two common interfering species in atmospheric, combustion and clinical breath-sensing applications. Also, as mentioned in the HITRAN 2012 article [35], the spectral parameters were found to deviate very significantly from the values calculated using measured P-branch parameters to predict values in the R manifold. The sQ(J,K) manifold is particularly difficult to study with FTIR spectrometers because of the close proximity of the lines with associated blending effects. The current study uses two narrow-linewidth quantum cascade lasers and an approach similar to Owen et al. [27] at low pressure to obtain accurate values of line intensities and broadening parameters in the sQ(J,K) manifold.
1.1. Theory
Although the fundamental basis of absorption spectroscopy is well known, a short review provides definition of symbols and units used here. The transmission coefficient (τ) of a monochromatic light beam at frequency V is governed by the Beer–Lambert relation:
| (1) |
where I0 is the incident beam intensity, I is the transmitted beam intensity and α is the spectral absorbance for a pressure P, path length L, mole fraction of the absorbing species χ, transition linestrength S and lineshape function ϕ(ν), as defined by the expression
| (2) |
The above expression assumes uniform gas composition and temperature along the laser line of sight. For a single isolated transition, the total area under the absorbance curve is given by:
The lineshape function ϕ(ν) is approximated by a Voigt function ( ) characterized by the collision-broadened full-width at half-maximum (FWHM), ΔνC [cm−1] and the Doppler FWHM, Δνd [cm−1]. ΔνC relates to the transition-specific broadening coefficients (γNH3 –Y) of the absorbing species i.e. NH3 in this case, unique to each collision-partner (Y) as
| (3) |
The dependence of the collision-broadening coefficient on temperature can be modeled as a power law expression:
| (4) |
where γ0,(NH3 –Y) is the broadening coefficient at the reference temperature, T0 (=296 K) and n(NH3 –Y) is the temperature-dependence exponent of NH3 with the collision partner Y. In this article, we report the measured values of S(296 K), γ0,(NH3 –Y) and n(NH3 –Y) for nine transitions in the sQ(J,K) manifold of the ν2 rovibrational band of NH3.
2. Experimental details
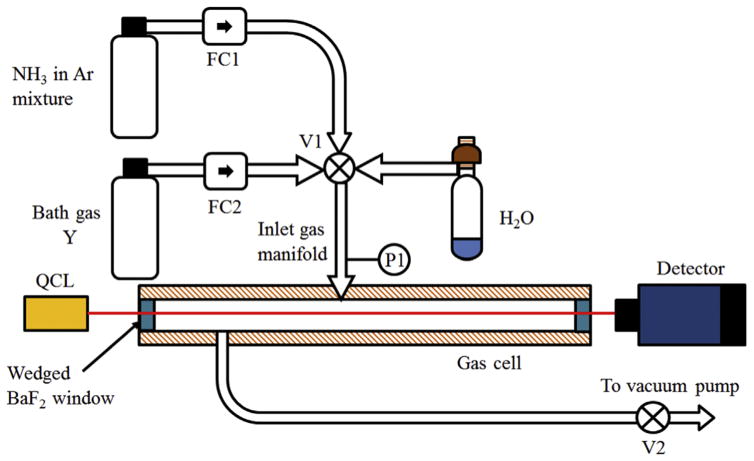
The schematic shown in Fig. 2 illustrates the experimental apparatus used for these experiments. It consisted of a gas cell with two wedged BaF2 windows, inlet gas manifold for mixing the gases, outlet line to the vacuum pump to facilitate a flowing gas configuration, a distributed feedback QCL (swapped with a second QCL for a different wavelength range) and a detector. To enable accurate measurements of the spectral parameters, use of two slightly different setups with different path lengths was optimal as discussed below:
Fig. 2.
Experimental setup for performing spectroscopic measurements of NH3.
i. Line intensity measurements
The experiments for determination of line intensities of NH3 necessitate the analysis of laser absorption through a gas sample with a known concentration of NH3. This was found to be difficult due to the following reasons:
Sticky nature of NH3. Ammonia mixture composition in the cell was found to be inconsistent with the certified bottle concentration due to the surface adsorption of ammonia to the walls. Even with a flow arrangement, the steady-state concentration did not accurately reflect the bottle composition and hence could not be used for line strength measurements.
Possible stratification of NH3 in the mixture. Resultant absorbance was found to be dependent on the flow rate suggesting possible stratification in the mixture composition further magnified due to the adsorption effect.
Therefore, line intensity measurements were performed at 296 K in a short (3.36 mm) cell with flowing 99.99% pure anhydrous NH3 (Praxair) at sub-atmospheric pressure (<35 Torr). Due to the highly toxic nature of pure NH3, these studies were performed inside a fume hood.
ii. Broadening parameter measurements
Measurements of broadening parameters were performed in a heated optical cell of 101 cm path. The cell temperature non-uniformity at the hottest setting of 600 K was found to be less than ±4 K, and progressively less at lower temperatures. In this setup, a differential flow configuration of 1.3% NH3 in Ar (Praxair certified gas mixture) and the pure bath gas (denoted generically as Y) ensured a highly dilute mixture of NH3 with about 96% bath gas Y and 4% Ar. This enabled the creation of desirable final mixture composition with about 4:100 ratio of flow rates, easily accomplished by the flow controllers FC1 and FC2. The sample pressure was controlled using micrometer valves V1 and V2 and measured using MKS 627D capacitance manometers with 100 and 1000 Torr full-scale pressure ranges (uncertainty: 0.12% of reading). Experiments were performed over typical pressure ranges of 0–30 Torr and 0–300 Torr for line intensity and collision broadening parameter measurements, respectively. The dilution was taken into account while processing the broadening data. The flow configuration ensured a constant ammonia concentration in the cell despite the significant adsorption of NH3 on the walls of the optical cell and the connected Teflon/stainless steel tubing.
For water broadening measurements, the gas Y line was replaced by a degassed water flask in a water bath (which maintained the flask temperature to counter the heat loss due to evaporation). At 296 K the vapor pressure of water is 21 Torr, leading to a slow and ambiguous water flow rate. In response, the flow rate of the NH3 – Ar mixture had to be kept to a very low value using a micrometer valve, and the water concentration independently verified. In this configuration, the mixture composition was inferred by simultaneously measuring the mixture water concentration with a near IR TDLAS water sensor utilizing a water transition centered at 7185.6 cm−1. The mixture water mole fraction was found to be about 70% for most cases, and the rest was assumed to be Ar and NH3 for broadening calculation purposes.
The current study of highly resolved spectroscopy of NH3 in the Q-branch was made possible by the availability of narrow linewidth (typically<10 MHz) quantum cascade lasers (QCLs) from Alpes Lasers SA (Neuchâtel, Switzerland; www.alpeslasers.ch/) and Adtech Optics (www.atoptics.com/) at the specified wavelength range of interest. Both QCLs have distributed feedback (DFB) architecture and were collimated in high-heat-load (HHL) packages and mounted on water-cooled aluminum plates for effective temperature control. The water temperature was maintained at approximately 18 °C by a Thermocube water chiller. The two QCLs (Alpes QCL and Adtech QCL) were tunable over the ranges 960.8–965.8 cm−1 and 963.4–968.9 cm−1, respectively, by tuning the laser temperature and injection current. The temperature was regulated using Alpes Lasers TC-3 and Arroyo 5305 temperature controllers, while the current was controlled using a ILX Lightwave LDX 3232 high compliance laser diode driver and an Arroyo 4300 laser source. The laser was scanned over the necessary wavelength range by providing a sawtooth voltage input signal to the current controller by the data acquisition (DAQ) system. The DAQ system consisted of a National Instruments PXIe-6124 card (16-bit analog I/O, up to 2.5 Ms/s) mounted on an external chassis NI PXIe-1073. The output laser beam is collected on a Vigo PVM-2TE-10.6 thermoelectrically cooled multijunction, optically immersed photovoltaic detector. The generated signal voltage from the detector was recorded by the DAQ. The relative laser frequency during the laser scan was determined by recording the scan with a germanium etalon of free spectral range (FSR) of 0.0163 cm−1 placed along the path of the laser.
3. Results and discussions
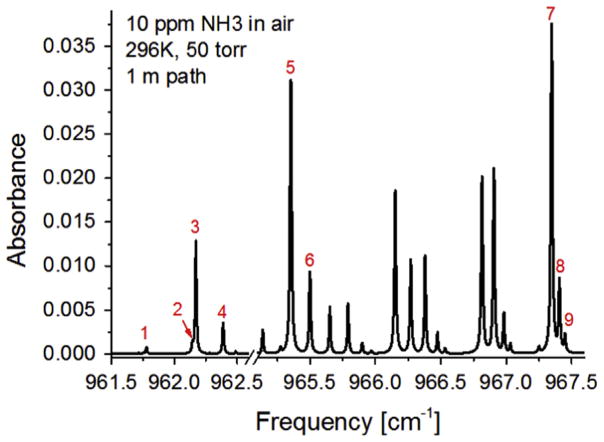
The line intensities and temperature-dependent broadening coefficients of NH3 with Ar, O2, N2, CO2, H2O and NH3 of nine spectral transitions were studied between 961.5 and 967.5 cm−1. These transitions in the Q-branch of the ν2 fundamental band of NH3 near 10.4 μm are designated by numbers 1–9 in Fig. 3 and listed in Table 1. Some of these lines (5 and 7) have previously been used for room temperature sensing [1,5,18,19] as discussed earlier, and line 3 is ideally suited for sensing at elevated temperatures. The remaining lines (1,2,4,6,8,9) can influence the spectral characteristics of the three primary lines (3,5,7) at elevated pressures, and require characterization for quantitative sensing over a broad range of conditions. In contrast to their utility, none of these lines have been studied experimentally with regards to their fundamental spectroscopic parameters, and previous sensing applications have relied on calibration methods. The HITRAN database provides computed spectroscopic parameters based on models anchored to data in the R and P branches of the ν2 band [25,36]. The results of this study aim to provide improved certainty in parameters found in the HITRAN database (S, γself, γair) and to provide additional parameters for broadening and its temperature dependence for other collision partners (CO2, H2O, Ar) common to many important gas mixtures (e.g. atmosphere, breath, combustion exhaust). An attempt was made to characterize the pressure shift, however, due to the slow drift in the laser output frequency, the absolute frequency of the spectral features could not be resolved with a high degree of confidence and hence these values are not reported here.
Fig. 3.
Simulated absorption spectrum of 10 ppm NH3 in air using spectral parameters from HITRAN’12 at 296 K and 50 Torr over a 100 cm absorption path length indicating the studied transitions.
Table 1.
Studied transitions and their numerical designation in this article.
| Line | Transition | Center frequency [cm−1] |
|---|---|---|
| 1 | sQ(10,7) | 961.7762 |
| 2 | sQ(10,6) | 962.1443 |
| 3 | sQ(9,9) | 962.1714 |
| 4 | sQ(9,8) | 962.3884 |
| 5 | sQ(6,6) | 965.3539 |
| 6 | sQ(6,5) | 965.4994 |
| 7 | sQ(3,3) | 967.3463 |
| 8 | sQ(3,2) | 967.4068 |
| 9 | sQ(3,1) | 967.449 |
3.1. Line intensities
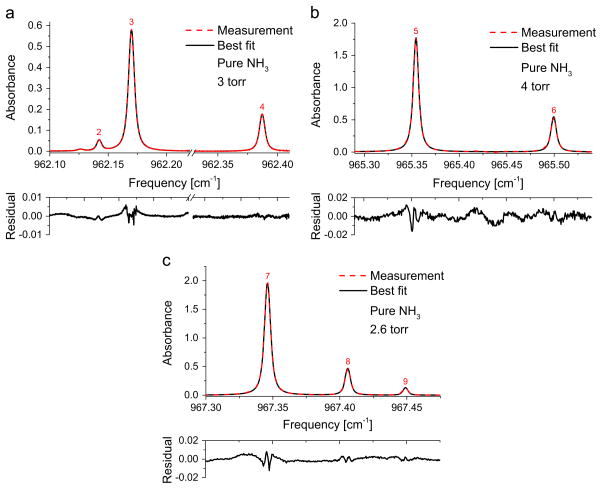
The absorbance was determined from the experimentally obtained I and I0 (Eq. (1)) after correcting for the detector offset (including emission and dark current noise), which was collected for every scan by tuning the laser current below the lasing threshold. Empirical background measurements enabled the extraction of non-absorbed laser intensity (I0) with high fidelity. The absorbance profile was then fit with multiple Voigt profiles positioned at the line centers of each transition with the integrated area (SPχL) and collision broadening FWHM as the free parameters in the measured frequency range (e.g. Fig. 4(a), (b), and (c)) using the Levenberg–Marquardt optimization algorithm. Sample experimental Voigt lineshape fits for the lines 2–9 are shown in Fig. 4(a), (b) and (c). The sample fit for line 1 was not shown in the figure for better clarity of the other fits. In all the reported cases, the errors in the fits were better than 2% of the absorbance at line center. Due to the small residual error of the Voigt fit (typically ~1% max), other lineshape functions were not considered. The current study was conducted below ambient pressure and therefore the absorbance lineshapes at higher pressures must be experimentally validated to check for line-mixing phenomena as observed in the same band [37,38]. Similarly, discrepancies due to collision narrowing effects for the temperature range investigated in this study (<600 K) were found to be negligible. Collision narrowing effects should be reconsidered at higher temperatures, however, if a greater deviation is observed from the current spectral models.
Fig. 4.
Sample spectral fits and residuals for measured absorbances of pure anhydrous ammonia at 296 K in a 3.36 mm optical cell near (a) 962.17 cm−1, (b) 965.35 cm−1 and (c) 967.35 cm−1.
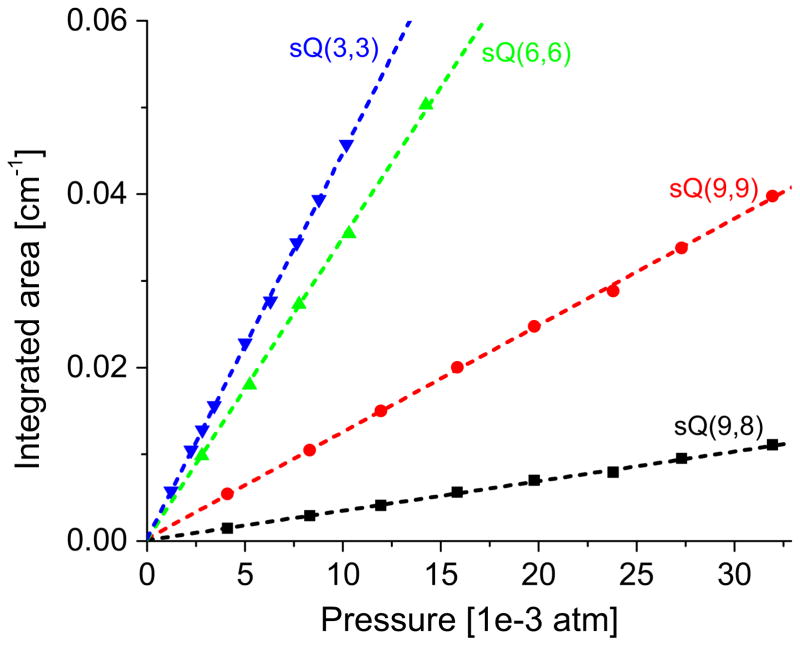
The integrated area under each lineshape, A can be related to the line intensity, S as A = SPχL, where χ is the mole fraction of NH3. For pure ammonia measurements, χ=1. Corresponding to every pressure, the fitted Voigt lineshape resulted in different values of the integrated area, A. These values are plotted versus pressure along with the best-fitted straight line in Fig. 5. The slopes of the best fitted straight lines after being divided by the absorption path length yielded the line intensities of each transition at the measurement temperature, 296 K. The values of line intensities and comparison with the values from the literature are listed in Table 2. It can be seen that all the reported values of line intensities lie within the uncertainty bounds of those in the HITRAN’12 database (<20% for all lines). The fitted Voigt lineshapes also provided the NH3 self-broadening parameters at 296 K as listed in Table 3.
Fig. 5.
Measured integrated area vs pressure at 296 K for the NH3 ν2 transitions sQ(3,3), sQ(6,6), sQ(9,9) and sQ(9,8).
Table 2.
Measured line intensities of Q-branch NH3 transitions and comparison with HITRAN’12 database [35]. The superscripts denote the uncertainties in the measurements with respect to the last decimal digit (e.g. for line 1: S(296 K)=0.2195±0.0055). The values in parenthesis for the column for HITRAN’12 represent the uncertainty reported (±20%) in the database.
| Line | Transition | Center frequency, H12 [cm−1] | E″, H12 [cm−1] | S(296 K), H12 [cm−2/atm] | S(296 K) Current study [cm−2/atm] | % Difference w.r.t. H12 |
|---|---|---|---|---|---|---|
| 1 | sQ(10,7) | 961.7762 | 907.9651 | 0.212(43) | 0.2195(55) | 3.4 |
| 2 | sQ(10,6) | 962.1443 | 955.1064 | 0.251(50) | 0.292(15) | 14.3 |
| 3 | sQ(9,9) | 962.1714 | 592.5867 | 3.769(734) | 3.672(92) | −2.6 |
| 4 | sQ(9,8) | 962.3884 | 655.6464 | 1.081(216) | 1.019(26) | −6.1 |
| 5 | sQ(6,6) | 965.3539 | 283.574 | 10.61(212) | 10.39(26) | −2.1 |
| 6 | sQ(6,5) | 965.4994 | 324.369 | 3.008(602) | 3.096(77) | 2.9 |
| 7 | sQ(3,3) | 967.3463 | 85.861 | 12.52(251) | 13.26(33) | 5.9 |
| 8 | sQ(3,2) | 967.4068 | 104.422 | 2.58(52) | 2.621(66) | 1.6 |
| 9 | sQ(3,1) | 967.449 | 115.536 | 0.611(122) | 0.669(67) | 9.6 |
Table 3.
Measured NH3-Y broadening parameters, γ0, and temperature-dependence exponent, n, with associated uncertainties. For γ0 and n values, the numbers in parentheses are the estimated uncertainties of the measurements in terms of the last digit (e.g. for line 1: γ0,N2=0.087±0.004).
| Line | Transition | Line center | Quantity | N2 | O2 | CO2 | Ar | NH3 | H2O |
|---|---|---|---|---|---|---|---|---|---|
| 1 | sQ(10,7) | 961.7762 | γ0 | 0.087(4) | 0.044(2) | 0.202(8) | 0.033(1) | 0.443(14) | 0.263(11) |
| n | 0.66(5) | 0.69(5) | 1.14(5) | 0.59(5) | 0.86(10) | ||||
| 2 | sQ(10,6) | 962.1443 | γ0 | 0.104(5) | 0.034(2) | 0.216(20) | 0.033(1) | 0.423(26) | 0.257(8) |
| n | 0.98(10) | 0.41(10) | 1.09(10) | 0.48(10) | 0.86(20) | ||||
| 3 | sQ(9,9) | 962.1714 | γ0 | 0.109(4) | 0.051(2) | 0.214(7) | 0.042(2) | 0.57(17) | 0.307(9) |
| n | 0.81(5) | 0.76(5) | 0.74(5) | 0.69(5) | 0.98(10) | ||||
| 4 | sQ(9,8) | 962.3884 | γ0 | 0.098(3) | 0.048(2) | 0.187(10) | 0.039(1) | 0.511(16) | 0.316(13) |
| n | 0.70(5) | 0.67(5) | 0.69(5) | 0.64(5) | 0.90(10) | ||||
| 5 | sQ(6,6) | 965.3539 | γ0 | 0.103(3) | 0.052(2) | 0.18(6) | 0.045(1) | 0.553(28) | 0.321(32) |
| n | 0.76(10) | 0.73(10) | 0.77(10) | 0.79(10) | |||||
| 6 | sQ(6,5) | 965.4994 | γ0 | 0.102(3) | 0.053(2) | 0.171(5) | 0.041(1) | 0.523(26) | 0.341(34) |
| n | 0.63(10) | 0.78(10) | 0.71(10) | 0.64(10) | |||||
| 7 | sQ(3,3) | 967.3463 | γ0 | 0.109(3) | 0.058(2) | 0.178(9) | 0.047(2) | 0.557(28) | 0.298(30) |
| n | 0.86(10) | 0.78(10) | 0.76(10) | 0.76(10) | |||||
| 8 | sQ(3,2) | 967.4068 | γ0 | 0.112(4) | 0.062(2) | 0.156(8) | 0.049(2) | 0.43(22) | 0.383(39) |
| n | 0.81(10) | 0.84(10) | 0.60(10) | 0.66(10) | |||||
| 9 | sQ(3,1) | 967.449 | γ0 | 0.104(5) | 0.053(3) | 0.121(6) | 0.044(2) | 0.351(35) | 0.486(97) |
| n | 0.83(10) | 0.60(10) | 0.61(10) | 0.90(10) |
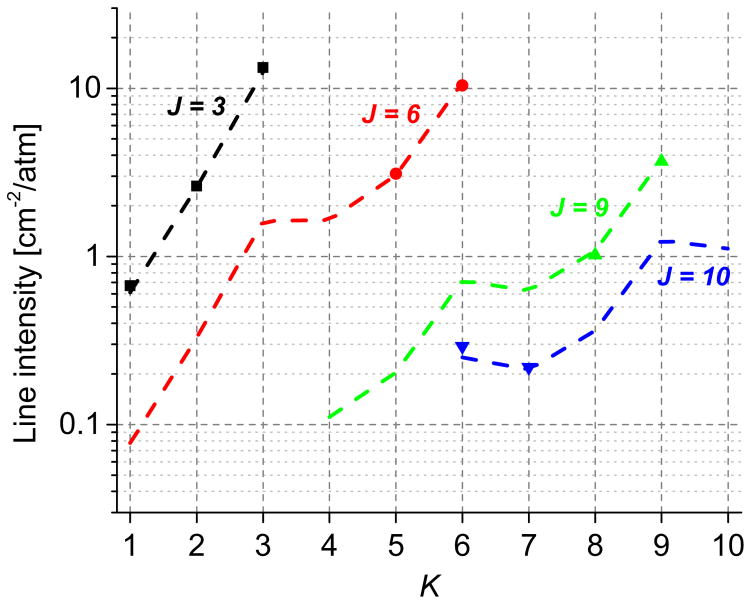
It can be seen from Fig. 6, that for a particular quantum number, J, the measured line intensities (denoted by markers) of the transitions follow the trends predicted by HITRAN’12 (dashed lines for a particular K). Further, due to nuclear spin effects of C3ν group symmetry (σ=3), the degeneracy is doubled if the quantum number K is divisible by 3. Though our data set is relatively sparse, this effect of nuclear spin can be observed in Fig. 6, where the line intensities of transitions with K divisible by 3 are stronger due to larger statistical weight [39].
Fig. 6.
Variation of NH3 line intensities with J and K quantum numbers for NH3 ν2 transitions, sQ(J,K). The dashed lines indicate the values listed in HITRAN’12 database, while the markers indicate the measured values of line intensities.
3.2. Collision broadening
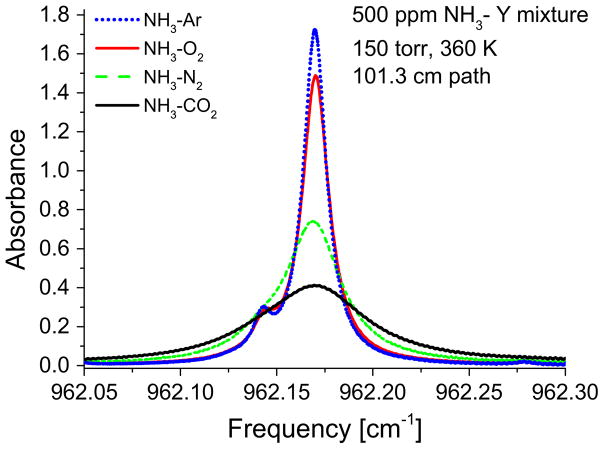
Ammonia absorption features consisting of blended Q-branch transitions can be drastically altered by pressure-dependent collisional line broadening. Moreover, the Lorentzian broadening effect has a strong dependence on collision partner (i.e. bath gas composition). Fig. 7 shows absorption measurements for 500 ppm NH3 near 962.17 cm−1 at 150 Torr in the presence of 4% Ar (see experimental details) and different balance gases, Y (Ar, O2, N2 or CO2). The dramatic change in lineshape motivated the accurate characterization of the collision broadening coefficient, γNH3 –Y of these lines with various broadening partners common to gas mixtures in sensing applications. The collision broadening coefficient, γA–B relates to the optical collision diameter, dAB and the reduced mass, μ as γA–B ~(dAB4/μ)1/2 [39]. Ar has a lower optical diameter than N2 and O2 and is significantly heavier than both, leading to a lower collisional broadening with NH3. Both NH3 and H2O are light molecules with large optical collision diameters, resulting in large collisional broadening, whereas CO2, being a heavier molecule contributes to lesser extent to broadening but is significantly higher than N2, O2 and Ar. These trends can be noted in Fig. 7 and Fig. 8 (a) and also found to be consistent with Owen et al. [27]. The collision broadening coefficient also has a strong dependence on temperature. Very few studies, with the exception of Nemtchinov et al. [25], have been devoted to the study of the temperature dependence of the broadening parameters in this band.
Fig. 7.
Dependence of absorption lineshape on collision partner Y as revealed by the measured spectrum of 500 ppm NH3, 4% Ar and Y (Ar, O2, N2 or CO2) gas balance.
Fig. 8.
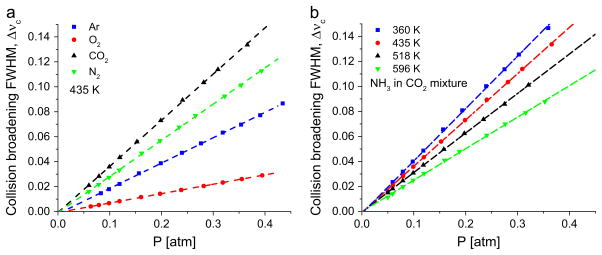
Sample plots of collision broadening FWHM vs pressure for sQ(9,9) for various (a) collision partners at constant temperature and (b) temperatures with CO2 as a collision partner.
To characterize the broadening coefficients, absorption spectra were collected at several pressures, while switching the bath gas between Ar, O2, N2, CO2 and H2O. The absorption spectra when fit with Voigt lineshapes yield the collision broadening halfwidth (FWHM), Δνc.
Fig. 8 illustrates the dependence of Δνc on pressure for (a) different collision partners at a fixed temperature (435 K) and (b) temperatures for CO2 as a collision partner for the sQ(9,9) transition. From Eq. (3), it can be stated that the slopes of the fitted straight lines are equal to twice the sum of the mole-fraction-weighted collision broadening coefficients γNH3 –Y at the corresponding temperatures. The linear fit eliminates the effect of any small offset that the pressure measurements may have. The broadening experiments done with various bath gases contained about 4% additional Ar. Hence, the fits containing additional Ar dilution was corrected for the contribution of γNH3 –Ar. Moreover, it was ensured that any error propagated towards γNH3 –Y due to the uncertainty in γNH3 –Ar was kept to a minimum by creating a highly diluted sample composed primarily of the bath gas (~96%).
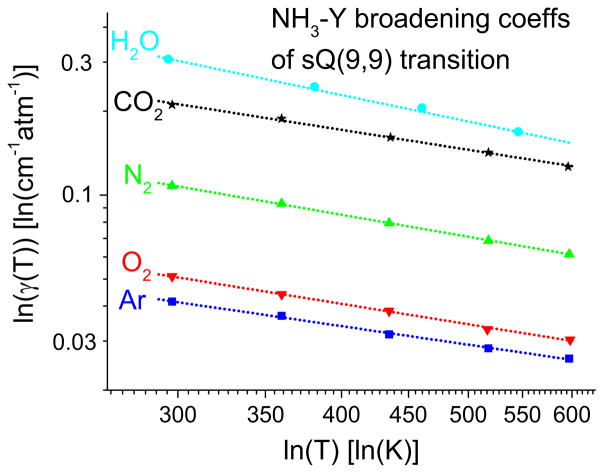
The broadening coefficient obtained for each collision partner Y was then obtained for a range of temperatures. The broadening coefficients obeyed the usual power law form (Eq. (4)). Therefore the plot of ln(γ(NH3–Y)) vs ln(T) had a linear slope that provided the value of n(NH3 –Y). Fig. 9 shows a plot of the broadening coefficient versus temperature for the sQ(9,9) transition, confirming the power-law behavior (linear in ln-ln scale) of these fits. In addition, it was found that the broadening coefficients and their temperature dependence exponents vary significantly with collision partner.
Fig. 9.
Temperature-dependent broadening coefficients (γ(T)) for the NH3 ν2 sQ(9,9) transition for various collision partners, Y displaying power-law behavior in the form of linearity in the ln-ln scale.
The values of the measured broadening coefficients (HWHM/atm) at 296 K (γ0) and the temperature-dependence exponent (n) of broadening are tabulated in Table 3. The parameters of transitions 1–4 were studied in the temperature range of 296–600 K, while the rest were studied from 296–425 K. The lines 1–4 were examined more thoroughly at higher temperatures, because of their greater applicability in high temperature environments, e.g. in combustion exhaust, whereas the other lines generally find greater relevance in lower temperature applications such as atmospheric monitoring and breath sensing. The water broadening temperature-dependence exponents were not measured for lines 5–9 for the same reason. The temperature exponent of NH3-self broadening could not be measured because the 3.36 mm cell was an unheated optical cell.
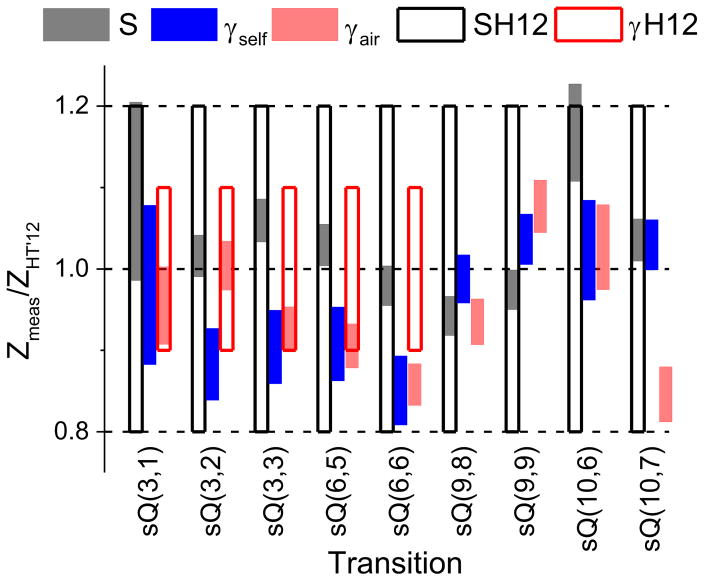
The measured values of the broadening parameters and linestrengths generally agreed within 10% of those in HITRAN’12, and the ratio of the measured values (Zmeas) to those in the HITRAN’12 [35] database (ZHT’12) are shown in Fig. 10. The filled bars represent the measured values (ranging in the vertical direction by their respective measurement uncertainties) divided by the corresponding magnitudes reported in [35]. The unfilled bars denote the range of uncertainty specified in [35]. It can be noted that γself and some values of γair do not have corresponding unfilled bars. This is because [35] only specifies an “average or estimate” uncertainty estimate instead of a numerical one. Some general trends could be observed in the measured values of γ0 with (J,K) quantum numbers. But since only a few transitions with sequential (J,K) values were studied and differences between broadening coefficients of adjacent J values were mostly comparable to the associated errors, no clear trend could be established. But in cases where the errors were small compared to the differences between the broadening values, trends consistent with Owen et al. [27] were observed. For example, for J=3, γ0,H2O decreases with K=1–3, while for J=3, γ0, self and γ0,CO2 increase with K=1–3.
Fig. 10.
Comparison of measured line intensities, self- and air-broadening coefficients with HITRAN’12 database. The unfilled bars indicate the uncertainties specified in HITRAN’12 database (H12). The transitions with missing H12 bars indicate “average or estimate” uncertainty estimate in HITRAN’12.
3.3. Uncertainty analysis
For a given line parameter, U, which is a function of measured variables, εi, the uncertainty in U, (σU) is expressed by the following equation:
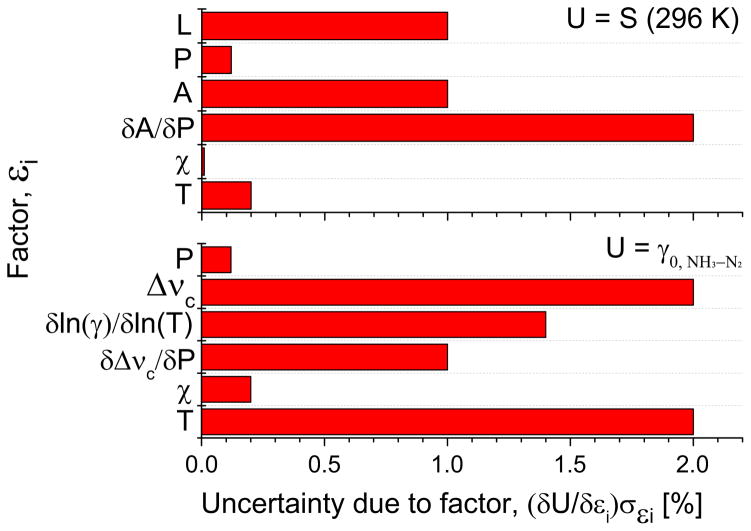
where σεi is the uncertainty associated with the variable εi. Fig. 11 shows the factors considered for the uncertainty analysis and their impact on the measurement uncertainties for the sQ(10,7) transition as an illustrative example. The different factors that influenced the measurement of the measured quantities are explained in details as follows:
Fig. 11.
Example uncertainty analysis for sQ(10,7): line intensity, S(296 K) and N2 broadening coefficient, γ0,NH3 –N2.
3.3.1. Line intensity
The most significant sources of error in the measurement of the line intensities are:
Path length, L: The measurements were performed in the short path length cell. Therefore it was crucial to determine the path length precisely, which was done by measuring the integrated area of the absorption profile of pure CO2 in the cell using a pre-characterized CO2 transition centered at 2384.186 cm−1 with an uncertainty of less than 1%.
Pressure, P: The manufacturer (MKS instruments) has specified the pressure measurement uncertainty to be 0.12% of the reading and this translates to 0.12% in line intensity as they are inversely proportional.
Integrated area, A: The residual of each fit Voigt profile introduces uncertainty in the inferred integrated area of about 1% due to 2% RMS error at the peak of the profile.
Slope of the integrated area vs P, δA/δP: The standard error in the slope of the fitted line on the A vs P plot is taken into account by this factor.
Mole fraction of the gas, χ: Since 99.99% pure anhydrous NH3 was used to measure the line intensity, the mole fraction only leads to a 0.01% uncertainty.
Temperature of the sample, T: The thermocouple temperature had 0.2% uncertainty in the recorded values. The line intensities of the presented lines have a dependence on T that is primarily a function of the lower state energy of the transition, E″.
3.3.2. Broadening coefficient
Key factors influencing the uncertainty in the estimation of the broadening coefficients are:
Pressure, P: The broadening halfwidths are directly proportional to pressure. Hence, the error has an 1:1 correlation to uncertainty in P.
Collision FWHM, ΔνC: The residual of each fitted Voigt profile from the absorbance data can be attributed to some uncertainty in the collision FWHM. This correlates to about 1% uncertainty due to 1% RMS error at the peak.
Slope of the FWHM vs P, δΔνC/δP: The standard error in the slope of the fitted line on the ΔνC vs P plot is taken into account by this factor.
Slope of ln(γ) vs ln(T), δln(γ)/δln(T): The linearity of this plot was essential to obtaining a power-law behavior expression in γ. This factor captures the effect of the inaccuracy of the power-law model.
Mole fraction of the gas, χ: Presence of 4% Ar in the mixture with bath gas resulted in an associated uncertainty in the corrected broadening coefficient for a specific bath gas Y. This amounts to less than 0.2% uncertainty in γ0,NH3 –Y for Y≠Ar.
Temperature of the sample, T: The temperature non-uniformity in the cell (±4 K), especially at higher temperatures led to an additional uncertainty of 2%.
The errors in the temperature dependence exponents (n) were estimated in a method similar to Nemtchinov et al. [25]. Lines 1–4 show a better uncertainty in n since the value was obtained over a broader temperature range with additional temperature samples.
4. Conclusions
Line intensities and temperature-dependent broadening coefficients of select lines in the ammonia ν2 fundamental sQ(J,K) manifold are reported. A Voigt profile fitting algorithm was used to fit empirical absorption lineshapes and determine collision broadening FWHMs and integrated areas. The line intensity and self-broadening measurements were performed in a 3.36 mm cell with 99.99% pure NH3 at 296 K. The reported values were found to be mostly within the uncertainty bounds of the HITRAN’12 database. The broadening coefficients were measured with Ar, O2, N2, CO2 and H2O as collision partners in dilute mixtures within the temperature range of 296–600 K in a 101 cm cell. The measurements indicate a strong dependence on the collision partner. The power-law temperature-dependence exponent was also reported for each species, with the exception of NH3 self-broadening. The uncertainties in the experimental results represent an improvement over computed or estimated parameters in the current literature, where comparable values are available. More notably, the comprehensive set of spectroscopic parameters determined in this study provides a basis for sensitive and quantitative ammonia sensing over a broad range of gas conditions and mixture compositions for relevant applications.
Acknowledgments
This work was conducted with support from the Spectrum-SPADA innovation grant of Stanford University (NIH UL1 TR 000093), and NIH NICHD STTR Award (1R41HD084055-01).
The content is solely the responsibility of the authors and does not necessarily represent the official views of the National Institutes of Health.
References
- 1.Lewicki R, Kosterev A, Thomazy DM, Gong L, Griffin R, Day T, et al. Ammonia sensor for environmental monitoring based on a 10.4 μm external-cavity quantum cascade laser. Proceedings of lasers, sources related photonic devices; Washington, D.C.: OSA. 2010; p. LTuD2. [Google Scholar]
- 2.Schilt S, Thévenaz L, Niklès M, Emmenegger L, Hüglin C. Ammonia monitoring at trace level using photoacoustic spectroscopy in industrial and environmental applications. Spectrochim Acta Part A Mol Biomol Spectrosc. 2004;60:3259–68. doi: 10.1016/j.saa.2003.11.032. [DOI] [PubMed] [Google Scholar]
- 3.Bakhirkin YA, Kosterev AA, Wysocki G, Tittel FK, Risby TH, Bruno JD. quantum cascade laser-based sensor platform for ammonia detection in exhaled human breath. Proceedings of laser applications to chemical, security, and environmental analysis; Washington, D.C.: OSA. 2008; p. LMB4. [Google Scholar]
- 4.Owen K, Farooq A. A calibration-free ammonia breath sensor using a quantum cascade laser with WMS 2f/1f. Appl Phys B. 2013;116:371–83. [Google Scholar]
- 5.Moskalenko KL, Nadezhdinskii AI, Adamovskaya IA. Human breath trace gas content study by tunable diode laser spectroscopy technique. Infrared Phys Technol. 1996;37:181–92. [Google Scholar]
- 6.Manne J, Sukhorukov O, Jäger W, Tulip J. Pulsed quantum cascade laser-based cavity ring-down spectroscopy for ammonia detection in breath. Appl Opt. 2006;45:9230. doi: 10.1364/ao.45.009230. [DOI] [PubMed] [Google Scholar]
- 7.Webber ME, Claps R, Englich FV, Tittel FK, Jeffries JB, Hanson RK. Measurements of NH3 and CO2 with distributed-feedback diode lasers near 2. 0 μm in bioreactor vent gases. Appl Opt. 2001;40:4395. doi: 10.1364/ao.40.004395. [DOI] [PubMed] [Google Scholar]
- 8.Schilt S, Besson J-P, Thévenaz L, Gyger M. Continuous and Simultaneous multigas monitoring using a highly sensitive and selective photoacoustic sensor. Conference on lasers and electro-optics, optical society of america; 2005; p. CTuGG4. [Google Scholar]
- 9.Webber ME, MacDonald T, Pushkarsky MB, Patel CKN, Zhao Y, Marcillac N, et al. Agricultural ammonia sensor using diode lasers and photoacoustic spectroscopy. Meas Sci Technol. 2005;16:1547–53. [Google Scholar]
- 10.Pushkarsky MB, Webber ME, Baghdassarian O, Narasimhan LR, Patel CKN. Laser-based photoacoustic ammonia sensors for industrial applications. Appl Phys B Lasers Opt. 2002;75:391–6. [Google Scholar]
- 11.Claps R, Englich FV, Leleux DP, Richter D, Tittel FK, Curl RF. Ammonia detection by use of near-infrared diode-laser-based overtone spectroscopy. Appl Opt. 2001;40:4387. doi: 10.1364/ao.40.004387. [DOI] [PubMed] [Google Scholar]
- 12.Totschnig G, Lackner M, Shau R, Ortsiefer M, Rosskopf J, Amann MC, et al. High-speed vertical-cavity surface-emitting laser (VCSEL) absorption spectroscopy of ammonia (NH3) near 1. 54 μm. Appl Phys B. 2003;76:603–8. [Google Scholar]
- 13.De Tommasi E, Casa G, Gianfrani L. High precision determinations of NH3 concentration by means of diode laser spectrometry at 2. 005 μm. Appl Phys B. 2006;85:257–63. [Google Scholar]
- 14.Modugno G, Corsi C. Water vapour and carbon dioxide interference in the high sensitivity detection of NH3 with semiconductor diode lasers at 1. 5 μm. Infrared Phys Technol. 1999;40:93–9. [Google Scholar]
- 15.Paldus BA, Harb CC, Spence TG, Zare RN, Gmachl C, Capasso F, et al. Cavity ringdown spectroscopy using mid-infrared quantum-cascade lasers. Opt Lett. 2000;25:666. doi: 10.1364/ol.25.000666. [DOI] [PubMed] [Google Scholar]
- 16.Filho MB, da Silva MG, Sthel MS, Schramm DU, Vargas H, Miklós A, et al. Ammonia detection by using quantum-cascade laser photoacoustic spectroscopy. Appl Opt. 2006;45:4966. doi: 10.1364/ao.45.004966. [DOI] [PubMed] [Google Scholar]
- 17.Kosterev AA, Tittel FK. Ammonia detection by use of quartz-enhanced photoacoustic spectroscopy with a near-ir telecommunication diode laser. Appl Opt. 2004;43:6213. doi: 10.1364/ao.43.006213. [DOI] [PubMed] [Google Scholar]
- 18.Manne J, Jäger W, Tulip J. Sensitive detection of ammonia and ethylene with a pulsed quantum cascade laser using intra and interpulse spectroscopic techniques. Appl Phys B. 2008;94:337–44. [Google Scholar]
- 19.Lewicki R, Kosterev AA, Thomazy DM, Risby TH, Solga S, Schwartz TB, et al. Real time ammonia detection in exhaled human breath using a distributed feedback quantum cascade laser based sensor. Proceedings of SPIE OPTO international society for optics and photonics; 2011; pp. 79450K–79450K–7. [Google Scholar]
- 20.Miller DJ, Zondlo MA. Open-path high sensitivity atmospheric ammonia sensing with a 9 μm quantum cascade laser. Proceedings of Conference on lasers electro-optics; Washington, D.C.: OSA. 2010; p. JThJ4. [Google Scholar]
- 21.Kleiner I, Tarrago G, Cottaz C, Sagui L, Brown LR, Poynter RL, et al. NH3 and PH3 line parameters: the 2000 HITRAN update and new results. J Quant Spectrosc Radiat Transf. 2003;82:293–312. [Google Scholar]
- 22.Fabian M, Ito F, Yamada KMT. N2, O2, and air broadening of NH3 in ν2 band measured by FTIR spectroscopy. J Mol Spectrosc. 1995;173:591–602. [Google Scholar]
- 23.Aroui H, Nouri S, Bouanich J-P. NH3 self-broadening coefficients in the ν2 and ν4 bands and line intensities in the ν2 band. J Mol Spectrosc. 2003;220:248–58. [Google Scholar]
- 24.Guinet M, Jeseck P, Mondelain D, Pepin I, Janssen C, Camy-Peyret C, et al. Absolute measurements of intensities, positions and self-broadening coefficients of R branch transitions in the ν2 band of ammonia. J Quant Spectrosc Radiat Transf. 2011;112:1950–60. [Google Scholar]
- 25.Nemtchinov V, Sung K, Varanasi P. Measurements of line intensities and half-widths in the 10-μm bands of. J Quant Spectrosc Radiat Transf. 2004;83:243–65. [Google Scholar]
- 26.Fabian M, Yamada KMT. Absolute Intensity of the NH3 ν2 Band. J Mol Spectrosc. 1999;198:102–9. doi: 10.1006/jmsp.1999.7937. [DOI] [PubMed] [Google Scholar]
- 27.Owen K, Es-sebbar E, Farooq A. Measurements of NH3 linestrengths and collisional broadening coefficients in N2, O2, CO2, and H2O near 1103. 46 cm−1. J Quant Spectrosc Radiat Transf. 2013;121:56–68. [Google Scholar]
- 28.Aroui H, Chevalier M, Broquier M, Picardbersellini A, Gherissi S, Legaysommaire N. Line mixing parameters in the ν4 rovibrational band of NH3 perturbed by N2. J Mol Spectrosc. 1995;169:502–10. [Google Scholar]
- 29.Aroui H, Broquier M, Picard-Bersellini A, Bouanich JP, Chevalier M, Gherissi S. Absorption intensities, pressure-broadening and line mixing parameters of some lines of NH3 in the ν4 band. J Quant Spectrosc Radiat Transf. 1998;60:1011–23. [Google Scholar]
- 30.Dhib M, Bouanich J-P, Aroui H, Picard-Bersellini A. Analysis of N2, O2, CO2, and air broadening of infrared spectral lines in the ν4 band of NH3. J Quant Spectrosc Radiat Transf. 2001;68:163–78. [Google Scholar]
- 31.Markov VN, Pine AS, Buffa G, Tarrini O. Self broadening in the v1 band of NH3. J Quant Spectrosc Radiat Transf. 1993;50:167–78. [Google Scholar]
- 32.Pine AS, Markov VN, Buffa G, Tarrini O. N2, O2, H2, Ar and He broadening in the ν1 band of NH3. J Quant Spectrosc Radiat Transf. 1993;50:337–48. [Google Scholar]
- 33.Pine AS, Markov VN. Self- and foreign-gas-broadened lineshapes in the ν1 band of NH3. J Mol Spectrosc. 2004;228:121–42. [Google Scholar]
- 34.Schilt S. Impact of water vapor on 1. 51 μm ammonia absorption features used in trace gas sensing applications. Appl Phys B. 2010;100:349–59. [Google Scholar]
- 35.Rothman LS, Gordon IE, Babikov Y, Barbe A, Chris Benner D, Bernath PF, et al. The HITRAN 2012 molecular spectroscopic database. J Quant Spectrosc Radiat Transf. 2013;130:4–50. [Google Scholar]
- 36.Down MJ, Hill C, Yurchenko SN, Tennyson J, Brown LR, Kleiner I. Reanalysis of ammonia spectra: updating the HITRAN 14 NH3 database. J Quant Spectrosc Radiat Transf. 2013;130:260–72. [Google Scholar]
- 37.Hadded S, Thibault F, Flaud P-M, Aroui H, Hartmann J-M. Experimental and theoretical study of line mixing in NH[sub 3] spectra. I. Scaling analysis of parallel bands perturbed by He. J Chem Phys. 2002;116:7544. doi: 10.1063/1.1630306. [DOI] [PubMed] [Google Scholar]
- 38.Aroui H, Ben Mabrouk K, Boussassi R. Line-mixing effect on NH3 line intensities. J Quant Spectrosc Radiat Transf. 2013;130:273–83. [Google Scholar]
- 39.Hanson RK, Spearrin RM, Goldenstein CS. Spectroscopy and optical diagnostics for gases. 1. Springer; 2016. [Google Scholar]


