

Abstract
Bones of the murine cranial vault are formed by differentiation of mesenchymal cells into osteoblasts, a process that is primarily understood to be controlled by a cascade of reactions between extracellular molecules and cells. We assume that the process can be modeled using Turing’s reaction-diffusion equations, a mathematical model describing the pattern formation controlled by two interacting molecules (activator and inhibitor). In addition to the processes modeled by reaction-diffusion equations, we hypothesize that mechanical stimuli of the cells due to growth of the underlying brain contribute significantly to the process of cell differentiation in cranial vault development. Structural analysis of the surface of the brain was conducted to explore the effects of the mechanical strain on bone formation. We propose a mechanobiological model for the formation of cranial vault bones by coupling the reaction-diffusion model with structural mechanics. The mathematical formulation was solved using the finite volume method. The computational domain and model parameters are determined using a large collection of experimental data that provide precise three dimensional (3D) measures of murine cranial geometry and cranial vault bone formation for specific embryonic time points. The results of this study suggest that mechanical strain contributes information to specific aspects of bone formation. Our mechanobiological model predicts some key features of cranial vault bone formation that were verified by experimental observations including the relative location of ossification centers of individual vault bones, the pattern of cranial vault bone growth over time, and the position of cranial vault sutures.
Keywords: computational morphogenesis, finite volume method, skull growth, developmental biology, mechanobiology, intramembranous ossification
1. Introduction
The part of the cranium that surrounds the brain is known as the neurocranium and can be divided into two parts. The cranial base is positioned beneath the brain and is composed of a series of bones that form first as a set of cartilaginous anlagen that are replaced by bone through a process known as endochondral ossification. The cranial vault covers and protects the superior and lateral aspects of the brain and consists of a series of flat bones that form through intramembranous ossification, where undifferentiated mesenchymal cells of either neural crest or mesoderm origin form condensations and differentiate directly into osteoblasts and begin to form bone.1 Intramembranous ossification is based on epithelial-mesenchymal interactions that are controlled by a cascade of reactions of locally produced and circulating factors (e.g., signaling molecules and their receptors, extracellular matrix proteins and receptors)2–4 that play significant roles in the differentiation of cells into osteoblasts that make bone.5,6 Though much is known about the details of signaling required for mesenchymal cells to differentiate and begin to produce collagen and then mineralize the collagen matrix, much less is known about how single bones acquire their characteristic shapes and how they cooperate to form an integrated skull. Research in tissue regeneration is revealing that biomechanical input, though not completely understood, plays an important role in these process.7–11
Several computational studies have been conducted to model the process of bone formation. One common approach is the application of a mathematical model for reaction-diffusion controlled by two interacting chemical molecules, first proposed by Turing 12, which has been employed in the study of biological pattern formation and the development of biological systems.13–17 The Turing model, also commonly referred to as the reaction-diffusion model, shows that through the regulatory loop of interacting molecules, the concentration of molecules forms an inhomogeneous spatial pattern. We previously examined the reaction-diffusion model for pattern formation on simple 1D and 2D domains,18 and used the approach to predict the locations of the primary centers of ossification in the cranial vault and the pattern of cranial bone growth.19 However, the approach did not include effects of mechanical stimuli such as local stress and strain on cells that have been revealed to have a significant effect on the differentiation of bone cells and on bone formation by several groups. Claes and Heigele 20 reported that intramembranous bone formation occurs within a certain range of strain and stress, otherwise endochondral bone or connective tissue are formed. Guevara et al. 21 proposed a computational approach to find the effect of stress distribution during the development of long bone. Here, we propose a mechanobiological model that combines the influence of mechanical stimuli with a reaction-diffusion model to predict and explain the process of cranial vault bone formation and development in the mouse. We compute the estimated strain distribution across the layer of undifferentiated mesenchyme surrounding the brain that results from rapid expansion of the growing brain.22
By examining the correlation between the estimated strain and the pattern of bone formation through an iterative comparison of computed and experimental cranial vaults, we present a mathematical model of the biological process of cranial vault bone formation.
2. Methods
We followed a similar approach that was used in our previous study19 to describe the molecular activities in the process of the bone formation in the cranial vault. While our previous approach showed that development of cranial bone can be numerically simulated with the reaction-diffusion (R-D) model, details of which will be introduced later (Section 2.2), some parts of the model were based on the experimental observations rather than elucidating the mechanical mechanisms that might underlie the lack of ossification at the apex of the cranial vault dome and how local factors respond to subtle inputs as each bone takes shape. To explore the underlying mechanisms we hypothesize that mechanical stimuli initiated by growth of underlying brain plays a significant role in the process of bone formation. Here we test the hypothesis by conducting a structural analysis (Section 2.1), coupling a molecular reaction-diffusion model with the mechanical input resulting from the structural analysis (Section 2.2) and finally comparing computational results with experimental observations (Section 3).
2.1. Structural Analysis
We conducted a structural analysis using the finite volume method to determine how mechanical strain affects the development of cranial vault bone. This requires defining the surface geometry, a continuum model and the boundary conditions.
2.1.1. Geometry
A computational domain was constructed using an isosurface reconstructed from micro CT images of a mouse head at embryonic day 17.5 (E17.5) (Fig. 1) (pixel size and slice thickness ranged from 0.014 to 0.025 mm). We segmented the five cranial vault bones (right and left frontal bones, right and left parietal bones and a single interparietal bone), made a global surface that covers the cranial vault and then made a thin volume around the surface to represent space occupied by mesenchymal cells. The domain has three surfaces: 1) the inner surface that acts as a surrogate for the surface of underlying brain; 2) the outer surface that represents the layer of mesenchymal cells; and 3) the bottom surface or edge where the inner surface and outer surface meet at the base that we are currently using to represent the chondrocranium, a cartilagenous structure formed prior to the cranial vault.23 The mesh was generated using a commercial software ANSYS ICEM CFD (ANSYS, Inc., Canonsburg, PA, USA) and contains 51,177 tetrahedral elements.
Fig. 1.

Computational Domain: A computational domain is constructed using 3D reconstruction of micro CT images of skull of mouse at embryonic day 17.5 (E17.5). Bones of the cranial vault (two frontal, two parietal and a single inter-parietal bone) were extracted to establish a global surface and a 3D space around the surface is constructed and meshed (shown in blue). (a) Superior view, anterior at top, posterior at bottom. (b) Left lateral view, facial skeleton to the left.
2.1.2. Continuum Model
For now, we assume that mesenchymal cells behave as linear elastic, isotropic, homogeneous media. We acknowledge that soft tissue behaves as viscoelastic media in nature but our assumption is used as a first guess to model the relation between biomechanical strain and the pattern of bone formation. Considering the cells as continuum elements, the balance of momentum with no body forces which governs the mechanical behavior of the material is given by: ∂2(ρu)/∂t2 − ∇ · σ = 0. A constitutive relation between stress and strain for elastic material is described by: σ = 2με+λtr(ε)I. The strain tensor, ε, is defined in terms of displacement u assuming small strain theory by . The equations were solved by the finite volume method using an elastic solid mechanical module in the open source code OpenFOAM.24.
2.1.3. Boundary and Initial Condition
Boundary conditions for three surfaces of the domain for the structural analysis are shown in Fig. 2. A higher pressure of 1 kPa is applied as the boundary condition on the inner surface, representing pressure due to the growth of underlying brain. The value of pressure produced by a growing embryonic brain is unknown in biology but here we adopt a value of intracranial pressure due to brain and cerebrospinous fluid volume as measured in adult mice presented by Oshio et al. 25. A lower pressure (0 Pa) is adopted for use on the outer surface. The bottom surface is treated as fixed at the moment of analysis.
Fig. 2.

Schematic showing boundary conditions for solid mechanical analysis. Difference between higher pressure of 1 kPa on the inner surface and lower pressure of 0 Pa on the outer surface represents pressure coming from growth of the underlying brain. The bottom surface, which represents the superior edge of the chondrocranium that is formed earlier than cranial vault bones, is treated as fixed at the moment of analysis. (a) isometric view (b) superior view and (c) section view of the domain.
Material properties were adopted from Pillarisetti et al. 26 who measured mechanical characteristics of mouse embryonic stem cells. Values of 1000 kg/m3 for density (ρ), 20 kPa for Young’s modulus (E) and 0.4 for Poissons ratio (ν) were used for the material properties of the soft tissue.
2.1.4. Results: Strain Field
Results of solid mechanical analysis are shown in Fig. 3. Figure 3(b) shows the distribution of hydrostatic strain εhyd which can be estimated by (εxx + εyy + εzz)/3. We focused on the hydrostatic strain based on the study of Carter et al. 27 suggesting that hydrostatic stimuli, rather than shear stimuli, may play an important role in tissue differentiation. When the contour of the strain field (Fig. 3(b)) and isosurface of the murine cranial vault segmented from micro CT images of an E17.5 mouse (Fig. 3(a)) are superimposed (Fig. 3(c)) an obvious correspondence between the distribution of strain and the pattern of bone formation is observed. Less bone forms in areas of high strain. From this observation, we formulate a hypothesis;
Hypothesis 1 (H1): Mechanical stimuli produced by growth of the underlying brain play a significant role in the process of bone formation by inhibiting cell differentiation local to areas of high hydrostatic strain.
Fig. 3.

Distribution of hydrostatic strain (εhyd) and comparison with experimental data. (a) isosurface of mineralized cranial vault bone segmented from micro CT image of a mouse at E17.5. Superior view, anterior at top, posterior at bottom. (b) Field of hydrostatic strain. High tensile strain appears on the top of the domain. (c) Overlap of isosurface of cranial vault bone segmented from micro CT image and strain field. The locations of bones correspond with regions of low strain.
This hypothesis agrees with the study of Claes and Heigele 20 indicating that magnitudes of local stress and strain determine the type of differentiation of mesenchymal cells. Specifically, intramembranous ossification, which is responsible for formation of cranial vault bones, occurs within a certain range of strain and an excessive magnitude of strain restricts bone formation.
2.2. Coupled reaction-diffusion-strain model
2.2.1. Pre-patterning model
The experimental evidence observed by Wan and Cao 6 shows an important role of bone morphogenetic proteins (BMPs) in bone formation and the feedback mechanism between BMPs and their antagonists such as noggin. From this observation we formulate our second hypothesis;
Hypothesis 2 (H2): The differentiation of mesenchymal cells is activated by a key molecule (the activator, e.g. BMP) whose behavior is regulated by another molecule (the inhibitor, e.g. noggin) so that the regulatory loop of the two molecules can be modeled using an activator-inhibitor model, a type of Turing’s reaction-diffusion model.12
as used in our previous study.19 In this study we modified the previously used activator-inhibitor model28 by adding a strain effect to the expression of key molecules. The coupled reaction-diffusion-strain (R-D-ε) model for pre-patterning is described mathematically as:
| (1a) |
| (1b) |
where Ca and Ch indicate concentration of activator and inhibitor, respectively and α, β, γ and D are constant parameters which control various behaviors of the activator and inhibitor system. That is, Equations (1a) and (1b) indicate that the rate of change of concentration of each molecule (∂Ca/∂t and ∂Ch/∂t) is controlled by its production (αa and αhεhyd2), degradation (βaCa and βhCh), interaction between the molecules ( and ) and diffusion in space (Da∇2Ca and Dh∇2Ch). Based on the hypothesis (H1) that high strain inhibits intramembranous bone formation, a term in Eq. (1b) related to the production rate of the inhibitor molecule is given as proportional to the square of the hydrostatic strain (αhεhyd2) so that an increase in the inhibitor molecule will occur local to regions where the magnitude of strain (either positive or negative) is high. The proportional relation between the order of strain and the production of inhibitor was determined by comparisons of computational results with experimental data. A quadratic term (αhεhyd2) turned out to be the most appropriate as an αhεhydp term does not show a significant effect when p < 2 (e.g., linear term αhεhyd) and the term overestimates the effect when p > 2 (e.g., cubic term αhεhyd3).
It is convenient to nondimensionalize the equations to reduce the number of parameters using a nondimensional time (t*) and length (x*) scale and concentrations ( and ) where t* = βat, and . Adopting this convention, Eq. (1a) and (1b) can be reduced to Eq. (2a) and (2b).
| (2a) |
| (2b) |
where α = (βaαh)/(γaαa), β = βh/βa, γ = (αaγh)/(βaγa), D = Dh/Da and ∇*2 = ∂2/∂x*2. Non-dimensional parameters were chosen to satisfy constraints for pattern formation using a linear stability analysis.29 The values of the parameters for the pattern formation of activator and inhibitor (Eq. (2a) and (2b)) are provided in Table 1.
Table 1.
Model parameters in coupled reaction-diffusion-strain model for pattern formation of activator and inhibitor (Eq. (2a) and (2b)).
| Non-dimensional parameters | Value | |
|---|---|---|
| Production | α | 100 |
| Depletion | β | 2.0 |
| Interaction | γ | 0.4 |
| Diffusion | D | 100 |
2.2.2. Initial cell differentiation model
The first mesenchymal cells to coalesce and differentiate along an osteogenic path are those that form the primary centers of ossification for each cranial vault bone. Based on our hypotheses, their location is determined by local concentration of activator (H2) and strain (H1), represented mathematically as:
| (3) |
where Co indicates concentration of osteoblasts and CaT is the threshold value for concentration of activator required for mesenchymal cells to differentiate into osteoblasts. The parameter εl is the critical value of strain which sets a range of strain where cells are likely to differentiate. That is, mesenchymal cells differentiate initially and form the primary centers of ossification at the location where concentration of activator exceeds a certain threshold value (CaT) and strain is within a certain limit (εl). Exact values for the threshold of concentration of activator and for the limit of strain were chosen by comparing the timing and the locations of appearance of primary centers of ossification in our computational results with their known locations in our experimental observations. The value η is a constant quantifying the amount of osteoblast generated by action of the activator. The value n is a constant characterizing how sharply the rate of cell differentiation increases after the concentration of activator reaches the threshold value. The values of the parameters for initial cell differentiation model are provided in Table 2.
Table 2.
Model parameters in coupled reaction-diffusion-strain model for primary centers of ossification (Eq. (3))
| Parameters | Value | Units | |
|---|---|---|---|
| Differentiation Constant | η | 1.0 × 10⁻⁸ | 1/s |
| Activator Threshold | CaT | 6.0 × 10⁻³ | kg/m3 |
| Strain Limitation | εl | 2.5 × 10⁻² | |
| Control Constant | n | 8.0 |
2.2.3. Bone growth model
Bones grow from a primary ossification center by the differentiation of mesenchymal cells around the periphery due to a signal input from a morphogen that diffuses and is received by adjacent cells to promote further differentiation. Komori 30 observed the details of this process by finding that runt-related transcription factor 2 (Runx2) is upregulated in osteoblasts and induces the differentiation of mesenschymal cells. From this observation, we formulate our third hypothesis;
Hypothesis 3 (H3): Bones grow from the primary ossification centers by the action of molecules produced by osteoblasts (e.g., Runx2) that contribute to the formation of extracellular matrix proteins of forming bone and mineralization of the matrix.
Considering the relation between strain and bone formation we observed in section 2.1, we model the process of bone growth as an expansion of regions of high concentration of differentiated osteoblasts according to the diffusion of the morphogen (H3) and the distribution of strain (H1) (Eq. (4) and (5)):
| (4) |
| (5) |
where Co and Cm represent concentration of the osteoblasts and the morphogen produced by the osteoblasts, respectively, while subscript i indicates any quantities of the i-th bone region (e.g. i = 1; right frontal, i = 2; left frontal, i = 3; right parietal, i = 4; left parietal and i = 5; interparietal bone region). The variable Co is computed for a short initial time (t < E15) using the initial cell differentiation model (Eq. (3)), and then is split up into the Co-i based on its location. Equation (4) indicates that the mesenchymal cells, exposed to higher concentrations of the osteoblast-produced morphogen whose expression is mediated by Runx2 relative to a threshold value (CmT), differentiate into osteoblasts. The parameter CoS indicates the saturated concentration of the osteoblast. Adopting the approach of Garzón-Alvarado et al. 16 to model suture formation, the differentiation of mesenchymal cells at the periphery of the i-th bone is modeled to be restricted when it senses higher concentration of the morphogen secreted from the contiguous edge of the j-th bone (i ≠ j) relative to a limitation value (Cml). The parameter κ is a constant quantifying the amount of osteoblast differentiated by action of the morphogen. The effect of strain is applied to the bone growth model (Eq. (4)) following the procedure for the initial cell differentiation model (Eq. (3)) in the way that mesenchymal cells differentiate when they experience lower strain than a certain limit (εl).
Equation (5) models the behavior of the morphogen that is expressed by the osteoblasts and diffuses into space, a behavior that makes the regions of osteoblasts expand over time. The parameter CmS indicates saturated concentration of the morphogen. The parameter ω is a constant quantifying the amount of the morphogen expressed by osteoblasts and Dm is the diffusion rate of the morphogen. The values of the parameters for the bone growth model are given in Table 3.
Table 3.
| Parameters | Value | Units | |
|---|---|---|---|
| Growth Constant | κ | 1.0 × 10⁻⁴ | kg/(m3× s) |
| Osteoblast Saturation | CoS | 1.0 × 10⁻³ | kg/m3 |
| Morphogen Threshold | CmT | 1.0 × 10⁻³ | kg/m3 |
| Morphogen Limitation | Cml | 1.0 × 10⁻⁸ | kg/m3 |
| Strain Limitation | εl | 2.5 × 10⁻² | |
| Control Constant | n | 8.0 | |
| Morphogen Constant | ω | 5.0 × 10⁻⁵ | /s |
| Morphogen Saturation | CmS | 1.0 × 10⁻³ | kg/m3 |
| Morphogen Diffusion | Dm | 4.0 × 10⁻¹⁴ | m2/s |
The reaction-diffusion-strain (R-D-ε) model for cranial vault bone formation (Eq. (2)–(4)) is developed from our previously published reaction-diffusion (R-D) model19 by being modified with mechanical considerations. Differences between the two models are summarized in Table 4 and computational results predicted by the two models will be compared in Section 3 to investigate the effects of mechanical input.
Table 4.
Comparison of reaction-diffusion-strain (R-D-ε) model with the previous reaction-diffusion (R-D) model19.
2.2.4. Numerical condition
The domain used in the solid mechanical analysis is also used for the coupled reaction-diffusion-strain model. Partial differential equations (Eq. (1)–(5)) were also solved with finite volume method using an open source code OpenFOAM (www.openfoam.org). Since initial conditions may differ from individual to individual, we applied different sets of randomly distributed concentrations of activator (uniform random with 0.5%) to see the influence of our initial perturbation. The initial concentration of inhibitor is uniform over the domain. A zero gradient of concentration of molecules was adopted as the boundary condition for all surfaces, which means molecules are not able to move through the surface. Equation (1)–(3) were solved first until t = E15 to find the locations of the first differentiated osteoblasts (Co > 0.001kg/m3). The Co computed at t = E15 using the initial cell differentiation model (Eq. (3)) is split up into the Co-i based on its location and the Co-i is used as the initial condition to solve Eq. (4) and (5).
3. Results
3.1. Pattern Formation of Activator and Inhibitor
Figure 4 shows the distribution of activator at initial time (E0) and E15 estimated using two computational models. Looking at the results predicted by our previous reaction-diffusion (R-D) model19 that does not consider biomechanical input (Eq. (2) with the boxed term replaced by a constant (αconst = 1)), variation in the initial perturbation of the activator at the initial time (Fig. 4(a) and (d)) leads to different spatial patterns of activator at E15 (Fig. 4(b) and (e)). The results show that the distribution of activator predicted by the R-D model depends strongly on the initial condition of the activator. Alternatively, the reaction-diffusion-strain (R-D-ε) model (Eq. (2)) shows that different initial perturbations establish a consistent spatial pattern of activator after some time when reaction-diffusion of interacting molecules and effects of mechanical stimuli are combined. Several (more than 10) cases with different initial perturbations with the model were tested to show a consistent final spatial pattern. The results of only two different cases are shown in Fig. 4(c) and (f). Comparing these results from two models, we conclude that a reaction-diffusion model is sensitive to the location of the initial perturbations of molecules. In nature, the shape of the domain surrounding a brain and the initial perturbations of molecules may vary slightly between individuals within a species but the locations and the pattern of bone formation are similar across individuals. The results from the coupled reaction-diffusion-strain model suggest that local strain can be a factor that guides or contributes to the consistent distribution of key molecules.
Fig. 4.

Distribution of activator. (a) and (d) - two different sets of randomly distributed activator with 1% of perturbation at initial time. (b) and (e) - distribution of activator at E15 predicted by reaction-diffusion (R-D) model without consideration of strain effect for two different initial conditions. Different initial perturbations lead to different patterns of activator distribution. (c) and (f) - distribution of activator at E15 predicted by coupled reaction-diffusion-strain (R-D-ε) model for two different initial condition. Different initial perturbations lead to a consistent pattern of activator distribution.
3.2. Primary Centers of Ossification
Figure 5 shows the distribution of differentiated osteoblasts as estimated from Eq. (3). Regions of concentration of osteoblasts higher than a critical value (0.001 kg/m3) are shown opaque and lower than the value appear transparent. Five locations of high concentration of osteoblasts are found in the results and they are considered as the primary centers of ossification. The predicted locations agree with the positions of five bones of the cranial vault shown in the experimental observation (Fig. 1 (a)).
Fig. 5.
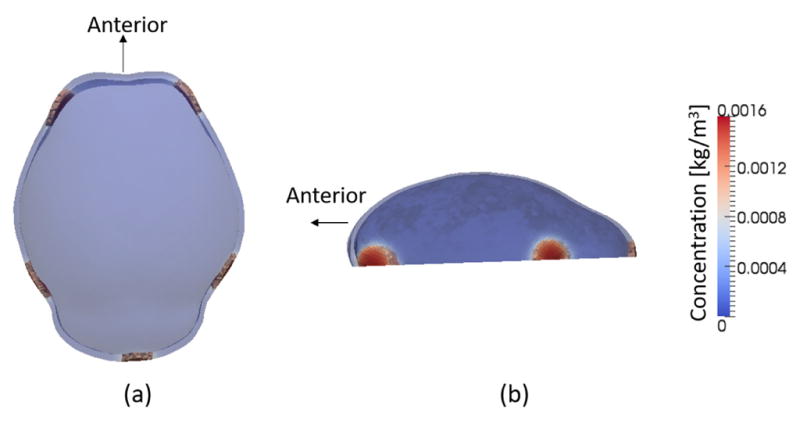
Primary centers of ossification (a) superior view (b) lateral view. The region of high concentration of osteoblasts (> 0.001 kg/m3) is shown opaque but elsewhere are transparent. Five locations of high concentration of osteoblast agree well with experimental observation (two frontal, two parietal and a single interparietal bone).
3.3. Bone Growth
Figure 6 shows the pattern of cranial vault bone growth predicted by the bone growth model (Eq. (4) and (5)). The results from the model (Fig. 6 (b)) are compared with the result from our previous model19 (Fig. 6 (a)) that does not consider strain effects (Eq. (4) and (5) with the boxed term removed). The regions of high concentration of differentiated osteoblasts (> 0.001 kg/m3) as represented in the computational results expand from the primary centers of ossification over time revealing areas absent of osteoblasts, that we consider the sutures between bones. The results predicted by the reaction-diffusion model that does not consider mechanical stimuli (Fig. 6 (a)) show that five bones, including the interparietal bone, grow with similar speed and meet at the top of the head at a faster rate than when growth is predicted using the coupled reaction-diffusion-strain model (Fig. 6 (b)). The results from the coupled model show that the growth of the interparietal bone is restricted due to high strain located apical to the bone (Fig. 3), modeling what is observed in experimental animals (Fig. 6 (c)) such that the interparietal bone is relatively smaller than the other bones (i.e., frontal and parietal bones) being constrained superoinferiorly. Growth of the other bones (frontals, parietals) towards the apex of the head is delayed, which is also observed experimentally. The computational results show some key features that accurately reflect our experimental observations. The left and right frontal bones grow faster in the circumferential direction than apically towards the center of the domain. Accelerated growth of the left and right frontal bones toward the parietal bones results in the formation of a suture that mimics the placement and morphology of the coronal suture that forms between the frontal and parietal bones in experimental observations. We present these features of the computational results as evidence of the key role of the distribution of mechanical strain in determining the locations of primary centers of ossification, the spatial-temporal pattern of bone growth, and the formation of the coronal suture (Fig. 3).
Fig. 6.

Bone growth. Change of region of high osteoblast concentration over time predicted by (a) reaction-diffusion model without consideration of mechanical strain and (b) coupled reaction-diffusion-strain model. The region of high concentration of osteoblasts (>0.001 kg/m3) is represented in the computational results. The regions of high concentration of osteoblast expand from primary centers of ossification over time resulting in sutures between bones. Computational results are compared with (c) experimental observations of the pattern of cranial vault bone growth in mouse as visualized by micro CT.
4. Discussion
One major difference between the computational predictions and experimental observations is the large area of undifferentiated mesenchymal cells between the parietal and interparietal bones in the experimental results that is not present in our computational results. Limitations of the current model may account for the observed difference. First, the initial morphology of the domain is based on data from a mouse aged E17.5, a time when ossification centers have formed and bones are in the process of growing. This morphology may differ enough from the morphology of the head at the initiation of ossification center formation to affect certain details of bone growth in our model. Second, the size and shape of the computational domain are fixed over time in this computational model, while the growing mouse head changes in size and shape over time (Fig. 6 (c)). Third, the model of bone growth is based on a baseline strain field in a homogeneous domain of mesenchymal tissue. As bones form in the pattern shown in Fig. 6, the strain distribution would change dramatically, since the new bone would have different material properties from those of mesenchymal cells. We expect the differences between predictions and observations to be reduced in future work by using a domain based on younger embryos, imposing the effect of growth of the domain and calculating strain field in each new time step based on the current distribution of mineralized bone and non mineralized tissue. Another improvement of our model is expected when we implement comparisons of our computational results with experimental observations using statistical approaches for the comparison of biological shapes31 or the quantitative evaluation of overlapping percentages of bone volume.
5. Conclusions
We have developed a computational framework to simulate the formation and growth of cranial vault bones in the embryonic mouse. We conducted a structural analysis to explore the mechanical effects on bone formation in the cranial vault. The results of the structural analysis show that the distribution of mechanical strain over the cranial surface has a strong effect on the pattern of bone formation such that bone does not form in areas of high strain. Based on the hypothesis that high strain suppresses differentiation of mesenchymal cells, the previously published reaction-diffusion model19 was coupled with the effect of strain on cell differentiation. The coupled reaction-diffusion-strain model for regulation of key molecules predicts a consistent pattern of distribution of activator molecules regardless of different initial perturbations. The model predicts the formation of five locations of high concentration of activator that matches the positions of initial bone formation in experimental observations. This contrasts with a previous reaction-diffusion model that predicts various patterns of activator distribution depending on the change in the initial perturbations. These results suggest the importance of mechanical strain in determining the distribution of molecules important for osteoblast differentiation and, in turn, the locations of primary centers of ossification for bones of the cranial vault in mice. The coupled reaction-diffusion-strain model for cranial vault bone growth predicts patterns of cranial vault growth consistent with experimental observations. Bones form from primary centers of ossification and sutures form between growing bones as the leading edges of opposing bones meet. Growth of the interparietal bone is constrained apically relative to other cranial vault bones due to high strain at the apex of the forming head. This reflects experimental observations of the pattern of growth of the interparietal bone in developing mice.
Although our model for now has some limitations described in section 4, it provides an explanation for the positioning of forming ossification centers, cranial vault bone growth and the positioning of cranial vault sutures by suggesting important roles of mechanical strain in the process. The model has important implications for understanding changes in cranial vault shape and size in development, changes in those patterns due to genetic disease and patterning of the cranial vault in evolution of the mammalian skull.
Acknowledgments
This work was supported in part through instrumentation funded by the National Science Foundation through grant OCI0821527, a Burroughs-Wellcome Fund 2013 Collaborative Research Travel Grant, Pa. Department of Health using Tobacco Cure Funds and by National Institutes of Health grants R01DE022988 and P01HD078233. The content is solely the responsibility of the authors and does not necessarily represent the official views of the National Institutes of Health.
Contributor Information
CHANYOUNG LEE, The Penn State Computational Biomechanics Group, Department of Mechanical and Nuclear Engineering, The Pennsylvania State University, 341 Leonhard Building, University Park, PA 16802.
JOAN T. RICHTSMEIER, Department of Anthropology, The Pennsylvania State University, 409 Carpenter Building, University Park, PA 16802
REUBEN H. KRAFT, The Penn State Computational Biomechanics Group, Department of Mechanical and Nuclear Engineering, Department of Biomedical Engineering, The Pennsylvania State University, 320 Leonhard Building, University Park, PA 16802.
References
- 1.Percival CJ, Richtsmeier JT. Angiogenesis and intramembranous osteogenesis. Dev Dyn. 2013;242:909–922. doi: 10.1002/dvdy.23992. [DOI] [PMC free article] [PubMed] [Google Scholar]
- 2.Long F. Building strong bones: molecular regulation of the osteoblast lineage. Nat Rev Mol Cell Biol. 2011;13:27–38. doi: 10.1038/nrm3254. [DOI] [PubMed] [Google Scholar]
- 3.Bellido T, Plotkin LI, Bruzzaniti A. Bone cells. In: Burr DB, Allen MR, editors. Basic and applied bone biology. Academic Press; London: 2013. pp. 27–45. [Google Scholar]
- 4.Plotkin LI, Bivi N. Local regulation of bone cell function. In: Burr DB, Allen MR, editors. Basic and applied bone biology. Academic Press; London: 2013. pp. 47–73. [Google Scholar]
- 5.Holleville N, Quilhac A, Bontoux M, Monsoro-Burq AH. BMP signals regulate Dlx5 during early avian skull development. Dev Biol. 2003;257:177–189. doi: 10.1016/s0012-1606(03)00059-9. [DOI] [PubMed] [Google Scholar]
- 6.Wan M, Cao X. BMP signaling in skeletal development. Biochem Biophys Res Commun. 2005;328:651–657. doi: 10.1016/j.bbrc.2004.11.067. [DOI] [PubMed] [Google Scholar]
- 7.Cullinane DM, Salisbury KT, Alkhiary Y, Eisenberg S, Gerstenfeld L, Einhorn TA. Effects of the local mechanical environment on vertebrate tissue differentiation during repair: does repair recapitulate development? J Exp Biol. 2003;206:2459–2471. doi: 10.1242/jeb.00453. [DOI] [PubMed] [Google Scholar]
- 8.Geris L, Gerisch A, Maes C, Carmeliet G, Weiner R, Vander Sloten J, Van Oosterwyck H. Mathematical modeling of fracture healing in mice: comparison between experimental data and numerical simulation results. Med Biol Eng Comput. 2006;44:280–289. doi: 10.1007/s11517-006-0040-6. [DOI] [PubMed] [Google Scholar]
- 9.Palomares KTS, Gleason RE, Mason ZD, Cullinane DM, Einhorn TA, Gerstenfeld LC, Morgan EF. Mechanical stimulation alters tissue differentiation and molecular expression during bone healing. J Orthop Res. 2009;27:1123–1132. doi: 10.1002/jor.20863. [DOI] [PMC free article] [PubMed] [Google Scholar]
- 10.Maul TM, Chew DW, Nieponice A, Vorp DA. Mechanical stimuli differentially control stem cell behavior: morphology, proliferation, and differentiation. Biomech Model Mechanobiol. 2011;10:939–953. doi: 10.1007/s10237-010-0285-8. [DOI] [PMC free article] [PubMed] [Google Scholar]
- 11.Subramony SD, Dargis BR, Castillo M, Azeloglu EU, Tracey MS, Su A, Lu HH. The guidance of stem cell differentiation by substrate alignment and mechanical stimulation. Biomaterials. 2013;34:1942– 1953. doi: 10.1016/j.biomaterials.2012.11.012. [DOI] [PMC free article] [PubMed] [Google Scholar]
- 12.Turing AM. The chemical basis of morphogenesis. Philos Trans R Soc London, Ser B. 1952;237:37–72. [Google Scholar]
- 13.Sugimura K, Shimono K, Uemura T, Mochizuki A. Self-organizing mechanism for development of space-filling neuronal dendrites. PLoS Comput Biol. 2007;3:e212. doi: 10.1371/journal.pcbi.0030212. [DOI] [PMC free article] [PubMed] [Google Scholar]
- 14.Kondo S, Shirota H. Theoretical analysis of mechanisms that generate the pigmentation pattern of animals. Semin Cell Dev Biol. 2009;20:82–89. doi: 10.1016/j.semcdb.2008.10.008. [DOI] [PubMed] [Google Scholar]
- 15.Marcon L, Sharpe J. Turing patterns in development: what about the horse part? Curr Opin Genet Dev. 2012;22:578–584. doi: 10.1016/j.gde.2012.11.013. [DOI] [PubMed] [Google Scholar]
- 16.Garzón-Alvarado DA, González A, Gutiérrez ML. Growth of the flat bones of the membranous neurocranium: A computational model. Comput Methods Programs Biomed. 2013;112:655–664. doi: 10.1016/j.cmpb.2013.07.027. [DOI] [PubMed] [Google Scholar]
- 17.Raspopovic J, Marcon L, Russo L, Sharpe J. Digit patterning is controlled by a bmp-sox9-wnt turing network modulated by morphogen gradients. Science. 2014;345:566–570. doi: 10.1126/science.1252960. [DOI] [PubMed] [Google Scholar]
- 18.Lee C, Richtsmeier JT, Kraft RH. ASME 2014 International Mechanical Engineering Congress and Exposition. American Society of Mechanical Engineers; 2014. A multiscale computational model for the growth of the cranial vault in craniosynostosis; pp. V009T12A061–V009T12A061. [DOI] [PMC free article] [PubMed] [Google Scholar]
- 19.Lee C, Richtsmeier JT, Kraft RH. A Computational Analysis of Bone Formation in the Cranial Vault in the Mouse. Front Bioeng Biotechnol. 2015;3:1–11. doi: 10.3389/fbioe.2015.00024. [DOI] [PMC free article] [PubMed] [Google Scholar]
- 20.Claes LE, Heigele Ca. Magnitudes of local stress and strain along bony surfaces predict the course and type of fracture healing. J Biomech. 1999;32:255–266. doi: 10.1016/s0021-9290(98)00153-5. [DOI] [PubMed] [Google Scholar]
- 21.Guevara J, Moncayo M, Vaca-González J, Gutiérrez M, Barrera L, Garzón-Alvarado D. Growth plate stress distribution implications during bone development: A simple framework computational approach. Comput Methods Programs Biomed. 2015;118:59–68. doi: 10.1016/j.cmpb.2014.10.007. [DOI] [PubMed] [Google Scholar]
- 22.Moazen M, Alazmani A, Rafferty K, Liu ZJ, Gustafson J, Cunningham ML, Fagan MJ, Herring SW. Intracranial pressure changes during mouse development. J Biomech. 2016;49:123– 126. doi: 10.1016/j.jbiomech.2015.11.012. [DOI] [PubMed] [Google Scholar]
- 23.Kawasaki K, Richtsmeier JT. Association of the chondrocranium and dermatocranium in early skull development. In: Percival CJ, Richtsmeier JT, editors. Building Bones: Early bone development informing anthropological inquiry. Campbridge University Press; 2015. pp. 52–78. [Google Scholar]
- 24.Weller HG, Tabor G, Jasak H, Fureby C. A tensorial approach to computational continuum mechanics using object-oriented techniques. Comput Phys. 1998;12:620–631. [Google Scholar]
- 25.Oshio K, Watanabe H, Song Y, Verkman aS, Manley GT. Reduced cerebrospinal fluid production and intracranial pressure in mice lacking choroid plexus water channel Aquaporin-1. FASEB J. 2005;19:76–78. doi: 10.1096/fj.04-1711fje. [DOI] [PubMed] [Google Scholar]
- 26.Pillarisetti A, Desai JP, Ladjal H, Schiffmacher A, Ferreira A, Keefer CL. Mechanical phenotyping of mouse embryonic stem cells: increase in stiffness with differentiation. Cell Reprogramming. 2011;13:371–380. doi: 10.1089/cell.2011.0028. [DOI] [PubMed] [Google Scholar]
- 27.Carter DR, Blenman PR, Beaupr GS. Correlations between mechanical stress history and tissue differentiation in initial fracture healing. J Orthop Res. 1988;6:736–748. doi: 10.1002/jor.1100060517. [DOI] [PubMed] [Google Scholar]
- 28.Gierer A, Meinhardt H. A theory of biological pattern formation. Kybernetik. 1972;12:30–39. doi: 10.1007/BF00289234. [DOI] [PubMed] [Google Scholar]
- 29.Murray JD. Mathematical biology I: an introduction, Vol. 17 of interdisciplinary applied mathematics. Springer; New York: 2002. [Google Scholar]
- 30.Komori T. Regulation of osteoblast differentiation by runx2. In: Choi Y, editor. Osteoimmunology: Interactions of the Immune and skeletal systems II. Springer US; Boston, MA: 2010. pp. 43–49. [Google Scholar]
- 31.Lele SR, Richtsmeier JT. An invariant approach to statistical analysis of shapes. CRC Press; 2001. [Google Scholar]