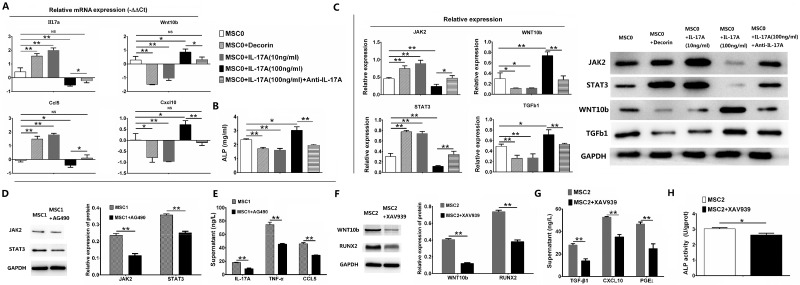
Figure 2. Signal pathways of MSC1 and MSC2 polarizations.
Values are the mean ± SEM (all n = 3). *P < 0.05, **P < 0.01. (A) The relative mRNA expression of murine MSCs in RT-qPCR for Il17a, Ccl5, Cxcl10 and Wnt10b. (B) ALP acitivity for murine MSCs. (C) The relative protein expression of murine MSCs in western blotting for JAK2, STAT3, WNT10b and TGFb1. (D) The relative protein expression of MSC1 in western blotting for JAK2 and STAT3 after adding AG490 (inhibitor of JAK2). (E) The supernatant analysis of MSC1 in Elisa for IL-17A, TNF-α and CCL5 after adding AG490. (F) The relative protein expression of MSC2 in western blotting for WNT10b and RUNX2 after adding XAV939 (inhibitor of WNT10b). (G) The supernatant analysis of MSC1 in Elisa for TGF-β1, CXCL10 and PGE2 after adding XAV939. (H) ALP acitivity of MSC2 after adding XAV939.

