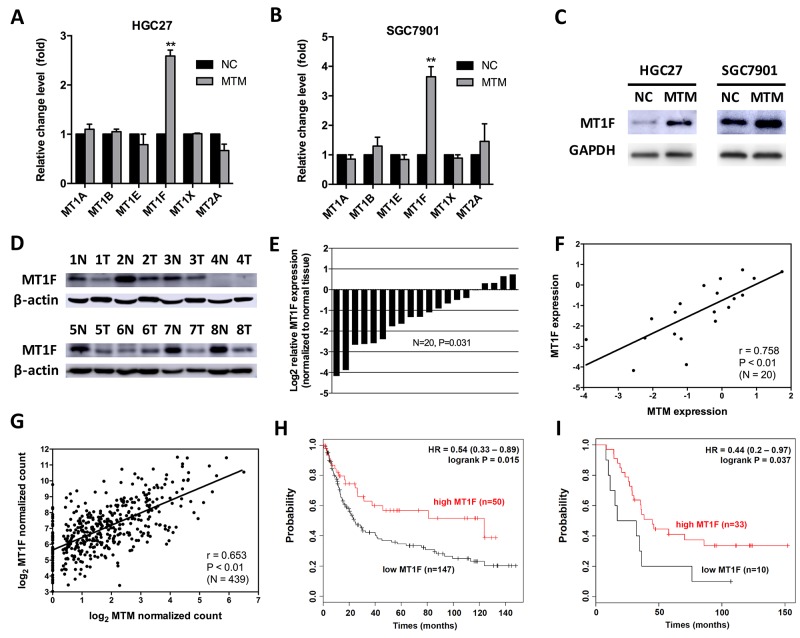
Figure 4. MTM and MT1F are coordinately expressed in gastric cancer (GC).
(A, B) The mRNA levels of 6 MTs in MTM-overexpressing GC cells. Data are presented as the mean ± SD (n=3, **P<0.01). (C) The protein level of MT1F in MTM-overexpressing GC cells. (D) The protein level of MT1F in 8 representative matched normal gastric mucosa -GC tissue pairs (N: normal, T: tumor). (E) MT1F was significantly decreased in 20 GC tissues. Expression levels are shown as log2-fold change to matching normal gastric mucosa tissues. (F) Expression levels of MTM and MT1F were significantly correlated in GCs (n=20, r=0.815, P<0.01). (G) Correlation of MTM and MT1F mRNA levels in human GCs from TCGA dataset (n=439, r=0.653, P<0.01). (H) Kaplan-Meier curves for relapse-free survival of GC patients classified by MT1F expression (GEO: GSE15459). (I) Kaplan-Meier curves for relapse-free survival of GC patients classified by MT1F expression (GEO: GSE22377).

