Abstract
In the brain mapping field, there have been significant interests in representation of structural/functional profiles to establish structural/functional landmark correspondences across individuals and populations. For example, from the structural perspective, our previous studies have identified hundreds of consistent DICCCOL (dense individualized and common connectivity-based cortical landmarks) landmarks across individuals and populations, each of which possess consistent DTI-derived fiber connection patterns. From the functional perspective, a large collection of well-characterized HAFNI (holistic atlases of functional networks and interactions) networks based on sparse representation of whole-brain fMRI signals have been identified in our prior studies. However, due to the remarkable variability of structural and functional architectures in the human brain, it is challenging for earlier studies to jointly represent the connectome-scale structural and functional profiles for establishing a common cortical architecture which can comprehensively encode both structural and functional characteristics across individuals. To address this challenge, we propose an effective computational framework to jointly represent the structural and functional profiles for identification of consistent and common cortical landmarks with both structural and functional correspondences across different brains based on DTI and fMRI data. Experimental results demonstrate that 55 structurally and functionally common cortical landmarks can be successfully identified.
Keywords: Cortical landmarks, DTI, fMRI, brain architecture
1. Introduction
After decades of active research, one of the significant challenges in the brain mapping field is to define comparable brain regions, or regions of interest (ROIs), across individual subjects. This same challenge also remains as the major barrier to connectome mapping in the human brain, that is, the lack of a quantitatively-encoded representation of common brain architectures, e.g., via connectome nodes, that can be precisely replicated and predicted across individuals and populations. In our view, both challenges originate from the tremendous individual variability of the human brains. First, there exists remarkable variability in the human brain anatomy between individuals, which has been studied by multiple research areas such as brain image registration and cortical parcellations (e.g., Brett M et al., 2002; Fischl B et al., 2002; Jbabdi S et al., 2009; Johansen-Berg H et al., 2004;Li G et al., 2009; Shen and Davatzikos, 2002; Rettmann M E et al., 2002; Stankiewicz P et al., 2010; Van Essen D C and Dierker D L, 2007); Second, there is tremendous variability of human brain function across individuals, as discussed in many previous papers, such as in Brett M et al., 2002; Pessoa et al., 2012; Anderson M L et al., 2013.
In attempts to address the abovementioned challenges, we have developed the DICCCOL (dense individualized and common connectivity-based cortical landmarks) (Zhu D et al., 2012; Zhu D et al., 2012; Yuan Y et al., 2013; Zhu D et al., 2014; Jiang X et al., 2015b; Zhang T et al., 2016) and HAFNI (holistic atlases of functional networks and interactions) (Lv et al., 2015a; Lv et al., 2015b; Lv et al., 2015c; Zhao S et al., 2015; Zhang S et al., 2016; Zhao Y et al., 2016) systems to define common and consistent structural and functional landmarks based on DTI and fMRI data, respectively. Briefly, our DICCCOL studies have identified hundreds of consistent cortical landmarks across human individuals and populations, each of which possess consistent DTI-derived fiber connection patterns (e.g., Zhu D et al., 2012; Zhu D et al., 2012; Yuan Y et al., 2013; Jiang X et al., 2015b). However, this method is focused on the DTI data only and the functional roles of those DICCCOLs remain to be elucidated. More recently, our HAFNI studies found that connectome-scale well-characterized functional brain networks (including both task-evoked networks and intrinsic connectivity networks) can be effectively and robustly reconstructed by using sparse coding on the fMRI data (Lv J et al., 2015; Zhang S et al., 2013; Zhang S et al., 2016; Zhao S et al., 2015; Zhao Y et al., 2016). However, the series of HAFNI studies were based on fMRI data only and the structural underpinning of these consistent functional networks remains to be revealed.
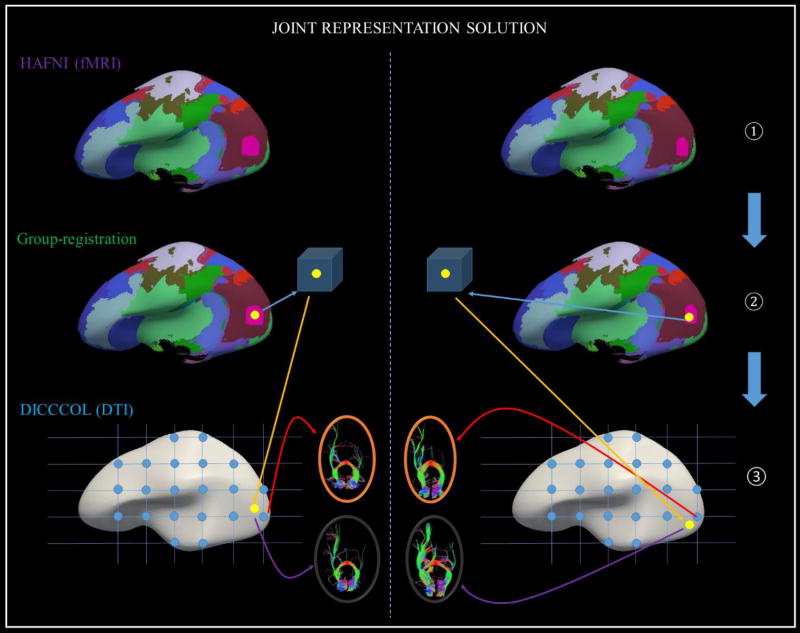
To address the abovementioned weaknesses of DICCCOL and HAFNI systems while leveraging their major strengths, in this paper, we propose a novel computational framework to jointly represent connectome-scale functional and structural profiles for identification of consistent and common cortical landmarks with both reasonably accurate structural and functional correspondences across different human brains based on multimodal DTI and fMRI data. This framework has the following major methodological novelties over the DICCCOL and HAFNI systems alone. First, instead of using roughly sampled grid points in a template brain as the initialized landmarks in the original DICCCOL discovery system (illustrated as blue dots shown in Fig.1-③), in this paper, we aim to add the functional guidance informed by HAFNI networks into the step of initializing landmarks (as shown in Step ① and Step ② of Fig.1). That is, we use the peak foci (as illustrated as yellow dots in Step ② of Fig.1) derived from HAFNI networks to initialize the landmarks. Then, those landmarks are initialized with functional meaning and annotations, followed by a groupwise optimization procedure to determine their final locations in a group of subjects. Second, a groupwise image registration scheme will be applied (as illustrated in Step ② of Fig.1) to efficiently decide the final corresponding locations of those initialized landmarks in the specific individual image spaces of all of the subjects. Finally, a new set of HAFNI-informed common and consistent DICCCOL cortical landmarks across human individuals and populations are obtained. These common cortical landmarks jointly represent connectome-scale structural and functional profiles of brain ROIs and also exhibit common structural and functional architectures of the human brain.
Fig 1.
Conceptual illustration of joint representation of connectome-scale structural and functional profiles for identification of consistent cortical landmarks by fusing DICCCOL and HAFNI methods. There are three major steps in this framework: using HAFNI method to derive functional peak foci (Step ①), groupwise registration of those functional foci in a group of subjects (Step ②), and using DICCCOL methods to optimize the initialized landmarks (Step ③) towards their final locations with both functional and structural consistency. Here, two exemplar individual subjects are shown and separate by the dashed blue line. In Step ①, consistent HAFNI networks are coded by corresponding colors in two exemplar subjects. In Step ②, yellow dots on the inflate cortical surfaces represent the HAFNI peak foci for one functional network (pink one). The groupwise registration will be applied on all the ROIs represented by the yellow dots across individual subjects. In Step ①, landmark initialization will be based on the corresponding functional foci (yellow dots) after groupwise registration in Step ②, and landmark optimization will be performed based on the groupwise consistency of structural connectivity patterns.
2. Materials and Methods
2.1 Overview
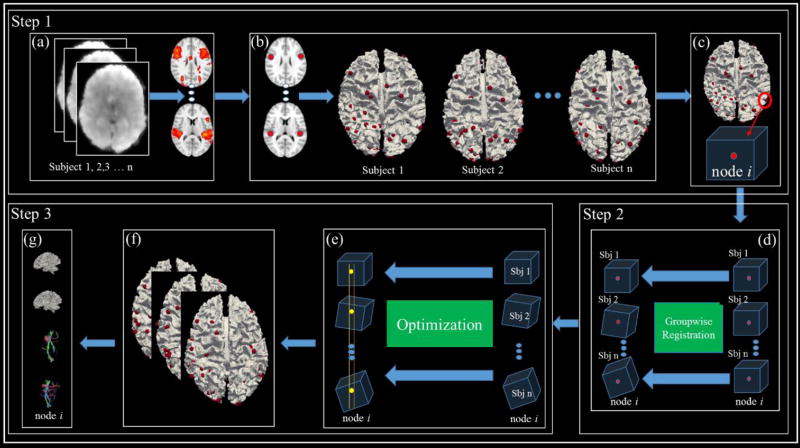
The three steps in the conceptual illustration of our framework in Fig.1 are further specifically detailed in Fig.2 (marked as Step1–3 in Fig.2). In Step 1, sparse representation of whole-brain fMRI data is conducted in each subject (a), after which relatively consistent HAFNI networks are identified for all involved subjects (b). Then, a cubic ROI is generated for those most consistent HAFNI network peak foci for each subject (c). Notably, each cubic ROI is defined in an individual’s own image space with rough correspondence across different brains. In Step 2, an effective groupwise registration method is employed to register the corresponding ROIs from different subjects into a common space. These registered ROIs will be used to initialize the landmarks in each subject for the next step of landmark optimization in Step 3 (e). In Step 3, the joint constraint of consistent connectome-scale structural and functional profiles for each initialized ROI will be enforced for landmark location optimization methodologies. For each subject with multimodal DTI and fMRI data, a landmark identification procedure (e–f) can be performed to locate those HAFNI-informed DICCCOL consistent landmarks. The output of this procedure will be the accurately located common and consistent landmarks in each individual brain (g).
Fig 2.
The pipeline of the proposed computational framework. Please refer to the details of each step in the main text.
2.2 Data Acquisition and Pre-processing
The dataset used in this study was obtained from the Human Connectome Project Q1 release (Barch D M, et al., 2013; Van Essen DC, et al., 2013). The acquisition parameters of task fMRI (tfMRI) data are as follows: 90×104 matrix, 220mm FOV, 72 slices, TR=0.72s, TE=33.1ms, flip angle = 52°, BW=2290 Hz/Px, in-plane FOV = 208×180 mm, 2.0 mm isotropic voxels. For tfMRI images, the preprocessing pipelines included skull removal, motion correction, slice time correction, spatial smoothing, and global drift removal. All of these steps are implemented by FMRIB Software Library (FSL) FEAT (Woolrich et al., 2009). For comparison of results, the general linear model (GLM)-based activation is also performed individually and group-wisely using FSL FEAT. Task stimulus curves are convoluted with the double gamma hemodynamic response function and set as regressors of GLM. The contrast based statistical parametric mapping is carried out with t-test and p<0.05 (with cluster correction) and is used to reject false positive. Multi-level z-scores are used to map multi-scale activations. In the group level, the statistical parametric mapping is carried out with mixed-effect model included in the FSL FEAT tool. For the resting state fMRI (rsfMRI) data, the acquisition parameters are as follows: 2×2×2 mm spatial resolution, 0.72 s temporal resolution, and 1200 time points. The pre-processing of rsfMRI data also include skull removal, motion correction, slice time correction, and spatial smoothing. More detailed rsfMRI preprocessing can be referred to the literature report (Lv J et al., 2015). For diffusion imaging data, the parameters are as follows: Spin-echo EPI, TR 5520 ms, TE 89.5 ms, flip angle 78 deg, refocusing flip angle 160 deg, FOV 210×180 (RO × PE); matrix 168×144 (RO × PE), slice thickness 1.25 mm, 111 slices, 1.25 mm isotropic voxels, Multiband factor 3, and Echo spacing 0.78 ms. Please refer to (Uğurbil K et al., 2013; Barch D M, et al., 2013) for more details.
2.3 Landmark Initialization
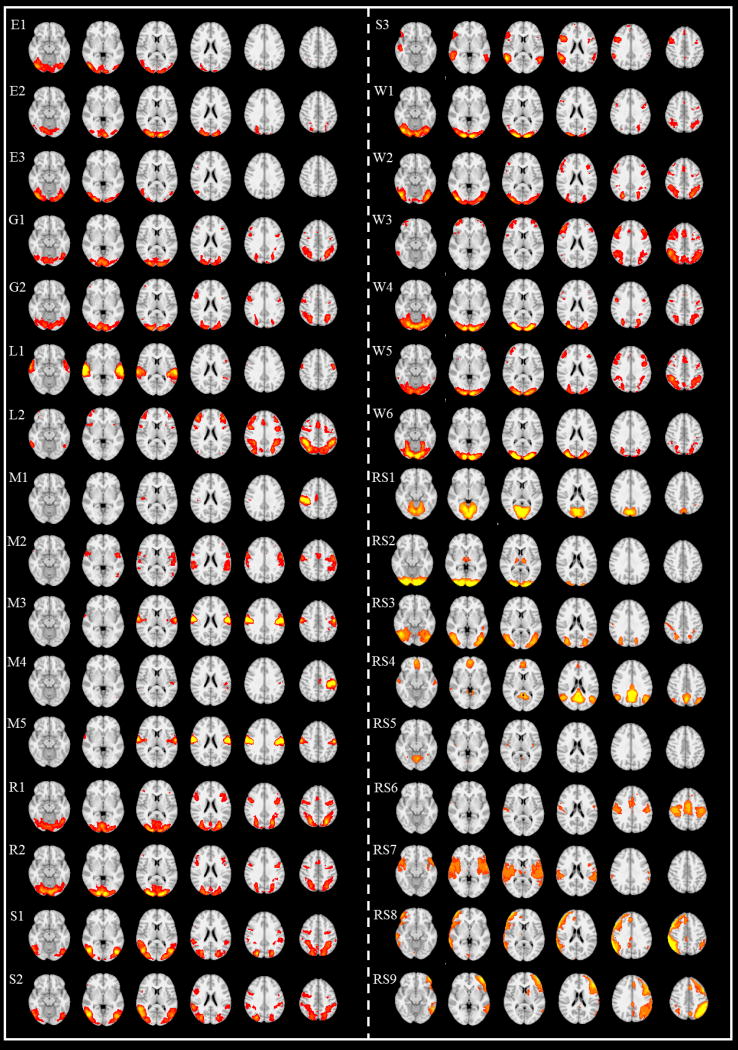
As shown in Figs. 2a–2b, landmark locations are initialized by applying the HAFNI method (Lv et al., 2015). Briefly, we first obtain 32 group-wise consistent and meaningful functional networks across different human brains via dictionary learning and sparse coding of HCP fMRI data using similar methods in (Lv J et al., 2015). Examples of those 32 consistent networks are shown in Fig.3. Then, we automatically identify functional components in each functional network by using the widely adopted connected component labeling (CCL) algorithm implemented in FSL toolbox in each individual brain (http://fsl.fmrib.ox.ac.uk). The basic idea is that, by searching the neighborhood of all voxels involved in a specific functional network, those connected voxels involved in the functional network are assigned to the same component. In this way, each functional network may have one or more components (e.g., each network in Fig.2a has two components). In order to obtain meaningful, stable and consistent functional components across different subjects, we need to carefully consider the smallest size of the components that we should adopt in this work. As we know, small components can be involved in the consistent networks, however, they are possibly very variable across the different subjects, e.g., such small region may not exist in some specific subjects. Thus, we tested the sizes of the components that we should adopt and consider from 100 to 1000 voxels with an interval of 100. When the size approaches 500, all the studied subjects have exactly the same number of the components in each network. Therefore, 500 is a quite acceptable threshold, and those cluster nodes with less than 500 voxels will be discarded in this work. After these common and consistent networks and their connected components are identified in each subject, we identify all the peak foci with the highest functional activities within each network as the initial locations of landmarks to be optimized. Fig.3 shows these 32 consistent networks and their peak foci in representative slices.
Fig 3.
The 32 identified common consistent functional brain networks. Six axial slices in each row represent one functional network. The name of the network is shown on the top left. E is short for emotion task, G for gambling task, L for language task, M for motor task, R for relational task, S for social task, W for working memory task, and RS for resting state.
Afterwards, for each of the above initialized landmark, we define an ROI as a 3D cube to include structural and functional profiles around each landmark, as shown in Fig. 2c. Specifically, within the 3D cube centered on the landmark, the functional network intensities (the loading coefficients after dictionary learning and sparse representation) will be profiled and included. As the fMRI data has already been registered with DTI data for each subject, the DTI-derived fibers that penetrate the 3D cube will be extracted and profiled too. Finally, only those voxels in the 3D cube that possess both strong functional activities and DTI-derived fiber connections will be kept as the key binarized foreground voxels (with the threshold empirically determined) inside the initialized landmark for the next step of group-wise registration.
2.4 Groupwise Registration of Initialized Landmarks
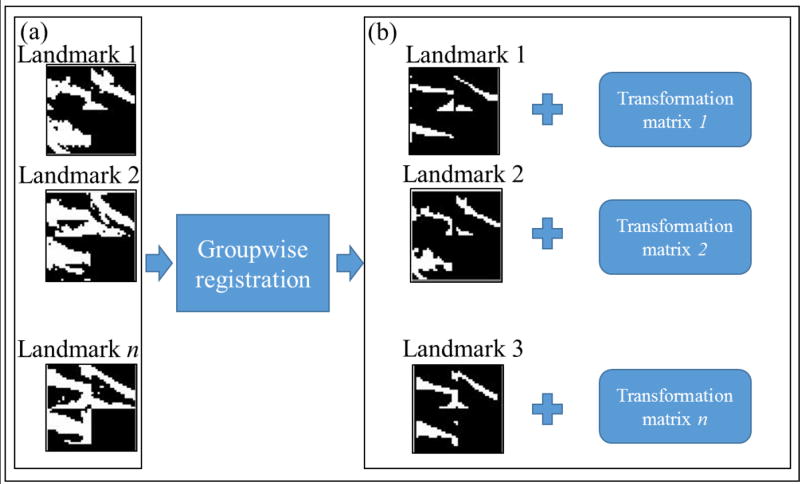
As shown in Fig. 2d, a groupwise registration approach is employed in this study to align the above initialized landmarks in Section 2.3. Here, we employ an effective groupwise registration framework that utilizes a hierarchical image clustering and atlas synthesis strategy (Wang et al., 2010). After running the groupwise registration method, all the corresponding initialized landmarks will be mapped into a common space, and thus they will have rough voxel-to-voxel correspondences. The advantage of this approach is that we can not only achieve higher registration accuracy than other pair-wise registration methods (Wang et al., 2010), but also significantly speed up the time-consuming registration process. As illustrated in Fig.4, the inputs to the group-wise registration are the initialized 3D cube landmarks with binarized structural and functional profiles in a group of subjects. After the groupwise registration procedure, all of those landmarks are aligned into a common space. It is noted that we obtain and apply a transformation matrix for each landmark, after which they will have rough voxel-to-voxel correspondences across different brains.
Fig 4.
Illustration of using groupwise registration for initialized landmarks. (a) Three initialized landmarks in three subjects. (b) Registered and aligned landmarks.
2.5 Landmark Optimization
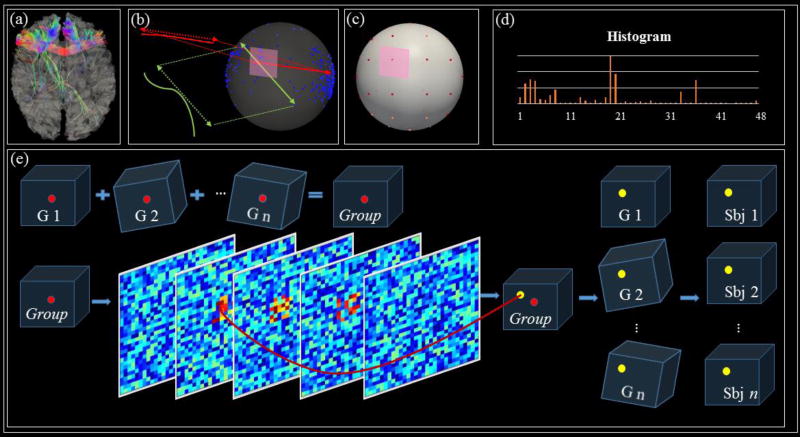
The goal of the optimization step is to adjust the locations of initialized landmarks according to an optimization objective and thus determine the final locations of those landmarks. Specifically, in this study, we aim to maximize the similarities between the ‘trace-maps’ of DTI-derived fiber bundles for those initialized landmarks, in a similar way as those in (Chen H et al., 2013; Zhu D et al., 2012). To be self-contained, we briefly describe the ‘trace-map’ representation and comparison of the DTI-derived structural fiber connection pattern. The “trace-map” method is shown in Fig.5a-5d by projecting each beginning and ending point of each fiber from fiber bundles (Fig.5b) onto the uniform spherical surface. Then, we divide the surface into 48 equal areas and construct histogram for each area, which are then represented as the feature vectors. A 48 dimensional histogram vector tr = [d1, d2‥d48] containing 48 density values, namely ‘trace-map’ (Fig.5d), is finally obtained as the structural profile of the landmark under consideration. By calculating the trace-map vectors, fibers penetrating to the landmark can thus be represented by 48-dimension vectors, instead of 3D shapes or images, which enables the quantitative measurements of structural connectivity patterns and similarities for the landmark optimization (Zhu D et al., 2012). The actual landmark optimization procedure within the training samples is briefly illustrated in Fig. 5e. Since those 3D cube landmarks are already binarized and they have rough voxel-to-voxel correspondence with each other, so the group-mean 3D cube landmark is simply obtained by adding 3D cube landmarks together. Then, voxels from the group-mean 3D cube with large values will be picked up, and the further round of searching is applied onto those voxels to identify the final location of the landmark by pursuing the landmark with maximum average correlation of trace-map vectors among all the subjects. In this way, the optimized landmark is obtained in the common space, and then the transformation matrix will be used to transfer the identified landmark back into the individual DTI surface.
Fig 5.
The pipeline of ‘trace-map’ representation for representation of structural connectivity profile of landmarks. (a) An example of a landmark’s fiber bundle and cortical surface. (b) Points distribution by projection of the principal orientations of points of each fiber onto the unit sphere. (c) 48 equally-sized areas from one uniform sphere are shown. (d) 48-dimension vectors are used to represent one landmark’s fiber bundles. (e) The optimization step. The red bubbles are the initial landmarks, and yellow bubbles represent the locations after optimization.G1, G2 … Gn are landmarks in common space, and are landmarks transformed into individual spaces.
3. Experimental Results
3.1 Identified Consistent Cortical Landmarks
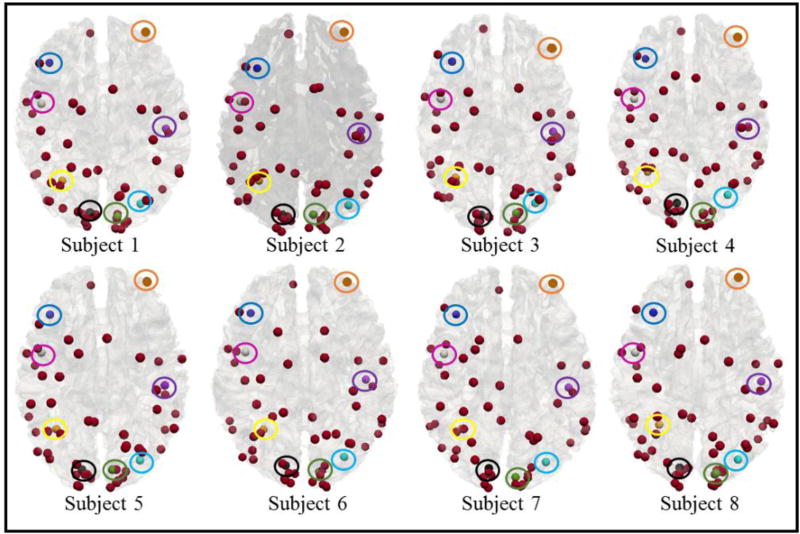
After applying the computational framework in Sections 2.3–2.5 on eight randomly selected subjects from HCP dataset, we have identified totally 57 consistent and common cortical landmarks in all 8 subjects, as shown in Fig.6 (colored bubbles). Specifically, we originally identified 65 peak foci from 32 consistent common functional brain networks (Fig.3), where 57 of them are located on the cortical cortex. After the optimization procedure, all of these 57 cortical peak foci remained as consistent and common cortical landmarks. In this set of 57 landmarks, 30 of them are located on the left hemisphere and the rest are located on the right side, suggesting that these consistent landmarks are relatively symmetrical on both hemispheres. It is noted that more consistent landmarks are distributed in the parietal and occipital lobes, while less consistent landmarks belong to the frontal and temporal lobes, which is in agreement with known neuroscience knowledge that there is more variability in the frontal and temporal lobes.
Fig 6.
Visualization of 57 consistent and common cortical landmarks in 8 subjects. Specifically, in this figure, 8 of those 57 common landmarks are highlighted with different colored circles to provide correspondences in different subject brains.
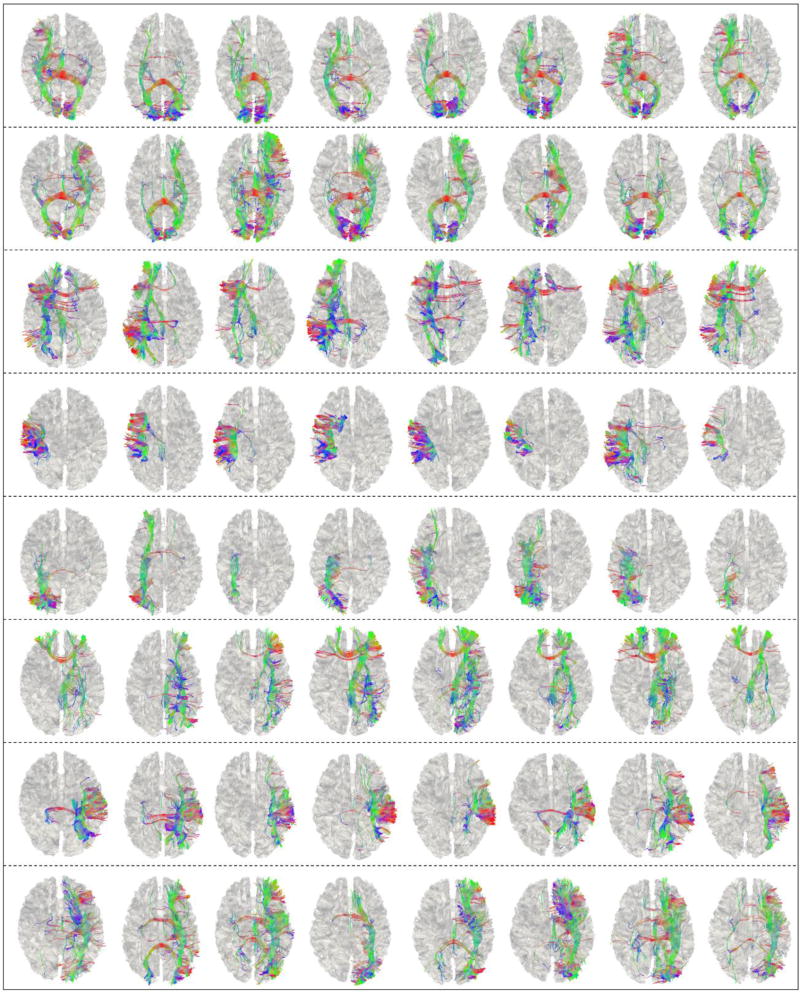
In order to visualize these consistent and common cortical landmarks in more details, we randomly chose 8 landmarks here as examples. The locations of those 8 selected landmarks are highlighted by the circles with different colors in Fig.6. Here, the same color denotes the correspondence across 8 subjects. In addition, the shapes of the fiber bundles connected to these landmarks are provided in Fig.7. From Fig.6 and Fig.7, we can observe that these consistent and common cortical landmarks have reasonable anatomical and structural connectivity consistency across different subjects, despite their noticeable variability. Quantitatively, the mean correlation of ‘trace-map’ across any pair of the eight subjects in Fig.7 are 0.66, 0.70, 0.50, 0.752, 0.74, 0.80, 0.65 and 0.70, respectively. The overall mean correlation of “trace-map” of all 57 common landmarks in these 8 different subjects is as high as 0.69, which suggests good correspondence of these landmarks across different brains. Besides, the corresponding landmarks across these subjects are from the same functional networks, which means that these landmarks also possess functional correspondence and consistence. In other words, each consistent and common cortical landmark in Fig.6 has three types of consistency: 1) anatomical consistency, 2) structural connectivity consistency and 3) functional consistency. In order to further demonstrate the effectiveness of our proposed framework, we will explain these three different aspects in more details in Sections 3.2 to 3.4, respectively.
Fig 7.
DTI-derived fiber bundles of those 8 highlighted landmarks (by colored circles) in Fig.6 for 8 subjects. Different rows (from top to bottom) correspond to the black, green, dark blue, pink, yellow, brown, purple, and light blue circles in Fig.6, respectively.
3.2 Comparisons between Initialized and Optimized Consistent Cortical Landmarks
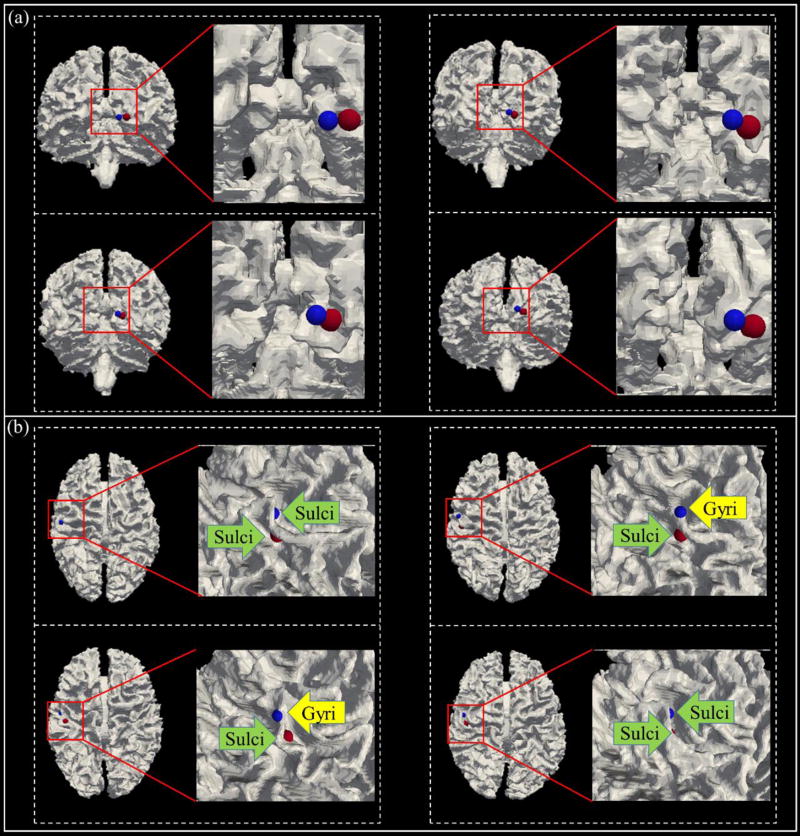
In order to show the effectiveness of our framework, here we visualize 4 representative examples and their comparisons in Fig.8. As we can observe from this figure, there are mainly two scenarios by our optimization framework. One is shown in Fig.8a, in which the initialized and optimized landmarks have quite similar locations. That is, there is no big difference between them, and the Euclidean distance of spatial movement of these landmarks before and after optimization is around or less than 2 mm. Interestingly, there is another scenario, which occur quite often, with significant improvement by our landmark optimization procedure. For instance, the initial landmarks may have inconsistent locations (i.e., blue landmarks of Fig.8b), e.g., some of them may distribute on the gyri, but others may locate on the sulci. After applying the optimization framework, we can see that the optimized landmarks (red bubbles) are finally located with much better consistency, e.g., as shown in Fig.8b, all the landmarks with red color are finally consistently located on the sulci. The Euclidean distance of spatial movement of these landmarks before and after optimization is larger than the first scenario, typically within the range of 2–14 mm. Quantitatively, the Euclidean distance of spatial location movement of all 57 landmarks before and after optimization is 11.45 mm in 8 subjects, indicating that the landmark optimization procedure is really needed to reallocate those 57 initialized landmarks to their corresponding locations in different brains. Here we would like to emphasize that this movement is an important indicator that the proposed method is effective in adjusting the locations of the landmarks. For example, as we know, the usual movement of landmarks between DICCCOL (Zhu et al., 2012) method and FSL linear registration algorithm is about 3 mm, however, the functional profiles are not considered in that case. In this paper, larger movement is needed due to the objective of pursuing functional consistency.
Fig 8.
Comparison between initialized landmarks and optimized landmarks. In each panel (a&b), one consistent and common cortical landmark is presented by 4 dashed boxes, each dashed box includes one landmark example in one subject. Blue bubbles are the initialized locations of the functional peak foci, and red ones are the landmarks after the optimization. Location of landmarks are highlighted by the colored arrows.
3.3 Functional Consistency of Identified Common Cortical Landmarks
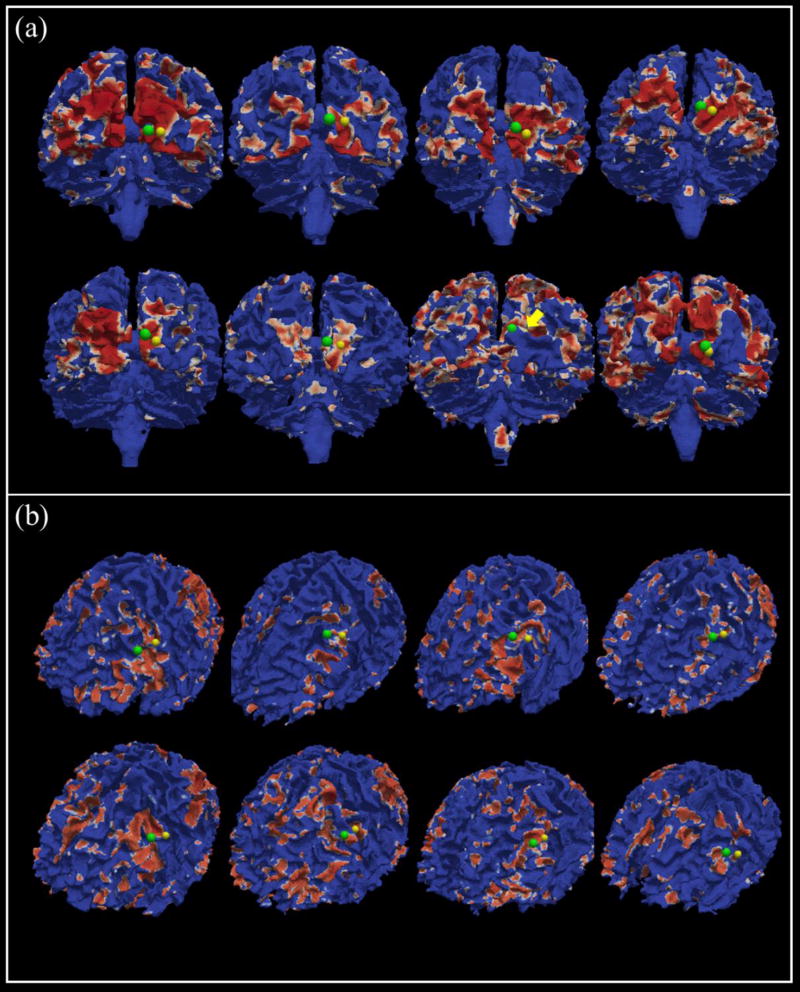
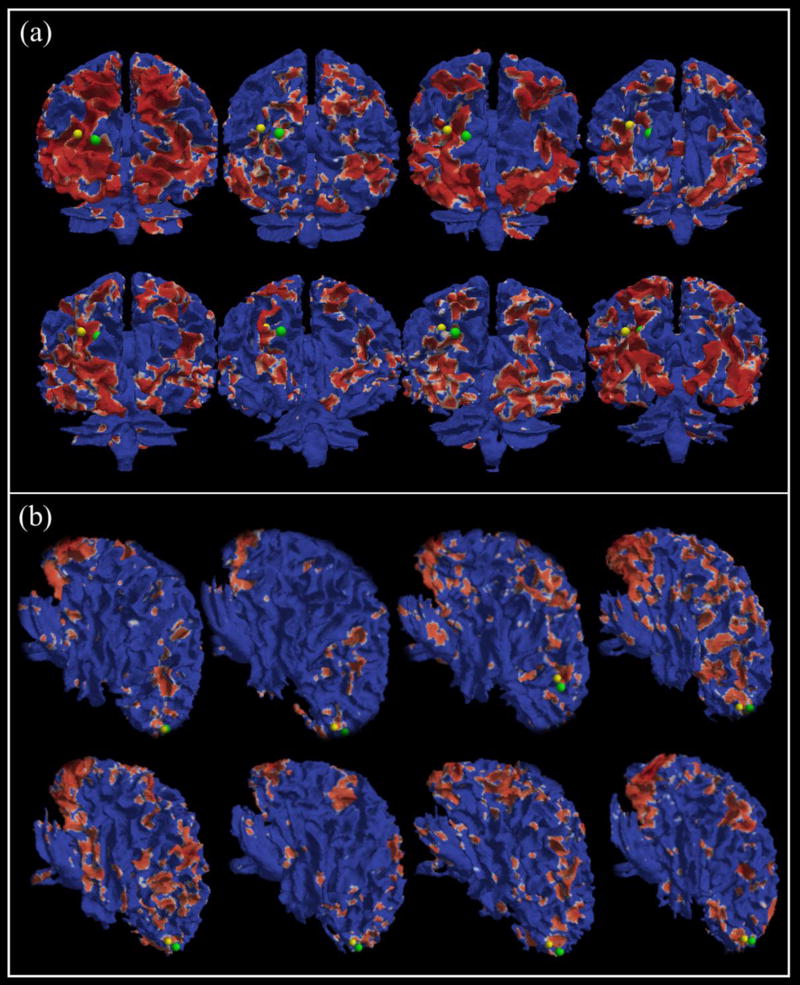
In this subsection, we aim to examine the functional consistency of the landmarks before and after optimization. Since we use the functional brain networks to pick up the initial landmarks as mentioned in Section 2.3, each initialed landmark is corresponding to one peak focus of a specific group-level common functional network, as shown in Fig.3. In our proposed framework, we assume that the final location of initialed landmark will have functional consistency with its initialed landmark, that is, they should belong to the same activation areas on the specific functional network. In order to verify this point clearly, we register each individual functional network onto its own cortical surface and highlight the activated areas with red color. Then, we highlight each pair of landmarks (before and after the optimization step) that we are interested in. From Fig.9 and Fig.10, 4 sets of landmarks are used as examples to reveal the functional consistency of the identified common landmarks (another 4 examples are shown in the Supplemental Fig.1 and Fig.2). It is evident that the optimized landmarks are consistent and meaningful in functional perspective, in that all of the optimized landmarks (green dots) are still located within the corresponding functional activation areas, compared with the initialed ones (yellow dots). Although there are noticeable variabilities among the functional networks in individual brains, the functional consistency of the identified common landmarks can be visually appreciated.
Fig 9.
The locations of the landmarks before and after optimization. (a) and (b) are the two examples. In each example, 8 function networks are picked up from 8 different subjects, which are corresponding to the same group-level common functional network. Yellow dots are the landmarks before the optimization, and green dots are the optimized landmarks. Red areas represent the highly activated patterns on the cortical surface. The yellow arrow (in panel (a)) is used to show the location of a landmark before the optimization as it is blocked by the gyrus. (a) is corresponding to G2 network in Fig.3, and (b) is corresponding to W3 network in Fig.3.
Fig 10.
Two examples of the landmarks before and after optimization. (a) is corresponding to S2 network in Fig. 3, and (b) is corresponding to W3 network in Fig.3.
Quantitatively, the average spatial overlap between the consistent common functional brain network and its corresponding individual functional network is 0.334, which is reasonably high based on our experience (Lv J et al., 2015; Zhang S et al., 2013; Zhang S et al., 2016; Zhao S et al., 2015; Zhao Y et al., 2016). We can see that, using the consistent common functional brain networks as a guidance to initialize the landmarks will facilitate the functional consistency of optimized landmarks. In comparison with the original DICCCOL optimization system (Zhu D et al., 2012; Zhu D et al., 2012; Yuan Y et al., 2013; Zhu D et al., 2014; Jiang X et al., 2015b; Zhang T et al., 2016) which used the roughly sampled grid points in a template brain as the initialized landmarks, taking functional profiles into consideration in this proposed framework leads to promising results.
3.4 Joint Representation of Consistent Cortical Landmarks in Larger Datasets
In the original DICCCOL system (Zhu et al, 2012), the total number of subjects used in the optimization procedure is 5, which is relatively small, due to the fact that the landmark location search space grows exponentially with the number of subjects. In this proposed framework with groupwise registration procedure in Section 2.4, the landmarks are already better aligned into the template space and this step will substantially reduce the search space of landmark location during the optimization procedure. This important improvement can significantly speed up the common landmark discovery process, and thus our new landmark identification framework in this paper can deal with a larger number of subjects. In addition to the 8 subjects used in previous results subsections, 20 additional subjects are also included in this subsection to demonstrate the performance and reproducibility of our method.
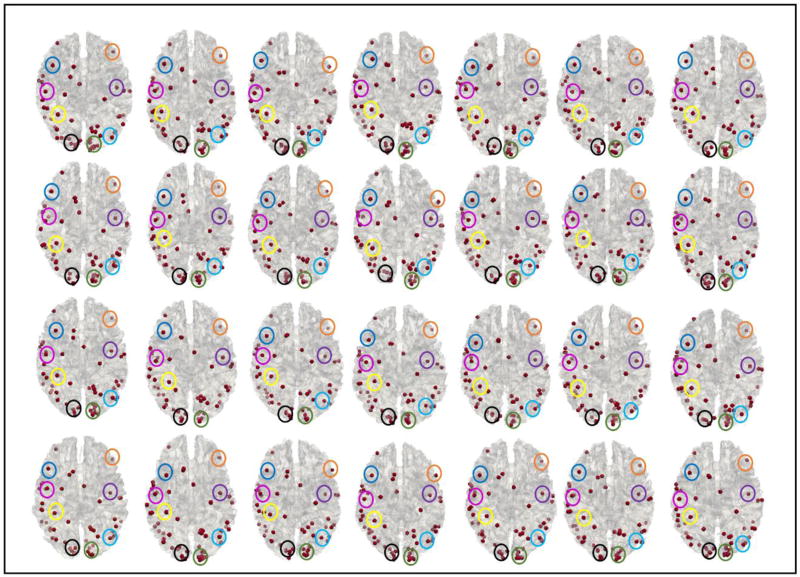
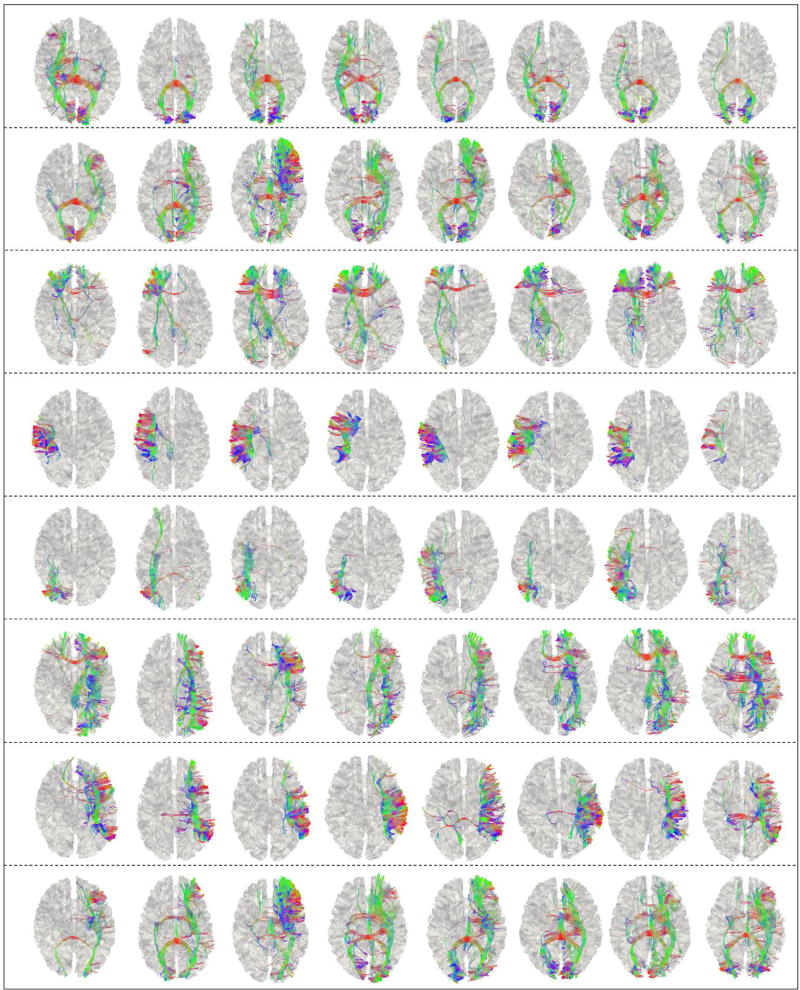
Fig.11 shows the identified consistent cortical landmarks in 28 subjects. Here, 55 landmarks are identified and considered as consistent cortical landmarks. Compared with the results from 8 subjects in Sections 3.1–3.3, two landmarks are discarded by the groupwise registration procedure. The possible reason is that the functional or structural consistency of these two functional peak foci (used as initialization) are not consistent across 28 subjects. As a consequence, the groupwise registration algorithm will reject these two landmarks. For other 55 consistent landmarks, they are located on similar and corresponding areas as those in Fig.6. In order to illustrate the consistency with the results in Fig.6, we highlighted in Fig.11 the corresponding landmarks using the same colored circles as in Fig.6. The anatomical location correspondences of these 55 common landmarks can be visually appreciated. In addition, in Fig.12, we choose the same set of 8 landmarks (which are the same as those shown in Fig.7) to visualize the fiber bundles connected to the corresponding landmarks. From Fig.6, Fig.7, Fig.11 and Fig.12, we can see that, although the number of the subjects used for landmark optimization grows from 8 to 28, both the locations of identified landmarks and their fiber connection patterns are quite similar within and across these two groups of subjects. Quantitatively, the mean Euclidean distance of spatial location movements of the landmarks before and after optimization of all 55 landmarks is 10.44 mm, which is quite similar to the results reported in Section 3.1. For comparing the similarity of the shapes of fiber bundles, we compute the mean correlation of ‘trace-map’ for all 55 corresponding landmarks obtained in Section 1 and Section 3, and achieve as high as 0.70 for mean correlation coefficient. For each corresponding landmark in Fig.7 and Fig.12 (each row), the average similarity of fiber shapes is 0.87, 0.95, 0.52, 0.93, 0.67, 0.71, 0.82 and 0.93, respectively. These results suggest that our method and results are reproducible using different numbers of subjects.
Fig 11.
Identified consistent cortical landmarks in 28 subjects. 55 common landmarks are highlighted with dark red dots. In particular, 8 landmarks are highlighted by 8 different colored circles on the cortical surface to show the consistency of their anatomic locations.
Fig 12.
Shapes of fiber bundles connected to the 8 landmarks in 8 subjects. Each row represents the fiber bundles for one corresponding landmark in 8 subjects. Visualization schemes are similar to those in Fig.7.
3.5 Landmark-Based Meta-analysis
In order to acquire more details of functional and structural information of those finalized consistent cortical landmarks and compare our results with other existing experiments, in this section, 55 finalized landmarks are registered onto the MNI standard space by using linear registration from FSL tool (Woolrich et al., 2009). Then meta-analysis method is applied to study those landmarks by using the software Sleuth from brainmap.org (Eickhoff et al., 2009). Here, the ROI width is set to 4 mm. In a structural perspective, among those 55 landmarks, 30 are on the left hemisphere and the rest are on the right hemisphere. The coordinates of 55 consistent cortical landmarks on the MNI standard space are listed in Table 1. In addition, among those 55 landmarks, the number of landmarks in each lobe are summarized and shown in Table 2.
Table 1.
The locations of the 55 consistent cortical landmarks in MNI standard space (mm).
| Index | x | y | z | Index | x | y | z | Index | x | y | z | Index | x | y | z |
|---|---|---|---|---|---|---|---|---|---|---|---|---|---|---|---|
| 1 | −6 | −91 | −5 | 2 | 13 | −95 | −2 | 3 | −10 | −97 | −6 | 4 | −21 | −85 | −13 |
| 5 | 10 | −86 | −8 | 6 | −53 | −16 | −26 | 7 | −33 | 38 | −12 | 8 | −48 | −35 | 27 |
| 9 | 18 | −66 | 32 | 10 | 44 | −54 | 29 | 11 | −20 | −29 | 42 | 12 | −51 | −5 | −11 |
| 13 | 51 | −24 | 2 | 14 | 25 | −34 | 46 | 15 | −51 | −12 | −2 | 16 | 43 | −20 | 2 |
| 17 | −10 | 4 | 42 | 18 | −30 | −70 | 28 | 19 | −4 | −86 | 2 | 20 | 36 | −81 | 16 |
| 21 | −15 | −92 | −11 | 22 | −36 | −71 | −15 | 23 | −13 | −59 | 42 | 24 | 15 | −72 | 36 |
| 25 | 41 | −79 | −17 | 26 | −50 | −59 | −22 | 27 | −31 | −82 | 13 | 28 | 11 | −71 | 34 |
| 29 | 45 | −57 | −7 | 30 | −41 | −61 | −16 | 31 | 15 | −95 | −8 | 32 | −41 | −45 | 31 |
| 33 | −14 | −9 | 47 | 34 | −26 | −84 | 2 | 35 | −10 | −92 | −6 | 36 | 9 | −97 | 6 |
| 37 | 10 | −97 | −3 | 38 | −29 | −51 | 39 | 39 | −18 | −86 | −13 | 40 | 9 | −90 | −6 |
| 41 | 19 | −95 | −11 | 42 | 14 | −97 | −6 | 43 | −35 | −74 | −17 | 44 | 43 | −77 | −18 |
| 45 | 10 | −69 | 28 | 46 | 49 | −65 | 19 | 47 | −44 | −25 | 32 | 48 | −4 | −16 | 37 |
| 49 | −58 | −11 | −21 | 50 | 59 | −25 | 2 | 51 | −46 | −44 | 26 | 52 | −35 | 7 | 27 |
| 53 | 21 | −77 | 28 | 54 | 40 | 28 | −25 | 55 | 54 | −56 | −25 |
Table 2.
The distributions of 55 landmarks on the brain.
| Name of the lobe | Number of the landmarks | Name of the lobe | Number of the landmarks |
|---|---|---|---|
| Occipital | 24 | Temporal | 10 |
| Parietal | 8 | Posterior | 5 |
| Frontal | 4 | Limbic | 3 |
| Insular | 1 |
From Table 2, we can clearly see that the occipital lobe has much higher consistency when compared with other lobes. On the other hand, the frontal lobes have relatively larger differences across the subjects. These results are consistent with current knowledge about the variability of cortical lobe functions. Please refer to the Table 1 in supplemental materials for the details of structural locations of each landmark.
In a functional perspective, functional behaviors of each landmark (foci on the MNI space) are summarized by searching more than 3000 literature fMRI papers. In total, 7 main functional behaviors are summarized in Table 3. From the Table 3, we can see that these functional behaviors are relatively consistent across the subjects. In addition, these functional behaviors contain large number of landmarks, which suggests that these functional behaviors are complex and located on large areas across the whole cortex. Details of functional behaviors for each landmark are listed in Table 2 in the supplemental materials.
Table 3.
The number of the landmarks for main functional behaviors.
| Behavioral domain | Number of landmarks | Behavioral domain | Number of landmarks |
|---|---|---|---|
| Cognition | 46 | Perception | 26 |
| Language | 23 | Vision | 18 |
| Emotion | 18 | Action | 16 |
| Memory | 15 |
4. Discussion and Conclusion
In this work, we jointly represent the connectome-scale structural and functional profiles via an efficient computational framework for identification of consistent cortical landmarks in human brains. In this framework, functional profiles are first used to localize the initial landmarks for each functional network and each subject, instead of using random initialization or manual labelling as in the previous DICCCOL systems. In this way, initialized landmarks have functional correspondences, and thus they provide a foundation for the joint representation of connectome-scale structural profiles and functional profiles afterwards. Next, for each corresponding initial landmark across all the subjects, ROIs will be established by combining functional and structural profiles, and groupwise registration method is used to significantly reduce the cross-subject variability of the initialized ROIs. Finally, the optimization step is applied to identify the final location of each landmark in each individual brain. We have successfully identified 55 consistent and common cortical landmarks, which can represent a common structural and functional cortical architecture.
The effectiveness of the proposed framework has been carefully examined through three aspects including structural connectivity consistency, anatomical consistency, and functional consistency, which are shown in the Sections 3.1 to 3.3, respectively. To summarize, common landmarks should have robust consistency in shape of fiber bundles, anatomy location on the cortical surface, and functional activation intensity, and experimental results have supported the effectiveness of our framework. However, given the lack of ground-truth, future studies should be designed to further evaluate and validate the proposal framework by using larger scale datasets, independent evaluation metrics, and more advanced statistical methodologies.
The proposed framework could be improved and enhanced in the following directions in the future. First, the number of consistent functional networks used to initialize the landmarks can be significantly increased with the advancement of the HAFNI system. In this paper, only 32 consistent and common HAFNI networks were used to select the functional peak foci. In the future, many more HAFNI networks could be discovered and reproduced across individuals and populations, which can be directly used in this landmark discovery framework. Second, in the current study, we focused on the methodology development of joint representation of connectome-scale structural and functional profiles. The potential applications of this framework in clinical fMRI/DTI datasets, e.g., for diagnosis of Alzheimer’s disease and Autism, are left to our future studies. For brains with more severe pathologies such as those in brain tumors and stroke, our methods might not be applicable, and as a result, more specific methods should be designed and applied, which could be another possible topic for our future works. We hypothesize that the joint representation of structural and functional cortical architecture by the method proposed in this paper can find significant values in those clinical applications by elucidating the altered cortical architectures in brain diseases. Third, in addition to the HCP data, other datasets with both fMRI and DTI modalities can be used and evaluated by our framework in this paper. That is, our methods are applicable to a variety of multimodal DTI/fMRI datasets, once the functional networks and structural connectivity patterns can be reliably derived from both modalities.
In summary, we proposed a novel framework for discovering and representing consistent and common cortical landmarks in human brains, and also demonstrated the effectiveness and reproducibility of this representation. This new representation could be potentially widely applicable in many cognitive and clinical neuroscience applications in the future.
Supplementary Material
Acknowledgments
Funding: This research was supported by the National Institutes of Health (DA-033393, AG-042599) and by the National Science Foundation (NSF CAREER Award IIS-1149260, CBET-1302089, BCS-1439051 and DBI-1564736).
Footnotes
Compliance with Ethical Standards
Conflict of Interest: The authors declare that they have no conflict of interest.
Ethical approval: All procedures performed in studies involving human participants were in accordance with the ethical standards of the institutional and/or national research committee and with the 1964 Helsinki declaration and its later amendments or comparable ethical standards. Informed consent: Informed consent was obtained from all individual participants included in the study.
References
- Abolghasemi V, Ferdowsi S, Sanei S. Fast and incoherent dictionary learning algorithms with application to fMRI Signal. Image and Video Processing. 2015;9(1):147–158. [Google Scholar]
- Anderson ML, Kinnison J, Pessoa L. Describing functional diversity of brain regions and brain networks. Neuroimage. 2013;73:50–58. doi: 10.1016/j.neuroimage.2013.01.071. [DOI] [PMC free article] [PubMed] [Google Scholar]
- Baird AA, Colvin MK, VanHorn JD, et al. Functional connectivity: integrating behavioral, diffusion tensor imaging, and functional magnetic resonance imaging data sets. Journal of Cognitive Neuroscience. 2005;17(4):687–693. doi: 10.1162/0898929053467569. [DOI] [PubMed] [Google Scholar]
- Barch DM, Burgess GC, Harms MP, et al. Function in the human connectome: task-fMRI and individual differences in behavior. Neuroimage. 2013;80:169–189. doi: 10.1016/j.neuroimage.2013.05.033. [DOI] [PMC free article] [PubMed] [Google Scholar]
- Brett M, Johnsrude IS, Owen AM. The problem of functional localization in the human brain. Nature reviews neuroscience. 2002;3(3):243–249. doi: 10.1038/nrn756. [DOI] [PubMed] [Google Scholar]
- Calamante F, Masterton RAJ, Tournier JD, et al. Track-weighted functional connectivity (TW-FC): a tool for characterizing the structural-functional connections in the brain. NeuroImage. 2013;70:199–210. doi: 10.1016/j.neuroimage.2012.12.054. [DOI] [PubMed] [Google Scholar]
- Chen H, Zhang T, Liu T. Identifying Group-Wise Consistent White Matter Landmarks via Novel Fiber Shape Descriptor International Conference on Medical Image Computing and Computer-Assisted Intervention. Springer Berlin Heidelberg. 2013:66–73. doi: 10.1007/978-3-642-40811-3_9. [DOI] [PubMed] [Google Scholar]
- Conturo TE, Lori NF, Cull TS, et al. Tracking neuronal fiber pathways in the living human brain. Proceedings of the National Academy of Sciences. 1999;96(18):10422–10427. doi: 10.1073/pnas.96.18.10422. [DOI] [PMC free article] [PubMed] [Google Scholar]
- Eickhoff SB, Laird AR, Grefkes C, Wang LE, Zilles K, Fox PT. Coordinate-based activation likelihood estimation meta-analysis of neuroimaging data: A random-effects approach based on empirical estimates of spatial uncertainty. Hum Brain Mapp. 2009;30:2907–2926. doi: 10.1002/hbm.20718. [DOI] [PMC free article] [PubMed] [Google Scholar]
- Fischl B, Salat DH, Busa E, et al. Whole brain segmentation: automated labeling of neuroanatomical structures in the human brain. Neuron. 2002;33(3):341–355. doi: 10.1016/s0896-6273(02)00569-x. [DOI] [PubMed] [Google Scholar]
- Gorski KM, Hivon E, Banday AJ, et al. HEALPix: a framework for high-resolution discretization and fast analysis of data distributed on the sphere. The Astrophysical Journal. 2005;622(2):759. [Google Scholar]
- Greicius MD, Srivastava G, Reiss AL, et al. Default-mode network activity distinguishes Alzheimer’s disease from healthy aging: evidence from functional MRI. Proceedings of the National Academy of Sciences of the United States of America. 2004;101(13):4637–4642. doi: 10.1073/pnas.0308627101. [DOI] [PMC free article] [PubMed] [Google Scholar]
- Guye M, Parker GJM, Symms M, et al. Combined functional MRI and tractography to demonstrate the connectivity of the human primary motor cortex in vivo. Neuroimage. 2003;19(4):1349–1360. doi: 10.1016/s1053-8119(03)00165-4. [DOI] [PubMed] [Google Scholar]
- Jbabdi S, Woolrich MW, Behrens TEJ. Multiple-subjects connectivity-based parcellation using hierarchical Dirichlet process mixture models. NeuroImage. 2009;44(2):373–384. doi: 10.1016/j.neuroimage.2008.08.044. [DOI] [PubMed] [Google Scholar]
- Jiang X, Zhang X, Zhu D. Intrinsic Functional Component Analysis via Sparse Representation on Alzheimer’s Disease Neuroimaging Initiative Database. Brain Connect. 2014b;4(8):575–86. doi: 10.1089/brain.2013.0221. [DOI] [PMC free article] [PubMed] [Google Scholar]
- Jiang X, Li X, Lv J, et al. Sparse representation of HCP grayordinate data reveals novel functional architecture of cerebral cortex. Human brain mapping. 2015a;36(12):5301–5319. doi: 10.1002/hbm.23013. [DOI] [PMC free article] [PubMed] [Google Scholar]
- Jiang X, Zhang T, Zhu D, et al. Anatomy-Guided Dense Individualized and Common Connectivity-Based Cortical Landmarks (A-DICCCOL) Biomedical Engineering, IEEE Transactions on. 2015b;62(4):1108–1119. doi: 10.1109/TBME.2014.2369491. [DOI] [PMC free article] [PubMed] [Google Scholar]
- Jiang X, Zhang T, Zhao Q, Lu J, Guo L, Liu T. Fiber Connection Pattern-guided Structured Sparse Representation of Whole-brain FMRI Signals for Functional Network Inference Medical Image Computing and Computer-Assisted Intervention. 2015c. 9349:133–141. [Google Scholar]
- Johansen-Berg H, Behrens TEJ, Robson MD, et al. Changes in connectivity profiles define functionally distinct regions in human medial frontal cortex. Proceedings of the National Academy of Sciences of the United States of America. 2004;101(36):13335–13340. doi: 10.1073/pnas.0403743101. [DOI] [PMC free article] [PubMed] [Google Scholar]
- Kanwisher N. Functional specificity in the human brain: a window into the functional architecture of the mind. Proceedings of the National Academy of Sciences. 2010;107(25):11163–11170. doi: 10.1073/pnas.1005062107. [DOI] [PMC free article] [PubMed] [Google Scholar]
- Koch K, Wagner G, Dahnke R, et al. Structure-function relationships in the context of reinforcement-related learning: a combined diffusion tensor imaging-functional magnetic resonance imaging study. Neuroscience. 2010;168(1):190–199. doi: 10.1016/j.neuroscience.2010.03.026. [DOI] [PubMed] [Google Scholar]
- Lee L, Harrison LM, Mechelli A. A report of the functional connectivity workshop, Dusseldorf 2002. Neuroimage. 2003;19(2):457–465. doi: 10.1016/s1053-8119(03)00062-4. [DOI] [PubMed] [Google Scholar]
- Li G, Guo L, Nie J, et al. Automatic cortical sulcal parcellation based on surface principal direction flow field tracking. NeuroImage. 2009;46(4):923–937. doi: 10.1016/j.neuroimage.2009.03.039. [DOI] [PMC free article] [PubMed] [Google Scholar]
- Li K, Guo L, Faraco C, et al. Individualized ROI optimization via maximization of group-wise consistency of structural and functional profiles. Advances in Neural Information Processing Systems. 2010:1369–1377. [Google Scholar]
- Logothetis NK. What we can do and what we cannot do with fMRI. Nature. 2008;453(7197):869–878. doi: 10.1038/nature06976. [DOI] [PubMed] [Google Scholar]
- Lv J, Jiang X, Li X, et al. Holistic atlases of functional networks and interactions reveal reciprocal organizational architecture of cortical function. IEEE Transactions on Biomedical Engineering. 2015a;62(4):1120–1131. doi: 10.1109/TBME.2014.2369495. [DOI] [PubMed] [Google Scholar]
- Lv J, Jiang X, Li X, et al. Sparse representation of whole-brain FMRI signals for identification of functional networks. Medical image analysis. 2015b;20(1):112–134. doi: 10.1016/j.media.2014.10.011. [DOI] [PubMed] [Google Scholar]
- Lv J, Jiang X, Li X, et al. Assessing effects of prenatal alcohol exposure using group-wise sparse representation of fMRI data. Psychiatry Research: Neuroimaging. 2015c;233(2):254–268. doi: 10.1016/j.pscychresns.2015.07.012. [DOI] [PMC free article] [PubMed] [Google Scholar]
- Mairal J, Bach F, Ponce J, et al. Online learning for matrix factorization and sparse coding. Journal of Machine Learning Research. 2010 Jan;11:19–60. [Google Scholar]
- Madden DJ, Spaniol J, Whiting WL, et al. Adult age differences in the functional neuroanatomy of visual attention: a combined fMRI and DTI study. Neurobiology of aging. 2007;28(3):459–476. doi: 10.1016/j.neurobiolaging.2006.01.005. [DOI] [PMC free article] [PubMed] [Google Scholar]
- Mori S, Zhang J. Principles of diffusion tensor imaging and its applications to basic neuroscience research. Neuron. 2006;51(5):527–539. doi: 10.1016/j.neuron.2006.08.012. [DOI] [PubMed] [Google Scholar]
- Oikonomou VP, Blekas K, Astrakas L. A sparse and spatially constrained generative regression model for fMRI data analysis. Biomedical Engineering, IEEE Transactions on. 2012;59(1):58–67. doi: 10.1109/TBME.2010.2104321. [DOI] [PubMed] [Google Scholar]
- Passingham RE, Stephan KE, Kötter R. The anatomical basis of functional localization in the cortex. Nature Reviews Neuroscience. 2002;3(8):606–616. doi: 10.1038/nrn893. [DOI] [PubMed] [Google Scholar]
- Pessoa L. Beyond brain regions: Network perspective of cognition-emotion interactions. Behavioral and Brain Sciences. 2012;35(03):158–159. doi: 10.1017/S0140525X11001567. [DOI] [PubMed] [Google Scholar]
- Rettmann ME, Han X, Xu C, et al. Automated sulcal segmentation using watersheds on the cortical surface. NeuroImage. 2002;15(2):329–344. doi: 10.1006/nimg.2001.0975. [DOI] [PubMed] [Google Scholar]
- Schonberg T, Pianka P, Hendler T, et al. Characterization of displaced white matter by brain tumors using combined DTI and fMRI. Neuroimage. 2006;30(4):1100–1111. doi: 10.1016/j.neuroimage.2005.11.015. [DOI] [PubMed] [Google Scholar]
- Shen D, Davatzikos C. HAMMER: hierarchical attribute matching mechanism for elastic registration. IEEE transactions on medical imaging. 2002;21(11):1421–1439. doi: 10.1109/TMI.2002.803111. [DOI] [PubMed] [Google Scholar]
- Smith SM, Fox PT, Miller KL, et al. Correspondence of the brain’s functional architecture during activation and rest. Proceedings of the National Academy of Sciences. 2009;106(31):13040–13045. doi: 10.1073/pnas.0905267106. [DOI] [PMC free article] [PubMed] [Google Scholar]
- Stankiewicz P, Lupski JR. Structural variation in the human genome and its role in disease. Annual review of medicine. 2010;61:437–455. doi: 10.1146/annurev-med-100708-204735. [DOI] [PubMed] [Google Scholar]
- Uğurbil K, Xu J, Auerbach EJ, et al. Pushing spatial and temporal resolution for functional and diffusion MRI in the Human Connectome Project. Neuroimage. 2013;80:80–104. doi: 10.1016/j.neuroimage.2013.05.012. [DOI] [PMC free article] [PubMed] [Google Scholar]
- Van Essen DC, Dierker DL. Surface-based and probabilistic atlases of primate cerebral cortex. Neuron. 2007;56(2):209–225. doi: 10.1016/j.neuron.2007.10.015. [DOI] [PubMed] [Google Scholar]
- Van Essen DC, Smith SM, Barch DM, et al. The WU-Minn human connectome project: an overview. Neuroimage. 2013;80:62–79. doi: 10.1016/j.neuroimage.2013.05.041. [DOI] [PMC free article] [PubMed] [Google Scholar]
- Van den Heuvel M, Mandl R, Luigjes J, et al. Microstructural organization of the cingulum tract and the level of default mode functional connectivity. The Journal of neuroscience. 2008;28(43):10844–10851. doi: 10.1523/JNEUROSCI.2964-08.2008. [DOI] [PMC free article] [PubMed] [Google Scholar]
- Wang Q, Chen L, Yap PT, et al. Groupwise registration based on hierarchical image clustering and atlas synthesis. Human brain mapping. 2010;31(8):1128–1140. doi: 10.1002/hbm.20923. [DOI] [PMC free article] [PubMed] [Google Scholar]
- Woolrich MW, Jbabdi S, Patenaude B, Chappell M, Makni S, Behrens T, Beckmann C, Jenkinson M, Smith SM. Bayesian analysis of neuroimaging data in FSL. NeuroImage. 2009;45:S173–86. doi: 10.1016/j.neuroimage.2008.10.055. [DOI] [PubMed] [Google Scholar]
- Yuan Y, Jiang X, Zhu D, et al. Meta-analysis of functional roles of DICCCOLs. Neuroinformatics. 2013;11(1):47–63. doi: 10.1007/s12021-012-9165-y. [DOI] [PMC free article] [PubMed] [Google Scholar]
- Ystad M, Hodneland E, Adolfsdottir S, et al. Cortico-striatal connectivity and cognition in normal aging: a combined DTI and resting state fMRI study. Neuroimage. 2011;55(1):24–31. doi: 10.1016/j.neuroimage.2010.11.016. [DOI] [PubMed] [Google Scholar]
- Zhao Y, Chen H, Li Y, et al. Connectome-scale group-wise consistent resting-state network analysis in autism spectrum disorder. NeuroImage: Clinical. 2016 doi: 10.1016/j.nicl.2016.06.004. [DOI] [PMC free article] [PubMed] [Google Scholar]
- Zhang S, Li X, Lv J, et al. Sparse representation of higher-order functional interaction patterns in task-based FMRI data International Conference on Medical Image Computing and Computer-Assisted Intervention. Springer Berlin Heidelberg. 2013:626–634. doi: 10.1007/978-3-642-40760-4_78. [DOI] [PubMed] [Google Scholar]
- Zhang S, Li X, Lv J, et al. Characterizing and differentiating task-based and resting state fMRI signals via two-stage sparse representations. Brain imaging and behavior. 2016;10(1):21–32. doi: 10.1007/s11682-015-9359-7. [DOI] [PMC free article] [PubMed] [Google Scholar]
- Zhang T, Zhu D, Jiang X, et al. Group-wise consistent cortical parcellation based on connectional profiles. Medical image analysis. 2016;32:32–45. doi: 10.1016/j.media.2016.02.009. [DOI] [PMC free article] [PubMed] [Google Scholar]
- Zhao S, Han J, Lv J, et al. Supervised Dictionary Learning for Inferring Concurrent Brain Networks. 2015 doi: 10.1109/TMI.2015.2418734. [DOI] [PubMed] [Google Scholar]
- Zhu D, Li K, Guo L, et al. DICCCOL: denseindividualized common connectivity-based cortical landmarks. Cerebral cortex. 2012 doi: 10.1093/cercor/bhs072. bhs072. [DOI] [PMC free article] [PubMed] [Google Scholar]
- Zhu D, Li K, Faraco CC, et al. Optimization of functional brain ROIs via maximization of consistency of structural connectivity profiles. NeuroImage. 2012;59(2):1382–1393. doi: 10.1016/j.neuroimage.2011.08.037. [DOI] [PMC free article] [PubMed] [Google Scholar]
- Zhu D, Li K, Terry DP, et al. Connectome-scale assessments of structural and functional connectivity in MCI. Human brain mapping. 2014;35(7):2911–2923. doi: 10.1002/hbm.22373. [DOI] [PMC free article] [PubMed] [Google Scholar]
Associated Data
This section collects any data citations, data availability statements, or supplementary materials included in this article.


