

Abstract
Background
DNA methylation is a fundamental epigenetic modification that is involved in many biological systems such as differentiation and disease. We and others recently showed that some transcription factors (TFs) are involved in the site-specific determination of DNA demethylation in a binding site-directed manner, although the reports of such TFs are limited.
Results
Here, we develop a screening system to identify TFs that induce binding site-directed DNA methylation changes. The system involves the ectopic expression of target TFs in model cells followed by DNA methylome analysis and overrepresentation analysis of the corresponding TF binding motif at differentially methylated regions. It successfully identified binding site-directed demethylation of SPI1, which is known to promote DNA demethylation in a binding site-directed manner. We extended our screening system to 15 master TFs involved in cellular differentiation and identified eight novel binding site-directed DNA demethylation-inducing TFs (RUNX3, GATA2, CEBPB, MAFB, NR4A2, MYOD1, CEBPA, and TBX5). Gene ontology and tissue enrichment analysis revealed that these TFs demethylate genomic regions associated with corresponding biological roles. We also describe the characteristics of binding site-directed DNA demethylation induced by these TFs, including the targeting of highly methylated CpGs, local DNA demethylation, and the overlap of demethylated regions between TFs of the same family.
Conclusions
Our results show the usefulness of the developed screening system for the identification of TFs that induce DNA demethylation in a site-directed manner.
Electronic supplementary material
The online version of this article (10.1186/s13072-017-0169-6) contains supplementary material, which is available to authorized users.
Keywords: DNA demethylation, Transcription factor, Binding site
Background
DNA methylation of CpG dinucleotides at gene regulatory regions is a fundamental epigenetic modification for gene silencing. CpG dinucleotides are usually highly methylated, except at regulatory regions such as promoters and enhancers, where methylation levels tend to be anti-correlated with downstream gene expression [1]. During cell differentiation, DNA methylation acts as a safeguard to prevent the expression of unnecessary genes, while regulatory regions of master transcription factors (TFs) must be demethylated before or during differentiation [2]. Abnormal DNA demethylation is associated with several serious diseases such as cancers [3, 4], suggesting that the dynamics of DNA methylation are strictly regulated to establish cell type-specific gene expression during cellular differentiation.
De novo DNA methylation is regulated by the DNA methyltransferases DNMT3a and DNMT3b [5, 6]. Once the CpG cytosine is methylated by these enzymes, the methylated status is inherited by daughter cells during cell division via the maintenance DNA methyltransferase DNMT1 [7, 8]. Active demethylation involves further steps, including a series of oxidizations by ten-eleven translocation (TET) enzymes and a base excision repair pathway [9–13]. Demethylation can also be passive, in which methylated CpG is diluted upon DNA replication without DNMT1 maintenance of the methylated status.
While enzymatic mechanisms of DNA methylation and demethylation are well characterized, little is known about how DNA methylation dynamics are spatiotemporally regulated. Recently, some TFs such as SPI1 were shown to promote DNA demethylation in a binding site-dependent manner [14–17]. We also demonstrated that RUNX1 induces DNA demethylation by recruiting DNA demethylation machinery to its binding sites, which likely contributes to hematopoietic development [18]. These studies indicate that TF-mediated DNA demethylation plays an important role in gene regulation, but TFs that induce binding site-directed DNA methylation changes are poorly characterized.
Here, we develop a novel versatile screening system to identify TFs that induce DNA methylation change in a binding site-directed manner. Our system involves the ectopic expression of the target TF in model cells, subsequent methylome analysis, and overrepresentation analysis of the corresponding TF binding motif (TFBM). We also report the identification of novel binding site-directed DNA demethylation-inducing TFs using our system.
Results
Assessment of a novel approach to identify TFs that induce binding site-directed DNA demethylation
We previously used TFBM overrepresentation analysis of DNA demethylated regions in RUNX1-overexpressing 293T cells to identify RUNX1 as a TF that induces DNA demethylation in a site-directed manner [18]. Hereafter, we refer to the TFs which induce binding site-directed DNA demethylation as “DNA-demethylating TFs” regardless of underlying mechanisms. To evaluate whether this approach can be used to detect other DNA-demethylating TFs, we investigated the TF SPI1 which has already been reported to be a DNA-demethylating TF in monocyte–osteoclast differentiation [15] (Fig. 1a).
Fig. 1.
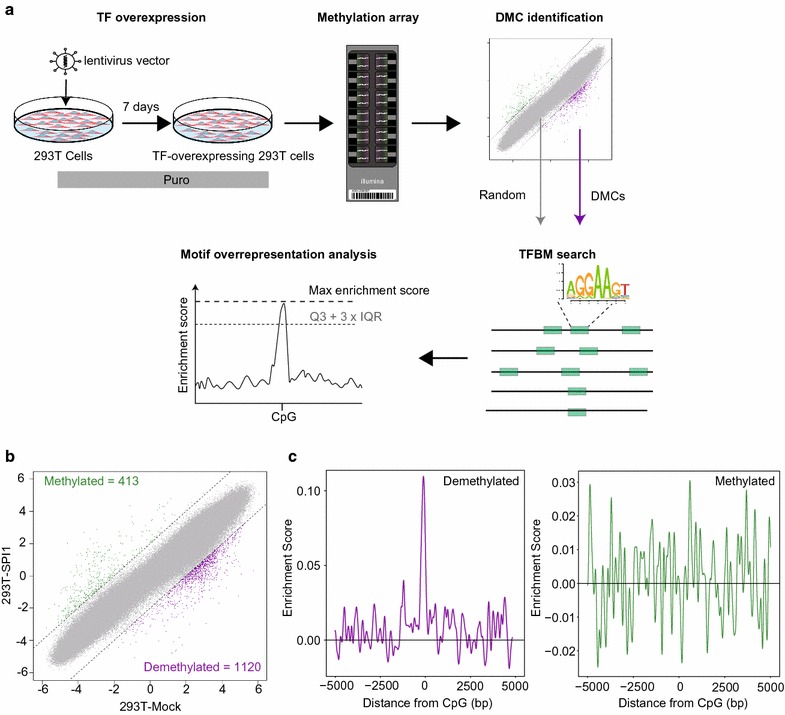
Feasibility of the approach to identify TFs that induce binding site-directed DNA methylation. a Flowchart of the approach. The TF of interest is overexpressed in a lentivirus vector that co-expresses a puromycin-resistant marker in 293T cells. Puromycin selection is applied for 7 days; then, TF-overexpressing 293T cells are subjected to DNA methylation analysis to identify differentially methylated CpGs (DMCs). Corresponding TFBMs of overexpressed TF are identified and then assessed to determine whether they are overrepresented at DMC regions. b Scatter plot showing DMCs caused by SPI1 overexpression in 293T cells. X- and Y-axes show M-values for 293T-mock and SPI1-overexpressing 293T (293T-SPI1) cells, respectively. Dashed lines represent ΔM borders of > 2. Green, purple, and gray dots represent significantly methylated, demethylated, and insignificant probes, respectively. Numbers of DMCs are shown upper left (methylated) and bottom right (demethylated). c Distribution of enrichment scores for SPI1 binding motifs within ± 5000 bp of demethylated CpGs (left) and methylated CpGs (right) in SPI1-overexpressing 293T cells. X- and Y-axes show distance from probe CpG position and enrichment score, respectively. Horizontal line represents enrichment score = 0
The analysis system consisted of SPI1 overexpression and single-base resolution methylation array analysis and SPI1 binding motif overrepresentation analysis at the differentially methylated regions. Hereafter, we refer to the analysis of DNA-demethylating TFs as “demethyl-TFBM analysis.” Using ΔM > 2 as a cutoff, we identified 413 methylated and 1120 demethylated CpGs in SPI1-overexpressing 293T cells compared with control (293T-mock) cells, indicating a clear bias toward DNA demethylation (Fig. 1b). Subsequent TFBM overrepresentation analysis revealed that the SPI1 binding motif JASPAR_CORE; MA0080.2 (shown in Fig. 1a) is significantly overrepresented in demethylated CpG regions (1 × 10⁻³¹, Poisson distribution model; max enrichment score peak/Q3 + IQR = 6.01), but not in methylated regions (Fig. 1c), indicating that SPI1 determines site specificity of DNA demethylation in a binding site-directed manner. Additional ChIP-qPCR analysis for SPI1 revealed binding of SPI1 protein at demethylated regions but not at methylation unchanged regions, supporting the SPI1-mediated binding site-directed DNA demethylation (Additional file 1: Figure S1a). Thus, these results suggest that the dimethyl-TFBM analysis is applicable for the identification of other DNA-demethylating TFs.
Identification of novel DNA-demethylating TFs
TFs involved in cellular differentiation and/or cellular function are considered to globally alter both gene expression and the epigenetic status. Therefore, to screen DNA-demethylating TFs, we applied the demethyl-TFBM analysis to 15 TFs manually selected as having important roles in cellular differentiation and/or cellular function (Table 1) [19]. The overexpression of these TFs in 293T cells was confirmed by quantitative reverse transcription (qRT)-PCR, revealing sufficiently greater expression (> 7.1-fold) compared with 293T-mock control cells (Additional file 1: Figure S1b). In subsequent methylation array analysis, we identified 24–2547 and 85–1841 methylated and demethylated CpGs, respectively, in 15 TF-overexpressing samples (Fig. 2a). TFBM overrepresentation analysis of demethylated regions revealed that the corresponding binding motifs of eight of the 15 TFs (RUNX3, GATA2, CEBPB, MAFB, NR4A2, MYOD1, CEBPA, and TBX5) were significantly overrepresented (Fig. 2b; Table 2). On the other hand, there was no overrepresentation of corresponding binding motifs in methylated regions (Additional file 1: Figure S1c). This suggested that these eight TFs induce DNA demethylation in a binding site-directed manner. Interestingly, the number of differentially methylated CpGs following the overexpression of the eight DNA-demethylating TFs was significantly biased toward demethylation compared with non-DNA-demethylating TFs (Fig. 2c), which is consistent with the results seen for SPI1 (Fig. 1b) and RUNX1 [18]. This supports a DNA demethylation role for the identified TFs.
Table 1.
Target transcription factors selected for DNA demethylated transcription factor screening
| Gene symbol | Accession | Cell type | Reference |
|---|---|---|---|
| RUNX3 | NM_001031680.2 | Lymphoid cells | Nat Immunol. 2015 Nov;16(11):1124–33 |
| NANOG | NM_024865.2 | Embryonic stem cells | Cell. 2003 May 30;113(5):631–42 |
| HNF1A | NM_000545.5 | Hepatocytes | Nature. 1992 Jan 30;355(6359):457–61 |
| PAX4 | NM_006193.2 | Insulin-producing beta cells | Nature. 1997 Mar 27;386(6623):399–402 |
| GATA2 | NM_001145661.1 | Hematopoietic cells | Nature. 1994 Sep 15;371(6494):221–6 |
| NKX2-5 | NM_004387.2 | Cardiomyocytes | Genes Dev. 1995 Jul 1;9(13):1654–66 |
| SOX2 | NM_003106.2 | Embryonic stem cells/neural stem cells | Genes Dev. 2003 Jan 1;17(1):126–40, Mol Cell Biol. 2004 May;24(10):4207–20 |
| CEBPB | NM_005194 | Uminal cells in the mammary gland | Stem Cells. 2010 Mar 31;28(3):535–44 |
| MAFB | NM_005461.3 | Myelomonocyte cells | Cell. 1996 Apr 5;85(1):49–60 |
| NR4A2 | NM_173173.1 | T cells | Nat Commun. 2011; 2:269 |
| POU5F1 | NM_002701.4 | Embryonic stem cells | Cell. 1998 Oct 30;95(3):379–91 |
| MYOD1 | NM_002478.4 | Myogenic cells | Cell. 1988 Jun 3;53(5):781–93 |
| CEBPA | NM_004364.3 | Myeloid cells/adipocytes | Proc Natl Acad Sci U S A. 1997 Jan 21;94(2):569–74, Genes Dev. 1994 Jul 15;8(14):1654–63 |
| HNF4A | NM_178850.1 | Hepatocytes | Nature. 1992 Jan 30;355(6359):457–61 |
| TBX5 | NM_181486.1 | Cardiomyocytes | Nat Genet. 2001 Jul;28(3):276–80 |
Fig. 2.
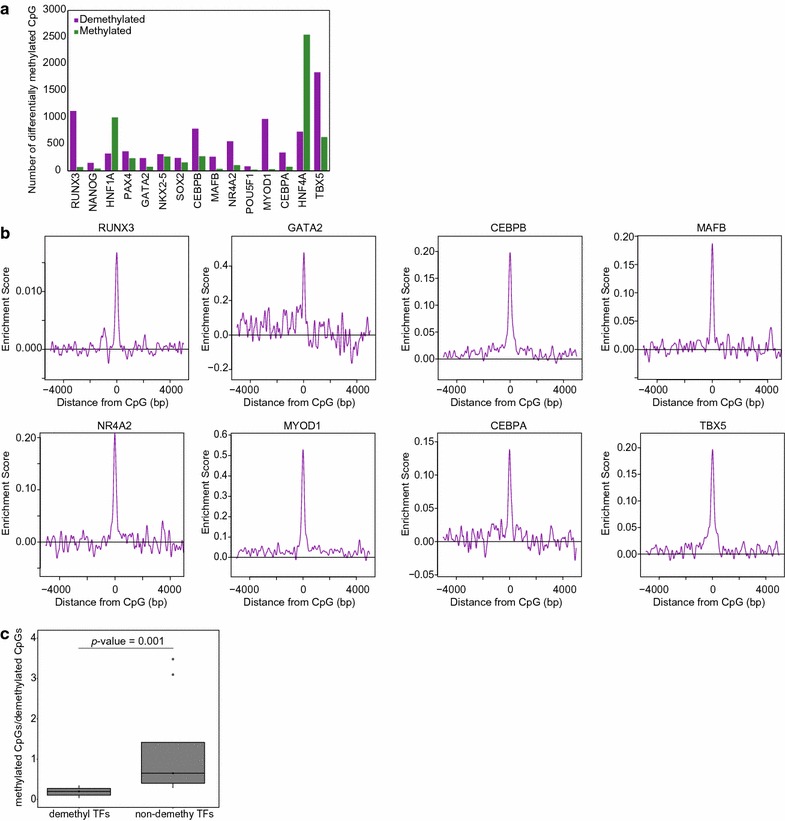
Identification of DNA-demethylating TFs. a Number of differentially methylated CpGs by TF overexpression. X- and Y-axes show overexpressed TFs and number of differentially methylated CpGs, respectively. Purple and green bars represent demethylated CpGs and methylated CpGs, respectively. b Distribution of enrichment score for TFBMs within ± 5000 bp of demethylated CpG probes in TF-overexpressing 293T cells. X- and Y-axes show distance from probe CpG position and enrichment score, respectively. Horizontal lines are enrichment score = 0. c Boxplot showing ratio of number of methylated and demethylated CpGs for DNA-demethylating TFs (demethyl TFs) and non-DNA-demethylating TFs (non-demethyl TFs). Medians are indicated by central black horizontal lines, upper quartiles are indicated by upper edges of the box, and lower quartiles are indicated by lower edges of the box. Maximum and minimum values are marked as lines extending from the boxes. The p value is shown above the plots (Wilcoxon rank sum test)
Table 2.
Motif overrepresentation analysis
| Gene | Motif ID | Motif source | Species | Poisson p value | Enrichment score ratio (max/outlier) | Judgment |
|---|---|---|---|---|---|---|
| RUNX3 | RUNX3 | jolma2013 | Hsapiens | 2.07E−33 | 15.48 | DNA demethylating |
| GATA2 | MA0036.1 | JASPAR_CORE | Hsapiens | 1.16E−29 | 4.29 | DNA demethylating |
| CEBPB | MA0466.1 | JASPAR_2014 | Hsapiens | 7.87E−250 | 13.80 | DNA demethylating |
| MAFB | Mafb | jolma2013 | Mmusculus | 6.41E−52 | 11.99 | DNA demethylating |
| NR4A2 | MA0160.1 | JASPAR_CORE | Mmusculus | 5.89E−72 | 9.76 | DNA demethylating |
| MYOD1 | MA0499.1 | JASPAR_2014 | Mmusculus | < 1E−320 | 23.64 | DNA demethylating |
| CEBPA | MA0102.2 | JASPAR_CORE | Vertebrata | 1.15E−89 | 7.96 | DNA demethylating |
| TBX5 | TBX5 | jolma2013 | Hsapiens | 4.11E−174 | 13.14 | DNA demethylating |
| NANOG | NA | SwissRegulon | NA | 0.90 | NA | Non-DNA demethylating |
| HNF1A | HNF1A | jolma2013 | Hsapiens | 0.12 | NA | Non-DNA demethylating |
| PAX4 | MA0068.1 | JASPAR_CORE | Mmusculus | 1.00 | NA | Non-DNA demethylating |
| Nkx2-5 | UP00249 | UniPROBE | Mmusculus | 1.00 | NA | Non-DNA demethylating |
| SOX2 | MA0143.1 | JASPAR_CORE | Mmusculus | 0.38 | NA | Non-DNA demethylating |
| POU5F1 | MA0142.1 | JASPAR_CORE | Mmusculus | 0.50 | NA | Non-DNA demethylating |
| HNF4A | HNF4A | jolma2013 | Hsapiens | 0.06 | NA | Non-DNA demethylating |
Functional evaluation of TF-mediated DNA demethylation regions
Because we used 293T cells as a model cells, the screening results may not reflect physiological function. To evaluate our screening results from a functional aspect, we performed gene ontology (GO) and tissue enrichment analyses of genes with demethylated CpGs at their promoter regions (demethylated genes). We first selected demethylated CpGs within regions ± 500 bp from the corresponding transcription start site of GENCODE genes (release 19). We identified 114, 47, 119, 46, 79, 135, 79, 212, and 190 promoter-associated demethylated CpGs in RUNX3-, GATA2-, CEBPB-, MAFB-, NR4A2-, MYOD1-, CEBPA-, TBX5-, and SPI1-overexpressing cells, respectively. Interestingly, the number of demethylated CpGs following the overexpression of DNA-demethylating TFs was significantly biased toward promoter regions in all identified DNA-demethylating TFs (p value < 10−6, Fisher’s exact test), suggesting that DNA-demethylating TFs preferentially demethylate promoter regions (Table 3).
Table 3.
Number of promoter-associated demethylated CpGs
| Demethylating TF | Prom-associated | Prom-nonassociated | All demethyl | % of Prom-associated | p value (Fisher’s exact test) |
|---|---|---|---|---|---|
| RUNX3 | 114 | 1005 | 1119 | 10.19 | 1.93E−10 |
| GATA2 | 47 | 192 | 239 | 19.67 | 1.51E−14 |
| CEBPB | 119 | 670 | 789 | 15.08 | 2.20E−16 |
| MAFB | 46 | 219 | 265 | 17.36 | 3.00E−12 |
| NR4A2 | 79 | 474 | 553 | 14.29 | 6.22E−15 |
| MYOD1 | 135 | 836 | 971 | 13.90 | 2.20E−16 |
| CEBPA | 79 | 710 | 789 | 10.01 | 2.21E−07 |
| TBX5 | 212 | 1629 | 1841 | 11.52 | 2.20E−16 |
| SPI1 | 190 | 930 | 1120 | 16.96 | 2.20E−16 |
| RUNX1 | 27 | 143 | 170 | 15.88 | 5.23E−07 |
| All probes | 26,234 | 459,051 | 485,285 | 5.41 |
“Prom-associated” and “Prom-nonassociated” indicate the number of promoter-associated CpGs and nonpromoter-associated CpG, respectively. “All dimethyl” means total number of demethylated CpGs. p value represents the significance of overrepresentation of promoter-associated CpGs
Using the online DAVID tool (https://david.ncifcrf.gov/), we identified the top 10 enriched GOs or specifically expressing tissues at promoter-associated demethylated CpG regions for each DNA-demethylating TF (Fig. 3; full list of significantly enriched GOs or specifically expressing tissues shown in Additional file 2). The enriched GOs/specifically expressing tissues tended to be linked with corresponding cellular functions of overexpressed TFs. Notably, enriched GOs in MYOD1-overexpressing cells were clearly associated with muscle development and functions such as “muscle contraction,” “muscle structure development,” and “muscle system process.” Furthermore, the ovary was found to be enriched as a specifically expressing tissue for RUNX3-induced demethylated genes, which is consistent with the importance of RUNX3 previously shown in ovary function [20]. In addition, lipid-associated GOs such as “lipid transport” and “lipid localization” were significantly enriched in demethylated genes in CEBPA-overexpressing cells. CEBPA is a key transcription factor in adipogenesis, and the ectopic expression of CEBPA together with PPARG was previously shown to induce NIH-3T3 fibroblasts to differentiate into adipocytes [21, 22]. In contrast, no significantly enriched GOs or specifically expressing tissues associated with the overexpressed TF functions were detected at promoter-associated demethylated CpG regions for each non-DNA-demethylating TF. These results validated our screening system and indicate that DNA-demethylating TFs demethylate genomic regions associated with corresponding biological functions.
Fig. 3.
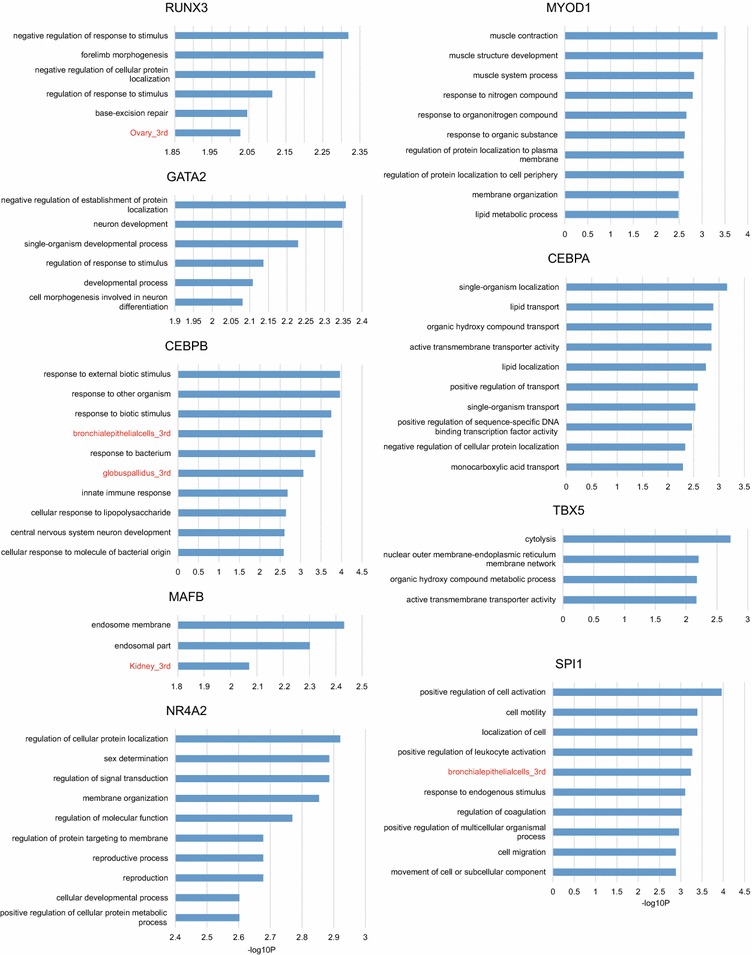
Gene ontology and specifically expressing tissue enrichment analysis. Bar plots showing enrichment of gene ontology (black labels) and specifically expressing tissues (red labels). X-axis represents −log10 P of Fisher’s exact test. Specifically expressed tissues were analyzed using Affymetrix GNF_U133A tissue expression data
Target CpG methylation levels of DNA-demethylating TFs
Highly methylated chromatin regions typically have low accessibility [23–26]; however, pioneer TFs can bind to closed chromatin and initiate its opening [27–31], suggesting that they have preferential epigenetic status for binding. We evaluated target CpG methylation levels among DNA-demethylating TFs and showed that they tended to be significantly biased toward hypermethylation, although average methylation levels varied (Fig. 4). Of note, CEBPA methylation levels were significantly lower than those of other DNA-demethylating TFs. On the other hand, original CpG methylation levels of DNA demethylated regions in non-DNA-demethylating TFs tended to be low with a high level of variance, suggesting that DNA demethylation by non-DNA-demethylating TFs is nonspecific and caused by multiple factors. These results indicate that DNA-demethylating TFs target highly methylated CpGs.
Fig. 4.
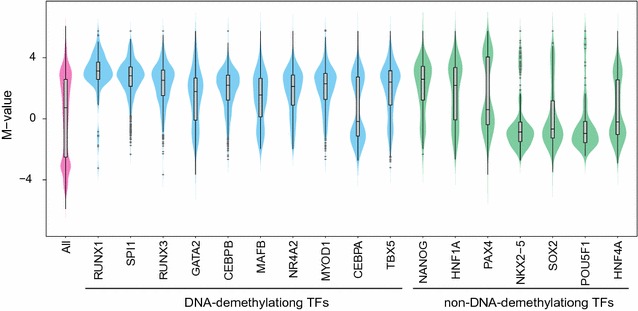
Original DNA methylation level of TF-mediated DNA demethylation targets. Violin plots showing kernel density distribution plot of original M-values for TF-mediated DNA demethylation targets. M-value distribution of all probes, of demethylated probes by DNA-demethylating TFs, and of demethylated probes by non-DNA-demethylating TFs is shown as magenta, cyan, and green, respectively. Interquartile ranges are shown as boxes in the overlaid boxplots (gray), and medians are shown as horizontal bars. Maximums and minimums are the upper and lower ends of the black line. Outliers (> Q3 + interquartile range × 1.5) are shown as gray dots
Effects of TF-mediated DNA demethylation
We previously showed that RUNX1 induced local DNA demethylation [18]. To investigate local DNA demethylation involving other DNA-demethylating TFs, we performed bisulfite-PCR sequencing of selected demethylated regions. We observed significant demethylation at the demethylated CpG probe position as well as at surrounding CpGs (Fisher’s exact test), suggesting that DNA demethylation by DNA-demethylating TFs influences an area surrounding the binding site (Fig. 5a). To estimate the demethylation range, we fitted a Gaussian distribution model to the peak of the enrichment score for the eight identified DNA-demethylating TFs and SPI1 (Fig. 5b and Additional file 3: Figure S2). We regarded ± 2σ of the fitted standard curve, which covers about 95% of the probability, as the TF demethylated range. 2σ for RUNX3, GATA2, CEBPB, MAFB, NR4A2, MYOD1, CEBPA, TBX5, and SPI1 was 161.3, 106.1, 320.8, 148.1, 122.5, 227.1, 198.2, 296.0, and 161.6, respectively, suggesting that DNA-demethylating TFs induce local DNA demethylation to a range of a few hundred base pairs.
Fig. 5.
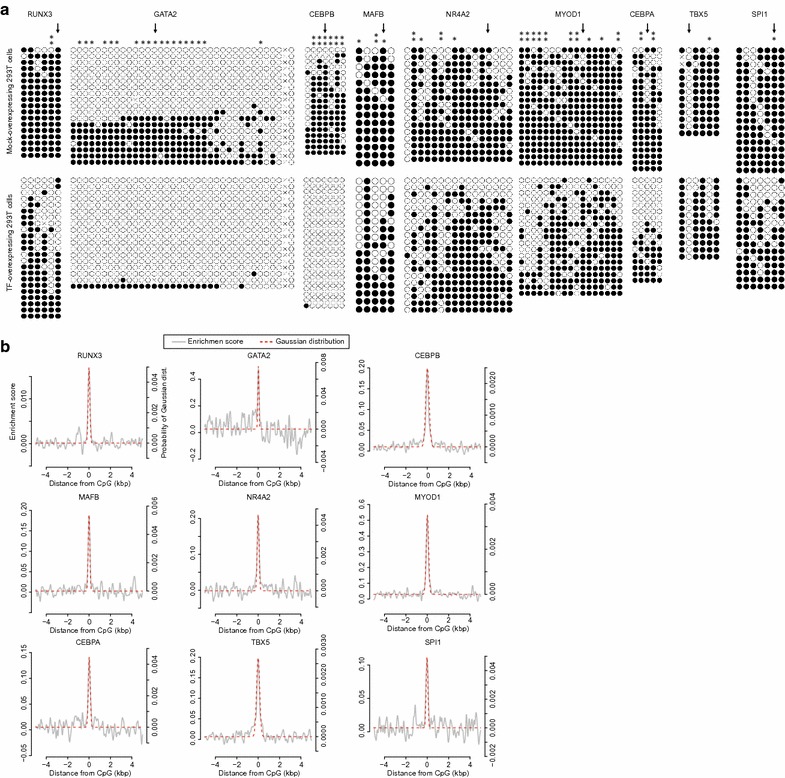
Local effect of TF-mediated DNA demethylation. a DNA methylation patterns of demethylated regions, selected from methylation array results, were analyzed by bisulfite-PCR sequencing. Each circle represents a cytosine of CpG. Black and white circles indicate methylated and unmethylated cytosine, respectively. Horizontal lines represent the sequencing result of each sub-clone. Arrows represent the position of demethylated CpGs identified by methylation array analysis (*p < 0.05; **p < 0.01; Fisher’s exact test). b Gaussian distribution model fitting of enrichment score peaks. X-axis shows the distance from demethylated CpGs. Y-axis represents the enrichment score (left) and probability of the Gaussian distribution model (right). Gray plots are enrichment scores from Figs. 1c and 2b, and red dotted plots are fitted Gaussian distributions
Proteins within the same family share demethylation targets
The DNA-demethylating TFs identified in this study and our previous RUNX1 study [18] belong to the same family (RUNX1 and RUNX3 or CEBPA and CEBPB) and essentially recognize the same binding motifs (Fig. 6a). To evaluate the specificity of DNA demethylation caused by TFs of the same family, we examined the overlap of demethylated CpGs (Fig. 6b). Of 170 and 1119 demethylated CpGs in RUNX1- and RUNX3-overexpressing cells, 146 significantly overlapped (85.9% of RUNX1 and 13.0% of RUNX3, respectively) (p value = 2.2 × 10⁻¹⁶, Fisher’s exact test). Moreover, of 344 and 789 demethylated CpGs in CEBPA- and CEBPB-overexpressing cells, the overlap was 206 (60.0% of CEBPA and 26.1% of CEBPB, respectively) (p value = 2.2 × 10⁻¹⁶, Fisher’s exact test). These results indicate that the demethylation targets of DNA-demethylating TFs in the same family tend to coincide but do not completely overlap with each other.
Fig. 6.
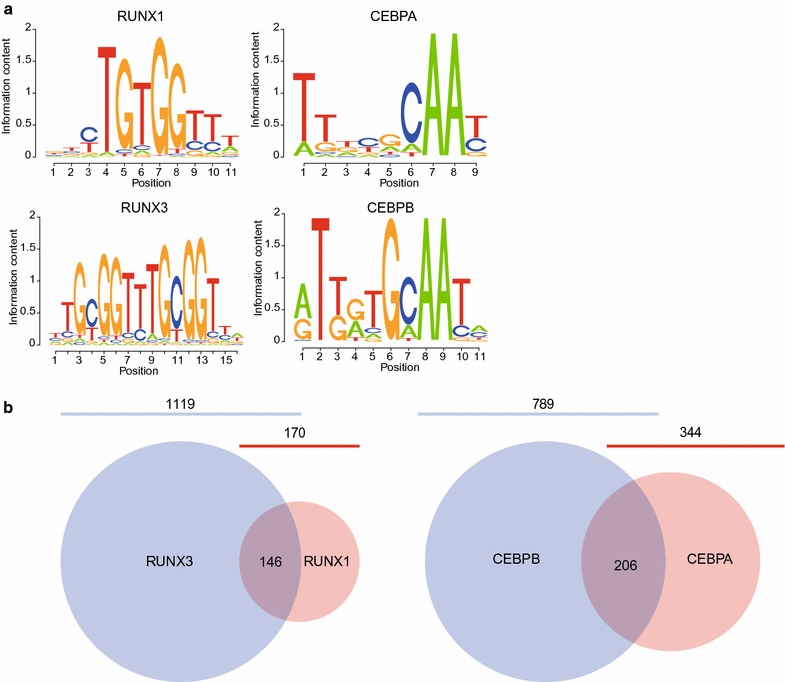
Family DNA-demethylating TFs share demethylation targets. a Position weight matrix-based sequence logos of TFBMs for RUNX1 (top left), RUNX3 (bottom left), CEBPA (top right), and CEBPB (bottom right). The height of each letter represents the probability of TF appearance at binding sites. b Overlap of demethylated CpGs between RUNX1-overexpressing (red) and RUNX3-overexpressing (blue) cells and between CEBPA-overexpressing (red) and CEBPB-overexpressing (blue) cells. The number of overlapping CpGs is shown at the intersection of each circle. The total number of demethylated CpGs is depicted as a particular circle size and is shown above the circles
Discussion
DNA methylation dynamics are key to the understanding of development and cellular differentiation. In this study, we developed a screening system to identify TFs that regulate site-directed DNA methylation changes. The system involves the ectopic expression of TFs in 293T cells and overrepresentation analysis of the corresponding TFBM at differentially methylated regions. The use of 293T cells as model cells offers the advantages of easy handling, efficient transfection, and sufficient levels of ectopic TF expression, although 293T cells may not be suitable if the target TF is already highly expressing. Furthermore, because expression profile of binding partners and chromatin status of the model cells are also affect the results, different model cell types may lead slightly different results. Therefore, validation in a different cell type(s) strengthens of the results of our system. Thus, our system is applicable to a broad range of TFs, including TFs expressed in rare cell types and/or pathological samples that are difficult to obtain. Furthermore, the flexibility of our system enables us to analyze the relationship between abnormal DNA methylation statuses caused by mutations in DNA-demethylating TFs and the onset of diseases such as cancer.
Some TFs are involved in DNA demethylation, interacting with TET proteins [14–18]. According to FANTOM5 data (http://fantom.gsc.riken.jp/5/), expression of TETs is low in HEK293 cells (TET1: 12.65 tpm, TET2: 7.04 tpm, TET3: 1.35 tpm, GAPDH: 3259.64 tpm), but it was enough to induce RUNX1-mediated active DNA demethylation in proliferation-arrested RUNX1-overexpressing 293T cells. In addition, several reports suggest overlapping function of TETs [32, 33]. Therefore, all TET proteins may contribute to the DNA demethylation in our system.
Although our system is only applicable to TFs with a known binding motif because of TFBM overrepresentation analysis, it may be possible to predict DNA-demethylating TFs without TFBM information. For instance, we showed that DNA-demethylating TFs, but not non-DNA-demethylating TFs, significantly induced more demethylated regions than methylated ones (Fig. 2c). Therefore, the ratio between demethylated and methylated CpGs could be used as an indicator of DNA-demethylating TFs.
The ectopic expression of TFs in 293T cells may not completely reflect physiological conditions. Therefore, although the biological role of TF-mediated DNA demethylation can be predicted by GO and tissue enrichment analysis, further analysis should be performed using samples reflecting physiological conditions. One way to achieve this is a perturbation approach such as TF knockdown/out. However, the outcomes of this are difficult to distinguish as a DNA demethylation function or other TF function because one TF typically possesses multiple functions [34]. Recently, CRISPR/Cas9 or TAL-effector system-based methods for targeting DNA methylation or demethylation of specific regions have been reported [35–41]. Although these techniques have yet to be established, they are promising approaches to analyze the biological function of TF-mediated DNA methylation changes under physiological conditions.
Our findings showed that DNA-demethylating TFs induce local DNA demethylation that ranges over a few hundred base pairs. Typical differential methylation analysis adopts a sliding window of around 1 kb across the genome [42], but our results suggest that a broader window size may miss DNA-demethylating TF-mediated DNA demethylation. Indeed, during cell reprogramming, local DNA demethylation at key TF binding sites at early time points would not be detected by broader differential methylation analysis [43]. Because we estimated the effect of the DNA-demethylating TFs based on the methylation array data, validation experiments will be needed to precisely determine the demethylation range.
The TFs RUNX1 and RUNX3, and CEBPA and CEBPB, respectively, share a large number of demethylation targets (Fig. 6b), which is consistent with the functional redundancy between RUNX1 and RUNX3 [44] or between CEBPA and CEBPB [45]. However, the expression spectra differ among the same family of TFs [46]. RUNX1 is most highly expressed in CD14+ monocytes, while the highest RUNX3 expression is detected in CD8+ T cells and natural killer cells [47]. Similarly, CEBPA is most highly expressed in mature adipocytes, while CEBPB is mainly expressed in myeloid lineage cells [47]. Furthermore, although CEBPA and CEBPB proteins generally occupy the same chromatin regions, they show distinct quantitatively divergent temporal patterns because of their different association partners during liver regeneration [48]. Therefore, as well as TFBM, expression patterns and association partners may also determine the spatiotemporal regulation of DNA demethylation dynamics.
Our system can theoretically identify TFs involved in both DNA methylation and demethylation. Nonetheless, it was surprising that we identified only eight out of 15 TFs as DNA-demethylating TFs and that we found no TFs involved in DNA methylation. Because the expression of de novo DNMTs (DNMT3A and DNMT3B) is low in HEK293 cells (4.03 and 9.12 tpm, respectively, according to FANTOM5 data), the activity of the enzyme may not be sufficient. Therefore, compensating the de novo methylation activity, co-overexpression of de novo DNMT with the TF may enable our system to identify the TFs involved in DNA methylation. On the other hand, we have reported that enrichment of TF binding motifs is biased toward demethylated regions rather than methylated regions in hematopoietic differentiation [18]. Therefore, the results of our study also likely reflected the predominance of DNA demethylation, although the selection of these 15 TFs was manual curation based on literature information, which may have a bias. Thus, TFs involved in DNA demethylation represent a novel major functional subclass, which could be further explored by scaling up our analysis.
Under physiological conditions, DNA binding factors such as TFs have been shown to locally influence DNA methylation [49]. We previously identified several significantly overrepresented TFBMs including the RUNX1 motif in DNA demethylated regions of multiple hematopoietic differentiation pathways [18]. This suggested that many TFs are involved in site-specific DNA methylation changes. Large-scale research projects such as the Roadmap Epigenetics Project and the Blueprint project have made genome-wide methylome data publicly available [50, 51]. These data can be used to systematically identify overrepresented TFBM in differentially methylated regions, which will reveal a more global view of the TF involvement in DNA methylation changes. However, because the same or similar TFBMs are shared by a set of TFs [52], further follow-up experiments are necessary to fully identify corresponding DNA-demethylating TFs. Our approach can be used to identify such TFs because of the one–one relationship between overrepresented motifs and overexpressed TFs.
Conclusions
Our results emphasize the usefulness of the developed screening system for the identification of DNA-demethylating TFs. Furthermore, we used the system to identify eight novel DNA-demethylating TFs that are likely to play important roles in biological processes.
Methods
Cell culture
293T cells were acquired from the RIKEN Bio Resource Center (BRC) and were cultured in Dulbecco’s modified Eagle’s medium (Wako Pure Chemical Industries, Ltd, Osaka, Japan) supplemented with 10% fetal bovine serum and penicillin/streptomycin (100 U/mL, 100 µg/mL; Thermo Fisher Scientific Inc., Waltham, MA, USA).
Ectopic expression of target TF genes
Target TF genes were sub-cloned into the CSII-EF-RfA-IRES2-puro vector [18] by the Gateway LR recombination technique. Lentivirus vector production was performed as previously described [53] and then used to infect 293T cells with a multiplicity of infection of 1. Puromycin selection at 2 μg/mL was carried out for 1 week. qRT-PCR was performed as previously described [53] to confirm mRNA expression levels. The primer set for each target is shown in Additional file 4.
Methylation array analysis
The Infinium™ HumanMethylation450 BeadChip (Illumina Inc., San Diego, CA, USA) was used to profile DNA methylation as previously described [18]. Briefly, genomic DNA was isolated using a NucleoSpin® Tissue Kit (Macherey–Nagel GmbH & Co., Düren, Germany) followed by bisulfite C–T conversion using the EZ DNA Methylation-Gold™ Kit (Zymo Research Corp., Irvine, CA, USA) according to the manufacturer’s instructions. Genomic DNA was then subjected to methylation array analysis according to the manufacturer’s instructions. Normalization and the M-value, a statistical metric for log-scale methylation levels, were computed using the lumi Bioconductor package [54]. An M-value difference (∆M) cutoff of ≥ 2 was used to identify differentially methylated CpGs.
Screening of site-directed DNA demethylation-inducing transcription factors
We performed TFBM overrepresentation analysis as previously described [18]. Briefly, sequences located ± 5 kbp from the methylated or demethylated probe positions and the same number of randomly selected probes were extracted from version hg19 of the human genome sequence. TFBM identification was performed using the matchPWM command of the Biostrings package, and the MotifDb database package of the Bioconductor or SwissRegulon weight matrix database (http://swissregulon.unibas.ch/data/hg19_f5/hg19_weight_matrices_v2) was used for the overrepresentation analysis. Enrichment scores were calculated using the following formula:
Here, i and j are identified motifs in differentially methylated regions and randomly selected controls, respectively, and χ t and χ c donate motif positions in differentially methylated regions and randomly selected controls, respectively. The smoothing parameter h was set at 50, and K was calculated as a Gaussian kernel function as follows:
To judge whether the TF is DNA-demethylating TF, first, statistical overrepresentation of the motif in differentially methylated CpG regions compared with randomly selected CpG regions was computed (Poisson distribution model, p value < 0.00001). Next, we further selected overrepresented motifs with a maximum enrichment score at the methylated/demethylated probes of Q3 + IQR × 3 in a ± 5-kbp region.
ChIP-qPCR analysis
Chromatin immunoprecipitation (ChIP) assays were performed as described previously [55] using anti-SPI1 (Cell Signaling Technology, Danvers, MA, USA; cat no. 2258) antibody. ChIPed DNA was subjected to real-time PCR. Fold enrichment is calculated as the ration of ChIPed DNA to IgG control. The primers are shown in Additional file 5.
Bisulfite sequencing
Genomic DNA was subjected to bisulfite C–T conversion, as described above. The target genomic region was amplified from genomic DNA using EpiTaq™ HS (Takara Bio Inc., Shiga, Japan) using primers shown in Additional file 6. The PCR products were cloned into the pTA2 plasmid using a TArget™ Clone Kit (Toyobo Co., Ltd., Osaka, Japan) and sequenced using BigDye® Ver3.1 (Thermo Fisher Scientific Inc.) with the 3730 × 1 DNA Analyzer (Thermo Fisher Scientific Inc.). Twenty-four clones were sequenced for each target.
Standard curve fitting
Noise was defined as a range between the minimum and maximum enrichment scores of the ± 5-kbp region except for the central peak region. The signal was defined as the central peak, excluding the noise range. A Gaussian distribution model was then fitted to the signal, and 2σ was calculated based on the fitted Gaussian distribution model.
Additional files
Additional file 1: Figure S1. TF overexpression and TFBM overrepresentation in methylated regions. (a) ChIP-seq analysis for PU.1 binding. Fold enrichment is the ration of ChIPed DNA and IgG control. Error bars represent SD. The experiments were performed in 2 biological replicates. (b) Fold change of overexpressed TFs. X- and Y-axes show overexpressed TFs and fold change of the expression compared with mock control (log2 scale), respectively. Mean and standard deviation (error bars) are shown. The experiment was performed in triplicate. (c) Distribution of enrichment scores for TF binding motifs within ± 5000 bp of differentially methylated CpGs in TF-overexpressing 293T cells. X- and Y-axes show distance from probe CpG position and enrichment score, respectively. Horizontal lines are enrichment score = 0.
Additional file 2. Full list of gene ontology and specifically expressing tissue enrichment analysis. p values were computed by Fisher’s exact test.
Additional file 3: Figure S2. Schematic workflow of Gaussian distribution model fitting. The signal is detected as the peak closest to the CpG position (pink), and the noise is the range of nonsignal peaks (gray). The Gaussian distribution model was fitted to the signal peak, and ± 2σ was computed.
Additional file 4. Primer list for qRT-PCR.
Additional file 5. Primer list for ChIP-qPCR.
Additional file 6. Primer list for bisulfite-PCR sequencing.
Authors’ contributions
TS participated in the design of the study, devised the methodology, performed the statistical analyses, carried out the molecular biology studies, and drafted the manuscript. SM, EF, YS, HN, and MK carried out the molecular biology studies. HS helped to draft the manuscript, acquired the funding, and supervised the study. All authors read and approved the final manuscript.
Acknowledgements
We thank Horoyuki Miyoshi and RIKEN BRC for providing lentivirus plasmids. We also thank the members of RIKEN CLST DGT. We thank Sarah Williams, PhD, from Edanz Group (www.edanzediting.com) for editing a draft of this manuscript.
Competing interests
The authors declare that they have no competing interests.
Availability of data and materials
The datasets generated and/or analyzed during the current study are available in the NCBI Gene Expression Omnibus (GEO; http://www.ncbi.nlm.nih.gov/geo/) under accession number GSE GSE102822.
Consent for publication
Not applicable.
Ethics approval and consent to participate
Not applicable.
Funding
This work was supported by a research grant from the Ministry of Education, Culture, Sport, Science and Technology of Japan for the RIKEN Center for Life Science Technologies.
Publisher’s Note
Springer Nature remains neutral with regard to jurisdictional claims in published maps and institutional affiliations.
Abbreviations
- TFs
transcription factors
- TFBM
TF binding motif
- 293T-mock
mock control-overexpressing 293T cells
- GO
gene ontology
- tpm
tag per million
Footnotes
Electronic supplementary material
The online version of this article (10.1186/s13072-017-0169-6) contains supplementary material, which is available to authorized users.
Shiori Maeda, Erina Furuhata and Yuri Shimizu contributed equally to this work
Contributor Information
Takahiro Suzuki, Email: takahiro.suzuki.aa@riken.jp.
Shiori Maeda, Email: shiori.maeda@riken.jp.
Erina Furuhata, Email: erina.furuhata@riken.jp.
Yuri Shimizu, Email: yuri.shimizu@riken.jp.
Hajime Nishimura, Email: hajime.nakanishi@riken.jp.
Mami Kishima, Email: mami.ikegami@riken.jp.
Harukazu Suzuki, Email: harukazu.suzuki@riken.jp.
References
- 1.Suzuki MM, Bird A. DNA methylation landscapes: provocative insights from epigenomics. Nat Rev Genet. 2008;9(6):465–476. doi: 10.1038/nrg2341. [DOI] [PubMed] [Google Scholar]
- 2.Smith ZD, Meissner A. DNA methylation: roles in mammalian development. Nat Rev Genet. 2013;14(3):204–220. doi: 10.1038/nrg3354. [DOI] [PubMed] [Google Scholar]
- 3.Shames DS, Girard L, Gao B, Sato M, Lewis CM, Shivapurkar N, Jiang A, Perou CM, Kim YH, Pollack JR, et al. A genome-wide screen for promoter methylation in lung cancer identifies novel methylation markers for multiple malignancies. PLoS Med. 2006;3(12):e486. doi: 10.1371/journal.pmed.0030486. [DOI] [PMC free article] [PubMed] [Google Scholar]
- 4.Baldwin RL, Nemeth E, Tran H, Shvartsman H, Cass I, Narod S, Karlan BY. BRCA1 promoter region hypermethylation in ovarian carcinoma: a population-based study. Cancer Res. 2000;60(19):5329–5333. [PubMed] [Google Scholar]
- 5.Okano M, Xie S, Li E. Cloning and characterization of a family of novel mammalian DNA (cytosine-5) methyltransferases. Nat Genet. 1998;19(3):219–220. doi: 10.1038/890. [DOI] [PubMed] [Google Scholar]
- 6.Xie S, Wang Z, Okano M, Nogami M, Li Y, He WW, Okumura K, Li E. Cloning, expression and chromosome locations of the human DNMT3 gene family. Gene. 1999;236(1):87–95. doi: 10.1016/S0378-1119(99)00252-8. [DOI] [PubMed] [Google Scholar]
- 7.Yen RW, Vertino PM, Nelkin BD, Yu JJ, el-Deiry W, Cumaraswamy A, Lennon GG, Trask BJ, Celano P, Baylin SB. Isolation and characterization of the cDNA encoding human DNA methyltransferase. Nucleic Acids Res. 1992;20(9):2287–2291. doi: 10.1093/nar/20.9.2287. [DOI] [PMC free article] [PubMed] [Google Scholar]
- 8.Hermann A, Goyal R, Jeltsch A. The Dnmt1 DNA-(cytosine-C5)-methyltransferase methylates DNA processively with high preference for hemimethylated target sites. J Biol Chem. 2004;279(46):48350–48359. doi: 10.1074/jbc.M403427200. [DOI] [PubMed] [Google Scholar]
- 9.Kohli RM, Zhang Y. TET enzymes, TDG and the dynamics of DNA demethylation. Nature. 2013;502(7472):472–479. doi: 10.1038/nature12750. [DOI] [PMC free article] [PubMed] [Google Scholar]
- 10.Tahiliani M, Koh KP, Shen Y, Pastor WA, Bandukwala H, Brudno Y, Agarwal S, Iyer LM, Liu DR, Aravind L, et al. Conversion of 5-methylcytosine to 5-hydroxymethylcytosine in mammalian DNA by MLL partner TET1. Science. 2009;324(5929):930–935. doi: 10.1126/science.1170116. [DOI] [PMC free article] [PubMed] [Google Scholar]
- 11.Ito S, D’Alessio AC, Taranova OV, Hong K, Sowers LC, Zhang Y. Role of Tet proteins in 5 mC to 5 hmC conversion, ES-cell self-renewal and inner cell mass specification. Nature. 2010;466(7310):1129–1133. doi: 10.1038/nature09303. [DOI] [PMC free article] [PubMed] [Google Scholar]
- 12.Ito S, Shen L, Dai Q, Wu SC, Collins LB, Swenberg JA, He C, Zhang Y. Tet proteins can convert 5-methylcytosine to 5-formylcytosine and 5-carboxylcytosine. Science. 2011;333(6047):1300–1303. doi: 10.1126/science.1210597. [DOI] [PMC free article] [PubMed] [Google Scholar]
- 13.Maiti A, Drohat AC. Thymine DNA glycosylase can rapidly excise 5-formylcytosine and 5-carboxylcytosine: potential implications for active demethylation of CpG sites. J Biol Chem. 2011;286(41):35334–35338. doi: 10.1074/jbc.C111.284620. [DOI] [PMC free article] [PubMed] [Google Scholar]
- 14.Costa Y, Ding J, Theunissen TW, Faiola F, Hore TA, Shliaha PV, Fidalgo M, Saunders A, Lawrence M, Dietmann S, et al. NANOG-dependent function of TET1 and TET2 in establishment of pluripotency. Nature. 2013;495(7441):370–374. doi: 10.1038/nature11925. [DOI] [PMC free article] [PubMed] [Google Scholar]
- 15.de la Rica L, Rodriguez-Ubreva J, Garcia M, Islam AB, Urquiza JM, Hernando H, Christensen J, Helin K, Gomez-Vaquero C, Ballestar E. PU.1 target genes undergo Tet2-coupled demethylation and DNMT3b-mediated methylation in monocyte-to-osteoclast differentiation. Genome Biol. 2013;14(9):R99. doi: 10.1186/gb-2013-14-9-r99. [DOI] [PMC free article] [PubMed] [Google Scholar]
- 16.Guilhamon P, Eskandarpour M, Halai D, Wilson GA, Feber A, Teschendorff AE, Gomez V, Hergovich A, Tirabosco R, Fernanda Amary M, et al. Meta-analysis of IDH-mutant cancers identifies EBF1 as an interaction partner for TET2. Nat Commun. 2013;4:2166. doi: 10.1038/ncomms3166. [DOI] [PMC free article] [PubMed] [Google Scholar]
- 17.Fujiki K, Shinoda A, Kano F, Sato R, Shirahige K, Murata M. PPARgamma-induced PARylation promotes local DNA demethylation by production of 5-hydroxymethylcytosine. Nat Commun. 2013;4:2262. doi: 10.1038/ncomms3262. [DOI] [PubMed] [Google Scholar]
- 18.Suzuki T, Shimizu Y, Furuhata E, Maeda S, Kishima M, Nishimura H, Enomoto S, Hayashizaki Y, Suzuki H. RUNX1 regulates site specificity of DNA demethylation by recruitment of DNA demethylation machineries in hematopoietic cells. Blood Adv. 2017;1:1699–1711. doi: 10.1182/bloodadvances.2017005710. [DOI] [PMC free article] [PubMed] [Google Scholar]
- 19.Ebihara T, Song C, Ryu SH, Plougastel-Douglas B, Yang L, Levanon D, Groner Y, Bern MD, Stappenbeck TS, Colonna M, et al. Runx3 specifies lineage commitment of innate lymphoid cells. Nat Immunol. 2015;16(11):1124–1133. doi: 10.1038/ni.3272. [DOI] [PMC free article] [PubMed] [Google Scholar]
- 20.Ojima F, Saito Y, Tsuchiya Y, Kayo D, Taniuchi S, Ogoshi M, Fukamachi H, Takeuchi S, Takahashi S. Runx3 transcription factor regulates ovarian functions and ovulation in female mice. J Reprod Dev. 2016;62(5):479–486. doi: 10.1262/jrd.2016-005. [DOI] [PMC free article] [PubMed] [Google Scholar]
- 21.Cao Z, Umek RM, McKnight SL. Regulated expression of three C/EBP isoforms during adipose conversion of 3T3-L1 cells. Genes Dev. 1991;5(9):1538–1552. doi: 10.1101/gad.5.9.1538. [DOI] [PubMed] [Google Scholar]
- 22.Yeh WC, Cao Z, Classon M, McKnight SL. Cascade regulation of terminal adipocyte differentiation by three members of the C/EBP family of leucine zipper proteins. Genes Dev. 1995;9(2):168–181. doi: 10.1101/gad.9.2.168. [DOI] [PubMed] [Google Scholar]
- 23.Domcke S, Bardet AF, Adrian Ginno P, Hartl D, Burger L, Schubeler D. Competition between DNA methylation and transcription factors determines binding of NRF1. Nature. 2015;528(7583):575–579. doi: 10.1038/nature16462. [DOI] [PubMed] [Google Scholar]
- 24.Phillips JE, Corces VG. CTCF: master weaver of the genome. Cell. 2009;137(7):1194–1211. doi: 10.1016/j.cell.2009.06.001. [DOI] [PMC free article] [PubMed] [Google Scholar]
- 25.Hark AT, Schoenherr CJ, Katz DJ, Ingram RS, Levorse JM, Tilghman SM. CTCF mediates methylation-sensitive enhancer-blocking activity at the H19/Igf2 locus. Nature. 2000;405(6785):486–489. doi: 10.1038/35013106. [DOI] [PubMed] [Google Scholar]
- 26.Filippova GN, Thienes CP, Penn BH, Cho DH, Hu YJ, Moore JM, Klesert TR, Lobanenkov VV, Tapscott SJ. CTCF-binding sites flank CTG/CAG repeats and form a methylation-sensitive insulator at the DM1 locus. Nat Genet. 2001;28(4):335–343. doi: 10.1038/ng570. [DOI] [PubMed] [Google Scholar]
- 27.Serandour AA, Avner S, Percevault F, Demay F, Bizot M, Lucchetti-Miganeh C, Barloy-Hubler F, Brown M, Lupien M, Metivier R, et al. Epigenetic switch involved in activation of pioneer factor FOXA1-dependent enhancers. Genome Res. 2011;21(4):555–565. doi: 10.1101/gr.111534.110. [DOI] [PMC free article] [PubMed] [Google Scholar]
- 28.Sherwood RI, Hashimoto T, O’Donnell CW, Lewis S, Barkal AA, van Hoff JP, Karun V, Jaakkola T, Gifford DK. Discovery of directional and nondirectional pioneer transcription factors by modeling DNase profile magnitude and shape. Nat Biotechnol. 2014;32(2):171–178. doi: 10.1038/nbt.2798. [DOI] [PMC free article] [PubMed] [Google Scholar]
- 29.Oldfield AJ, Yang P, Conway AE, Cinghu S, Freudenberg JM, Yellaboina S, Jothi R. Histone-fold domain protein NF-Y promotes chromatin accessibility for cell type-specific master transcription factors. Mol Cell. 2014;55(5):708–722. doi: 10.1016/j.molcel.2014.07.005. [DOI] [PMC free article] [PubMed] [Google Scholar]
- 30.Soufi A, Garcia MF, Jaroszewicz A, Osman N, Pellegrini M, Zaret KS. Pioneer transcription factors target partial DNA motifs on nucleosomes to initiate reprogramming. Cell. 2015;161(3):555–568. doi: 10.1016/j.cell.2015.03.017. [DOI] [PMC free article] [PubMed] [Google Scholar]
- 31.Liu Z, Kraus WL. Catalytic-independent functions of PARP-1 determine Sox2 pioneer activity at intractable genomic loci. Mol Cell. 2017;65(4):589–603 e589. doi: 10.1016/j.molcel.2017.01.017. [DOI] [PMC free article] [PubMed] [Google Scholar]
- 32.Li C, Lan Y, Schwartz-Orbach L, Korol E, Tahiliani M, Evans T, Goll MG. Overlapping requirements for Tet2 and Tet3 in normal development and hematopoietic stem cell emergence. Cell Rep. 2015;12(7):1133–1143. doi: 10.1016/j.celrep.2015.07.025. [DOI] [PMC free article] [PubMed] [Google Scholar]
- 33.Deplus R, Delatte B, Schwinn MK, Defrance M, Mendez J, Murphy N, Dawson MA, Volkmar M, Putmans P, Calonne E, et al. TET2 and TET3 regulate GlcNAcylation and H3K4 methylation through OGT and SET1/COMPASS. EMBO J. 2013;32(5):645–655. doi: 10.1038/emboj.2012.357. [DOI] [PMC free article] [PubMed] [Google Scholar]
- 34.Scully KM, Jacobson EM, Jepsen K, Lunyak V, Viadiu H, Carriere C, Rose DW, Hooshmand F, Aggarwal AK, Rosenfeld MG. Allosteric effects of Pit-1 DNA sites on long-term repression in cell type specification. Science. 2000;290(5494):1127–1131. doi: 10.1126/science.290.5494.1127. [DOI] [PubMed] [Google Scholar]
- 35.Maeder ML, Angstman JF, Richardson ME, Linder SJ, Cascio VM, Tsai SQ, Ho QH, Sander JD, Reyon D, Bernstein BE, et al. Targeted DNA demethylation and activation of endogenous genes using programmable TALE-TET1 fusion proteins. Nat Biotechnol. 2013;31(12):1137–1142. doi: 10.1038/nbt.2726. [DOI] [PMC free article] [PubMed] [Google Scholar]
- 36.Liu XS, Wu H, Ji X, Stelzer Y, Wu X, Czauderna S, Shu J, Dadon D, Young RA, Jaenisch R. Editing DNA Methylation in the Mammalian Genome. Cell. 2016;167(1):233–47 e217. doi: 10.1016/j.cell.2016.08.056. [DOI] [PMC free article] [PubMed] [Google Scholar]
- 37.Amabile A, Migliara A, Capasso P, Biffi M, Cittaro D, Naldini L, Lombardo A. Inheritable Silencing of Endogenous Genes by Hit-and-Run Targeted Epigenetic Editing. Cell. 2016;167(1):219–32 e214. doi: 10.1016/j.cell.2016.09.006. [DOI] [PMC free article] [PubMed] [Google Scholar]
- 38.Xu X, Tao Y, Gao X, Zhang L, Li X, Zou W, Ruan K, Wang F, Xu GL, Hu R. A CRISPR-based approach for targeted DNA demethylation. Cell Discov. 2016;2:16009. doi: 10.1038/celldisc.2016.9. [DOI] [PMC free article] [PubMed] [Google Scholar]
- 39.Vojta A, Dobrinic P, Tadic V, Bockor L, Korac P, Julg B, Klasic M, Zoldos V. Repurposing the CRISPR-Cas9 system for targeted DNA methylation. Nucleic Acids Res. 2016;44(12):5615–5628. doi: 10.1093/nar/gkw159. [DOI] [PMC free article] [PubMed] [Google Scholar]
- 40.Xiong T, Meister GE, Workman RE, Kato NC, Spellberg MJ, Turker F, Timp W, Ostermeier M, Novina CD. Targeted DNA methylation in human cells using engineered dCas9-methyltransferases. Sci Rep. 2017;7(1):6732. doi: 10.1038/s41598-017-06757-0. [DOI] [PMC free article] [PubMed] [Google Scholar]
- 41.Morita S, Noguchi H, Horii T, Nakabayashi K, Kimura M, Okamura K, Sakai A, Nakashima H, Hata K, Nakashima K, et al. Targeted DNA demethylation in vivo using dCas9-peptide repeat and scFv-TET1 catalytic domain fusions. Nat Biotechnol. 2016;34(10):1060–1065. doi: 10.1038/nbt.3658. [DOI] [PubMed] [Google Scholar]
- 42.Ziller MJ, Hansen KD, Meissner A, Aryee MJ. Coverage recommendations for methylation analysis by whole-genome bisulfite sequencing. Nat Methods. 2015;12(3):230–232. doi: 10.1038/nmeth.3152. [DOI] [PMC free article] [PubMed] [Google Scholar]
- 43.Lee DS, Shin JY, Tonge PD, Puri MC, Lee S, Park H, Lee WC, Hussein SM, Bleazard T, Yun JY, et al. An epigenomic roadmap to induced pluripotency reveals DNA methylation as a reprogramming modulator. Nat Commun. 2014;5:5619. doi: 10.1038/ncomms6619. [DOI] [PMC free article] [PubMed] [Google Scholar]
- 44.Klunker S, Chong MM, Mantel PY, Palomares O, Bassin C, Ziegler M, Ruckert B, Meiler F, Akdis M, Littman DR, et al. Transcription factors RUNX1 and RUNX3 in the induction and suppressive function of Foxp3 + inducible regulatory T cells. J Exp Med. 2009;206(12):2701–2715. doi: 10.1084/jem.20090596. [DOI] [PMC free article] [PubMed] [Google Scholar]
- 45.Lopez RG, Garcia-Silva S, Moore SJ, Bereshchenko O, Martinez-Cruz AB, Ermakova O, Kurz E, Paramio JM, Nerlov C. C/EBPalpha and beta couple interfollicular keratinocyte proliferation arrest to commitment and terminal differentiation. Nat Cell Biol. 2009;11(10):1181–1190. doi: 10.1038/ncb1960. [DOI] [PubMed] [Google Scholar]
- 46.Levanon D, Brenner O, Negreanu V, Bettoun D, Woolf E, Eilam R, Lotem J, Gat U, Otto F, Speck N, et al. Spatial and temporal expression pattern of Runx3 (Aml2) and Runx1 (Aml1) indicates non-redundant functions during mouse embryogenesis. Mech Dev. 2001;109(2):413–417. doi: 10.1016/S0925-4773(01)00537-8. [DOI] [PubMed] [Google Scholar]
- 47.Forrest AR, Kawaji H, Rehli M, Baillie JK, de Hoon MJ, Haberle V, Lassmann T, Kulakovskiy IV, Lizio M, Itoh M, et al. A promoter-level mammalian expression atlas. Nature. 2014;507(7493):462–470. doi: 10.1038/nature13182. [DOI] [PMC free article] [PubMed] [Google Scholar]
- 48.Jakobsen JS, Waage J, Rapin N, Bisgaard HC, Larsen FS, Porse BT. Temporal mapping of CEBPA and CEBPB binding during liver regeneration reveals dynamic occupancy and specific regulatory codes for homeostatic and cell cycle gene batteries. Genome Res. 2013;23(4):592–603. doi: 10.1101/gr.146399.112. [DOI] [PMC free article] [PubMed] [Google Scholar]
- 49.Stadler MB, Murr R, Burger L, Ivanek R, Lienert F, Scholer A, van Nimwegen E, Wirbelauer C, Oakeley EJ, Gaidatzis D, et al. DNA-binding factors shape the mouse methylome at distal regulatory regions. Nature. 2011;480(7378):490–495. doi: 10.1038/nature10716. [DOI] [PubMed] [Google Scholar]
- 50.Roadmap Epigenomics C, Kundaje A, Meuleman W, Ernst J, Bilenky M, Yen A, Heravi-Moussavi A, Kheradpour P, Zhang Z, Wang J, et al. Integrative analysis of 111 reference human epigenomes. Nature. 2015;518(7539):317–330. doi: 10.1038/nature14248. [DOI] [PMC free article] [PubMed] [Google Scholar]
- 51.Farlik M, Halbritter F, Muller F, Choudry FA, Ebert P, Klughammer J, Farrow S, Santoro A, Ciaurro V, Mathur A, et al. DNA methylation dynamics of human hematopoietic stem cell differentiation. Cell Stem Cell. 2016;19(6):808–822. doi: 10.1016/j.stem.2016.10.019. [DOI] [PMC free article] [PubMed] [Google Scholar]
- 52.Wei GH, Badis G, Berger MF, Kivioja T, Palin K, Enge M, Bonke M, Jolma A, Varjosalo M, Gehrke AR, et al. Genome-wide analysis of ETS-family DNA-binding in vitro and in vivo. EMBO J. 2010;29(13):2147–2160. doi: 10.1038/emboj.2010.106. [DOI] [PMC free article] [PubMed] [Google Scholar]
- 53.Suzuki T, Nakano-Ikegaya M, Yabukami-Okuda H, de Hoon M, Severin J, Saga-Hatano S, Shin JW, Kubosaki A, Simon C, Hasegawa Y, et al. Reconstruction of monocyte transcriptional regulatory network accompanies monocytic functions in human fibroblasts. PLoS ONE. 2012;7(3):e33474. doi: 10.1371/journal.pone.0033474. [DOI] [PMC free article] [PubMed] [Google Scholar]
- 54.Du P, Zhang X, Huang CC, Jafari N, Kibbe WA, Hou L, Lin SM. Comparison of Beta-value and M-value methods for quantifying methylation levels by microarray analysis. BMC Bioinform. 2010;11:587. doi: 10.1186/1471-2105-11-587. [DOI] [PMC free article] [PubMed] [Google Scholar]
- 55.Nishida H, Suzuki T, Ookawa H, Tomaru Y, Hayashizaki Y. Comparative analysis of expression of histone H2a genes in mouse. BMC Genom. 2005;6:108. doi: 10.1186/1471-2164-6-108. [DOI] [PMC free article] [PubMed] [Google Scholar]
Associated Data
This section collects any data citations, data availability statements, or supplementary materials included in this article.
Supplementary Materials
Additional file 1: Figure S1. TF overexpression and TFBM overrepresentation in methylated regions. (a) ChIP-seq analysis for PU.1 binding. Fold enrichment is the ration of ChIPed DNA and IgG control. Error bars represent SD. The experiments were performed in 2 biological replicates. (b) Fold change of overexpressed TFs. X- and Y-axes show overexpressed TFs and fold change of the expression compared with mock control (log2 scale), respectively. Mean and standard deviation (error bars) are shown. The experiment was performed in triplicate. (c) Distribution of enrichment scores for TF binding motifs within ± 5000 bp of differentially methylated CpGs in TF-overexpressing 293T cells. X- and Y-axes show distance from probe CpG position and enrichment score, respectively. Horizontal lines are enrichment score = 0.
Additional file 2. Full list of gene ontology and specifically expressing tissue enrichment analysis. p values were computed by Fisher’s exact test.
Additional file 3: Figure S2. Schematic workflow of Gaussian distribution model fitting. The signal is detected as the peak closest to the CpG position (pink), and the noise is the range of nonsignal peaks (gray). The Gaussian distribution model was fitted to the signal peak, and ± 2σ was computed.
Additional file 4. Primer list for qRT-PCR.
Additional file 5. Primer list for ChIP-qPCR.
Additional file 6. Primer list for bisulfite-PCR sequencing.
Data Availability Statement
The datasets generated and/or analyzed during the current study are available in the NCBI Gene Expression Omnibus (GEO; http://www.ncbi.nlm.nih.gov/geo/) under accession number GSE GSE102822.