Abstract
Purpose
Subretinal injections are used to deliver agents in experimental studies of retinal diseases, often through viral vectors. However, few studies have investigated the effects of subretinal injections alone on the structure and function of the healthy or diseased retina, particularly in models of oxygen-induced retinopathy (OIR). We report on the effects of subretinal injections in a rat OIR model, which is used to study mechanisms of retinopathy of prematurity.
Methods
Within 6 h of birth, neonatal rat pups were exposed to repeated cycles of oxygen between 50% and 10% O2 every 24 h for 14 days and subsequently moved to room air. On postnatal day 8 (P8), animals were treated in both eyes with advancement of the injection needle into the vitreous (pilot-treated) or with a subretinal PBS injection (sPBS-treated) or were left untreated (untreated). Additional control animals were exposed to microscope light after eyelid opening only (light-treated). Retinal fundus images were recorded on P26. Areas of the avascular retina and intravitreal neovascularization were determined in flat mounted retinas stained with isolectin B4 on P32. Retinal function of the respective eyes was assessed with the Ganzfeld electroretinogram (ERG) on P31 or P32 and with focal ERG in the central retina on P28 or P29. The thickness of the retinal layers was measured with spectral domain optical coherence tomography (OCT) on P30 and in opsin- and TO-PRO 3-stained retinal cryosections from pups euthanized on P32. Two sections were analyzed in each pup. For each section, three images of three different locations were analyzed accounting for 18 thickness measurements per pup.
Results
Compared to untreated animals, the avascular area of the retina was greater in the pilot-treated (p<0.05) and sPBS-treated eyes (p<0.01), and the sPBS-treated eyes had a greater avascular retinal area compared to the pilot-treated eyes (p<0.01). The intravitreal neovascular area was larger in the sPBS-treated eyes compared to the untreated eyes (p<0.01). The outer nuclear and outer segment layers were thinner in the pilot- (p<0.01) and sPBS-treated eyes (p<0.05) compared to the untreated eyes as measured with OCT and immunohistochemical staining of the retinal cryosections. Compared to the untreated eyes, the amplitudes of the scotopic a- and b-waves in the Ganzfeld ERG were reduced in the pilot-treated eyes (p<0.001 and p<0.01, respectively), but only the a-wave was reduced in the sPBS-treated eyes (p<0.001). The a-wave amplitude in the focal ERG was reduced in the pilot- and sPBS-treated eyes, and no difference was seen in the b-wave amplitude between any of the groups. There was no difference between the light-treated and untreated eyes in the areas of the avascular retina or intravitreal neovascularization or Ganzfeld or focal ERG.
Conclusions
Pilot injections alone without injection into the subretinal space resulted in an increased avascular retinal area, reduced thickness of the photoreceptors, and reduced ERG function compared to the untreated animals. Although subretinal PBS injections further increased the areas of avascular retina and intravitreal neovascularization and resulted in similar retinal thinning compared to the pilot treatment, inner retinal function was improved, as evidenced by higher Ganzfeld b-wave amplitudes. Differences in the Ganzfeld and focal ERGs may indicate that the peripheral retina is more susceptible to remote beneficial effects from potential protective mechanisms induced by subretinal injection. This study stresses the importance of appropriate controls in experiments with subretinal delivery of agents.
Introduction
In experimental settings, subretinal delivery is used to target specific retinal cells, particularly when viral vector delivery systems are used [1,2]. Although intravitreal injection is a desired approach for clinical use, this approach may not be adequate to test mechanisms in experimental models of diseases because of barriers within the eye that interfere with efficient transduction of specific retinal cell types [3]. A few studies have reported effects of subretinal injections in the healthy retina or in models of retinal degeneration. Results remain contradictory, possibly due to the use of different species or animal models and the evaluation of different outcome measures [4-11].
No studies to date have investigated the effect of subretinal injections in models of oxygen-induced retinopathy (OIR), which are used to study mechanisms of retinal vascular diseases. Our goal was to determine the effect of subretinal injections on the retina in the rat 50/10 OIR model, which is frequently used as an animal model to study retinopathy of prematurity. We assigned newborn pups to four groups: receiving subretinal PBS injection (sPBS-injected), pilot hole and advancement of the injection needle into the vitreous without subretinal damage or delivery of PBS (pilot-treated), light-treated as a control for light exposure during the injection procedure (light-treated), or untreated without eyelid opening (untreated). We investigated the areas of avascular retina and intravitreal neovascularization as vascular features of OIR, the retinal structure using spectral domain optical coherence tomography (OCT) and immunohistochemistry (IHC), and function with focal or full-field (Ganzfeld) electroretinography (ERG).
Methods
Animals
Animal care and procedures adhered to the Institute for Laboratory Animal Research Guide for the Care and Use of Laboratory Animals and were approved by the Institutional Animal Care and Use Committee (IACUC) at the University of Utah. Time pregnant Sprague Dawley rats (embryonic day 13–17) were obtained from Charles River (San Diego, CA), kept under a 12 h:12 h light-dark cycle, given ad libitum access to food and water, and allowed to deliver the pups naturally. Dams were kept with their litters until postnatal day (P) 28.
Oxygen-induced retinopathy
Within 6 h of birth, neonatal rat pups were supplemented to litter sizes of 12–16 animals from dams with smaller litters born at the same time. Pups with dams were moved into the OxyCyler (BioSpherix, Parish, NY). Oxygen was cycled between 50% and 10% O2 every 24 h. On P14, the litters were placed in room air until P32 (Figure 1A).
Figure 1.
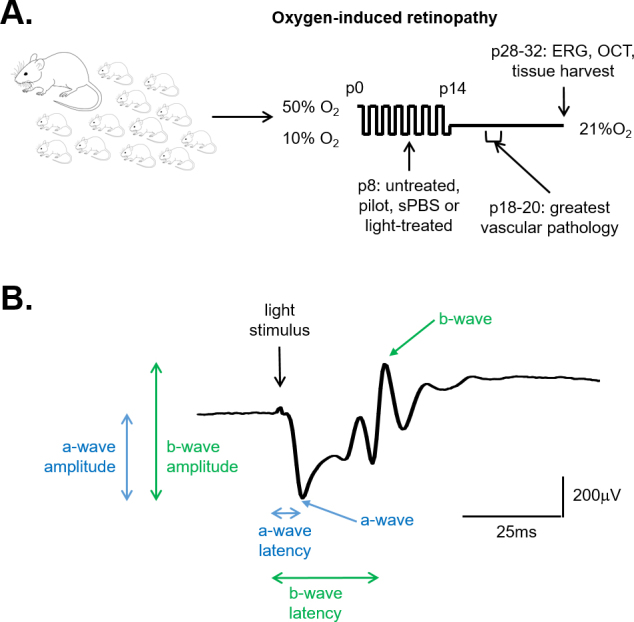
Experimental design and ERG analysis. A: Within 6 h of birth, litters of 12–16 rat pups with the dams were exposed to oxygen fluctuations between 50% and 10% O2 every 24 h. At the beginning of the 50% cycle on postnatal day (P) 8, eyes were treated with subretinal PBS injection (sPBS-treated), pilot injection (pilot-treated), or eyelid opening and light exposure (light-treated), or the animals were left untreated and were returned to oxygen cycling. The animals remained in room air from P14, and some had one or more of the following procedures: retinal imaging on P26, focal electroretinogram (ERG) on P28 or P29 for respective eyes, optical coherence tomography (OCT) on both eyes on P30 and Ganzfeld ERG on P31 or P32 for the respective eyes, and tissue harvest on P32. B: The amplitude of the a-wave was measured from the baseline, the latency from the light stimulus to the trough of the negative going a-wave. The amplitude of the b-wave was determined from the trough of the a-wave to the peak of the b-wave, the latency from the light stimulus to the peak of the b-wave.
Subretinal injections
Initial procedures were performed to optimize subretinal injections. To assess the extent of the injections, some animals were euthanized by intraperitoneal injection of 100 mg/kg ketamine and 10 mg/kg xylazine after the procedures, and the eyes were dissected and examined. To determine the location of the subretinal fluid, some animals received subretinal injections of a pFmCD44 lentivirus tagged with green fluorescent protein (GFP) that transduces Müller cells at P8 and were imaged at P26 with a Micron IV camera (Phoenix Laboratories, Pleasanton, CA) camera. We chose P8 to administer subretinal injections, because this time point was used in different studies to allow sufficient time for lentiviral transduction in OIR [1,2]. Subretinal injection of 1 μl PBS (pH 7.4 without Ca2+ and Mg2+ (catalogue # 10010049, Gibco, Invitrogen, Life Sciences, Thermo Fisher Scientific, Rochester, NY) was chosen for this study, as it is a non-toxic alternative to 0.9% normal saline in intravitreal injections in the mouse [12].
At the beginning of the 50% O2 cycle on P8, animals underwent subretinal injections. The pups were anesthetized with isoflurane using a metered device at an oxygen flow rate of 1-2 l/min, the eyelids were carefully cut open (along the eyelid fissure with a sharp razor blade) and the pupils were dilated with tropicamide eye drops 1% (Bausch + Lomb, Rochester, NY). A 30G needle was used to create a hole in the sclera adjacent to the limbus, and a blunt 33G cannula attached to a Hamilton syringe was advanced into the eye. A slight resistance to the needle indicated Bruch’s membrane was reached. Gently, 1 μl sterile PBS was injected (sPBS-treated). For the pilot-treated eyes, a 30G needle was used to create a hole in the sclera, and a 33G cannula was advanced a short distance into the intravitreal space avoiding the retina and without injecting fluid. Some animals remained untreated without eyelid opening (untreated) or received only opening of the eyelids followed by 30 s exposure to microscope light, which is the time typically needed to administer a subretinal injection (light-treated). Except the untreated or light-treated eyes, all incised eyes received erythromycin ophthalmic ointment 0.5% following the procedures. Litters were returned to the OxyCycler within 1.5 h of the beginning of the procedure.
Retinal imaging
At P26, the animals were anesthetized with ketamine and medetomidine (75/0.5 mg/kg), the pupils were dilated with tropicamide eye drops 1%, and the corneas were lubricated with 0.3% hypromellose gel (GenTeal Eye Gel, Alcon, Novartis, Fort Worth, TX). The objective of a Micron IV retinal camera (Phoenix Laboratories) was advanced near the cornea, and a fundus image was recorded. There was no significant difference in the weights of the animals in untreated or light-treated versus the pilot- or sPBS-treated animals at P28 (p=0.86). We did not observe subretinal bleeding in any of the eyes.
Optical coherence tomography
Spectral domain optical coherence tomography (OCT) was recorded on P30 using Image-Guided OCT (Phoenix Laboratories). The animals were anesthetized using ketamine and medetomidine (75/0.5 mg/kg), the pupils were dilated with tropicamide eye drops 1%, and the corneas were hydrated with 0.3% hypromellose gel. The lens of the OCT was advanced near the cornea, and the retinal image was brought into focus. The measurement area was chosen approximately one diameter away from the optic nerve head. The thicknesses of the retinal layers (photoreceptor outer segments and outer nuclear layer (PRS + ONL), the outer plexiform and inner nuclear layers (OPL + INL), and the inner plexiform and ganglion cell layers (IPL + GCL) and the total retina) were each measured from captured images using Insight software (Phoenix Laboratories). As the OCT measurements were taken at the same distance to the optic nerve head, the data were not normalized to the total retinal thickness, which was not expected to vary substantially.
Flat mounted retinas and immunohistochemistry
The animals were humanely euthanized by intraperitoneal injection of 100 mg/kg ketamine and 10 mg/kg xylazine, followed by cervical dislocation, on P32, and then the eyes were enucleated and dissected free of connective tissue and ocular muscles. For the flat mounted retinas, the eyes were fixed in 4% paraformaldehyde (PFA) in PBS for 30 min and in HistoChoice tissue fixative (Sigma Aldrich, St. Louis, MO) overnight. The retinas were isolated, blocked with 10% normal goat serum in 0.5% Triton-X-100/PBS for 1 h at room temperature, stained with isolectin GS-IB4 conjugated with an Alexa Fluor 488 or 568 fluorophore for 48 h, and mounted with Fluoromount-G mounting media (SouthernBiotech, Birmingham, AL). Images of the flat mounted retinas were collected at a 4X magnification with an Olympus IX81 microscope and stitched together using MetaMorph software (Molecular Devices, Sunnyvale, CA). The total retinal area and the avascular retina and intravitreal neovascularization areas were determined using ImageJ software (NIH, Bethesda, MD). Data are displayed as percentages of the total retinal area: avascular/total retinal area (AVA) and intravitreal neovascular/total retinal area (IVNV). Because the AVA and the IVNV were not different in the light-treated eyes compared to the untreated eyes, the flat mounts for both conditions were combined into one group for statistical analyses.
For IHC, eyes were fixed for 1 h in 4% PFA in PBS, cryoprotected in 10% sucrose for 1 h followed by 30% sucrose overnight, and embedded in optimal cutting temperature compound (Tissue-Tek, Sakura, FineTek, Torrance, CA). From the tissue blocks, 12 μm cryosections were cut. The slides were washed with PBS, permeabilized with 10% normal donkey serum and 0.1% Triton-X 100 in PBS for 45 min, and stained with rabbit anti-opsin antibody (1:100 dilution, catalogue # AB5405, Millipore, Billerica, MA) at 4 °C overnight. Alexa Fluor 488 goat anti-rabbit immunoglobulin G (IgG; Invitrogen) and TO-PRO-3 (1 μM, Invitrogen) were incubated for 60 min at room temperature, and then the slides were mounted with Fluoromount-G mounting media. Images were taken at 20X magnification on an Olympus IX81 confocal microscope. The thicknesses of the photoreceptor outer segments and the outer nuclear layer, the outer plexiform and inner nuclear layers, and the inner plexiform and ganglion cell layers were determined in three different locations of each image using ImageJ and displayed as a percentage of the total retinal thickness to normalize for differences in retinal thickness between the central and peripheral retina.
Electroretinogram
For the scotopic ERGs, the rat pups were dark adapted overnight and handled under red light illumination throughout the procedure. The animals were anesthetized using 100 mg/kg ketamine and 10 mg/kg xylazine. The pupils were dilated with tropicamide eye drops, and the corneas were lubricated with 0.3% hypromellose gel. The animals were placed on a heated pad to maintain body temperature, the subdermal ground electrode was inserted at the base of the tail, and the subdermal reference electrode on the forehead midway between the eyes.
The Ganzfeld ERG was recorded in each eye using the UTAS Visual Diagnostic System with BigShot Ganzfeld (LKC, Gaithersburg, MD). As recordings were made unilaterally, each eye was recorded on separate days, either on P31 or P32 to allow complete dark adaptation in the fellow eye. A contact lens electrode was positioned on the cornea, and waveforms were recorded using white light flashes (5 ms duration, luminances ranging from −5.1 to 2.20 cd s m−2, with 30 sweeps and 2 s intervals for −5.1 to −3.6, three sweeps and 10 s intervals for −2.4, three sweeps and 20 s intervals for −2.0, three sweeps and 30 s intervals for −1.6, three sweeps and 40 s intervals for −1.2, three sweeps and 60 s intervals for −0.2, and two sweeps and 120 s intervals for 1.2 to 2.2 cd s m−2).
Because corneal and lens opacification occurred during the time needed for anesthesia to record eyes on the same day, the focal ERG (fERG, image-guided focal ERG, Phoenix Laboratories) was recorded on P28 or P29 to permit clear media to evaluate the retinal function in each eye. The lens electrode was carefully advanced near the cornea, and the recording area in the central retina (spot size A 0.50 mm, approximately one diameter away from the optic nerve head) was chosen under red light illumination. White light flashes (5 ms duration, luminances ranging from −0.4 to 3.2 cd s m−2, with 20 sweeps and 10 s intervals for −0.4 to 1.4, ten sweeps and 20 s intervals for 2.0, three sweeps and 60 s intervals for 2.6, and two sweeps and 2 s intervals for 3.2 cd s m−2) were used to record the fERG. Scattered light was confirmed not to contribute to the fERG response by aiming the highest intensity light stimulus at the optic nerve head (data not shown).
Raw data were stored on a personal computer for off-line analysis. The a- and b-wave amplitudes and latencies were determined (Figure 1B) and are displayed as means ± standard error of the mean (SEM). Note that a- amplitude is usually negative but is recorded as a positive absolute value for ease in comparison.
Statistical analysis
Previous studies observed the AVA mean ± standard deviation (SD) of 47.62±10.12 and 32.36±11.43 in two conditions analogous to the present study [1,13]. Assuming a similar effect size for the AVA, we required nine eyes in each condition to achieve 80% power using a two-sided alpha 0.05 comparison. The same studies observed an IVNV mean ± SD of 3.62±1.71 and 0.72±1.56. Assuming a similar effect size, we required seven eyes in each condition to achieve 80% power using a two-sided alpha 0.05 comparison. With clustering, if the study outcome in the unit of analysis (eyes) within a cluster (rat) is correlated, measured by the intraclass correlation coefficient (ICC), the sample size must be increased by the design effect, which includes the ICC in its calculation. If the ICC is 0, where the eyes are independent, adjustment of the design effect is not necessary. We assumed the ICC would be 0, or at least negligible, as the intervention was specific to a response in the eye itself, rather than systemic; therefore, we kept the original calculation of nine eyes per condition. For analysis of the AVA and the IVNV, therefore, nine flat mounted retinas were used per condition. The thickness of the retinal layers was measured in four untreated, seven pilot-treated, and five sPBS-treated retinas with OCT and in three locations in each of three images recorded in two sections from each of two animals per condition measured with IHC. Ganzfeld ERGs were recorded in nine eyes from five untreated animals, ten eyes from seven pilot-treated animals, ten eyes from eight sPBS-treated animals, and six eyes from three light-treated animals. fERG data were collected in nine eyes from five untreated animals, ten eyes from eight pilot-treated animals, eight eyes from eight sPBS-treated animals, and six eyes from three light-treated animals.
Some data clustering existed in the data set. Pups from the same litter were randomized to different conditions, or study groups, to avoid clustering by litter within any condition. In this way, the groups were balanced on any possible litter effect. For IHC, within an eye, the three locations in each of the three images from two sections were averaged to obtain a single data point, or summary measure, per eye so clustering was avoided. Clustering remained for Ganzfeld and focal ERGs when both eyes were used in some pups. To account for this clustering of eyes within the same pup, all statistical comparisons between conditions were performed using a mixed-effects linear regression, with the eyes nested within the pup. For graphing, SEMs were obtained using post-test marginal estimation from the mixed-effects models, so that the SEMs correctly accounted for the data clustering. This statistical modeling was done using Stata-14 statistical software (StataCorp, College Station, TX).
Given that the Ganzfeld ERG and fERG were measured at several light intensities, we used the primary-secondary approach to address multiple comparisons [14-16]. We selected the highest light intensity as the primary outcome and then tested our research hypothesis at just this highest intensity. In this way, there was only one comparison; thus, there was no need for a multiple comparison adjustment. The lower light intensities were considered secondary comparisons, which are merely descriptive, and nonconfirmatory. As no hypothesis was tested with them, there was no need for multiple comparison adjustment for them. The primary-secondary approach to multiple comparisons is a commonly used approach in randomized controlled trials reported in The New England Journal of Medicine (e.g, [17]).
Results
Delivery of subretinal injections and fundus images
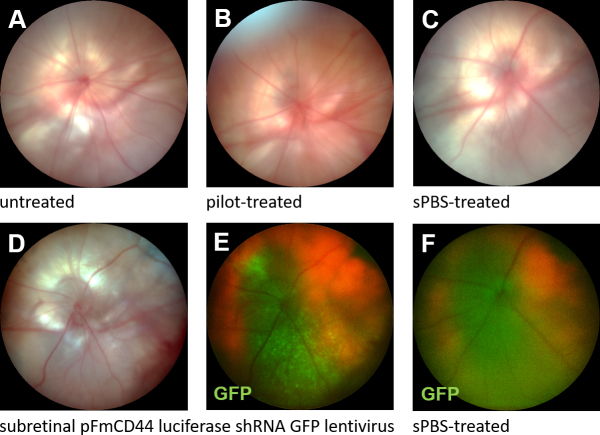
The fundus images of untreated, pilot-treated, or sPBS-treated eyes in P26 animals had similar appearances (Figure 2A–C). The estimated extent and location of retinal involvement from the subretinal injections were determined in eyes from pups that were euthanized after injection and examined for the extent of retinal detachment or that had received subretinal injections of a pFmCD44 lentivirus tagged with GFP that transduces Müller cells at P8 and imaged at P26 to assess the location of transduction with the fluorescence of the Müller cell endfeet visualized with the Micron IV camera. From these experiments, green fluorescence was determined in about one third of the posterior retina in approximately 80% of the injected eyes (Figure 2D–F).
Figure 2.
Fundus images and localization of subretinal injections. A–C: The fundus images of the untreated and pilot- and subretinal PBS injection (sPBS)-treated eyes were normal. D–E: After subretinal injection of pFmCD44 green fluorescent protein (GFP) lentivirus, the fundus image was normal (D), and GFP expression was localized in the central retina (E). F: No green fluorescence was detected in the sPBS-treated eyes.
Retinal vascularization and structure
Compared to the untreated eyes, the AVA was increased in the pilot-treated eyes and more so in the sPBS-injected eyes at p32 (Figure 3A,B). The IVNV was increased in the sPBS-treated eyes, but not in the pilot-treated eyes, compared to the untreated controls (Figure 3A,C). No statistically significant difference in the IVNV was found between any of the remaining groups (Figure 3).
Figure 3.
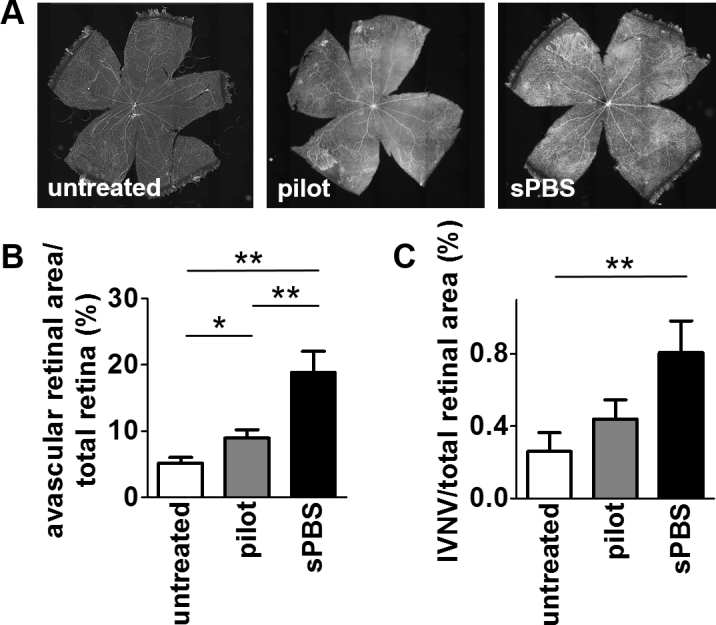
Increased areas of avascular retina and intravitreal neovascularization in pilot- and sPBS-treated compared to untreated eyes. A: Representative images of retinal flat mounts at P32 from the untreated and pilot- and subretinal PBS injection (sPBS)-treated eyes. B: Quantification of the avascular area (AVA) and C: the intravitreal neovascular/total retinal area (IVNV) in each group. The AVA was statistically significantly increased in the pilot- (*p<0.05, n=9) and sPBS-treated (sPBS, **p<0.01, n=9) eyes compared to the untreated eyes (n=9) and in the sPBS-treated eyes compared to the pilot-treated eyes (**p<0.01). The IVNV was increased in the sPBS-treated eyes compared to the untreated eyes (**p<0.01).
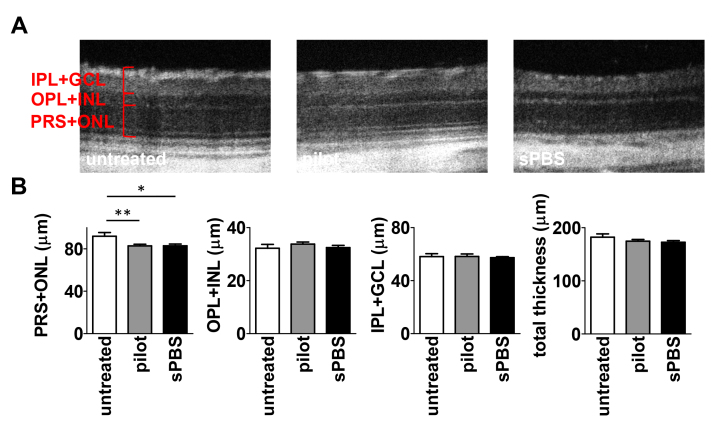
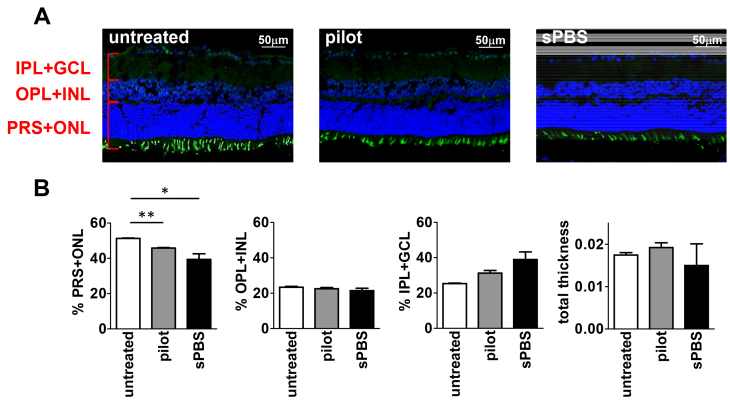
The OCT on P30 and immunohistochemically labeled cryosections on P32 showed reductions in the thickness of the PRS + ONL in the pilot- and sPBS-treated eyes compared to the untreated eyes. No statistically significant differences were detected in the OPL + INL, IPL + GCL, or total retinal thickness between any of the treatment groups (Figure 4 and Figure 5).
Figure 4.
OCT in untreated eyes, after sham treatment and subretinal PBS injection. A: Representative images of OCT images in untreated eyes and after sham injection and subretinal PBS. B: The thickness of the PRS+ONL was significantly reduced by sham treatment (**p<0.01, n=7) and subretinal PBS injection (*p<0.05, n=5) compared to untreated eyes (n=4). No significant differences were observed between any groups in the OPL+INL, IPL+GCL or total thickness.
Figure 5.
Reduced thickness measured in the pilot- and sPBS-treated eyes compared to untreated eyes. Cryosections were stained for opsin (green) and TO-PRO-3 (blue). The thickness of the photoreceptor outer segments and outer nuclear layer (PRS + ONL) was statistically significantly reduced in the pilot- and subretinal PBS injection (sPBS)-treated eyes compared to the untreated eyes (*p<0.05, **p<0.01, six images in two sections from two eyes per condition). No statistically significant differences were observed between any of the groups in the outer plexiform and inner nuclear layers (OPL + INL), the inner plexiform and ganglion cell layers (IPL + GCL), or total retinal thickness.
Electroretinography
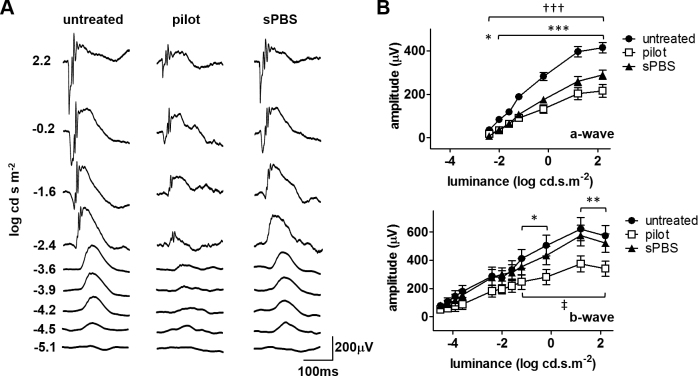
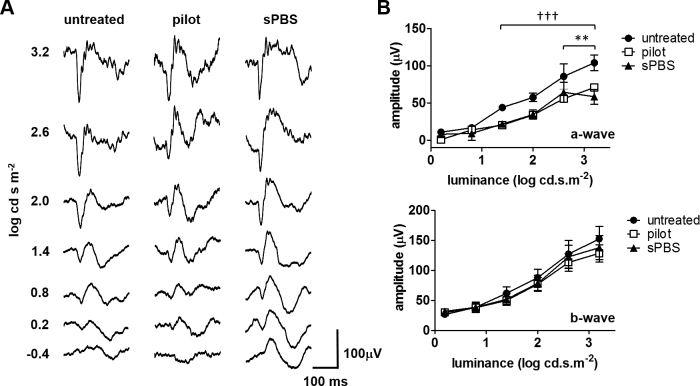
The amplitudes of the a- and b-waves in the scotopic Ganzfeld ERG were statistically significantly reduced in the pilot-treated eyes compared to the untreated eyes. The b-wave amplitude was relatively increased in the sPBS-treated eyes compared to the pilot-treated eyes and was not statistically significantly different from in the untreated eyes. The a-wave amplitude was statistically significantly smaller in the sPBS-treated eyes compared to the untreated eyes, but there was no statistically significant difference compared to the pilot-treated eyes (Figure 6). To determine whether the subretinal PBS injections affected retinal function in the injection region, we recorded focal ERGs in the central retina within an approximate one disc diameter of the optic nerve head. The amplitudes of the a-wave of the focal ERG were reduced in the pilot- and sPBS-treated eyes compared to the untreated eyes, but the amplitudes of the b-wave in the focal ERG were similar in all groups (Figure 7).
Figure 6.
Reduced amplitude of the Ganzfeld ERG in pilot-treated eyes is reversed in sPBS-treated eyes. A: Representative recordings of scotopic Ganzfeld electroretinograms (ERGs) in the untreated and pilot- and subretinal PBS injection (sPBS)-treated eyes. B: The amplitudes of the scotopic a- and b-waves were statistically significantly reduced in the pilot-treated eyes (*p<0.05, **p<0.01, ***p<0.001, n=10) compared to the untreated eyes (n=9). The amplitude of the a-wave, but not the b-wave, was statistically significantly smaller in the sPBS-treated eyes compared to the untreated eyes (†††p<0.001, n=10). The b-wave was increased in the sPBS-treated eyes compared to the pilot-treated eyes (‡p<0.05). Note that a- amplitude is usually negative but is recorded as a positive absolute value for ease in comparison.
Figure 7.
Reduced a-wave in focal ERGs in the central retina of pilot- and sPBS-treated eyes compared to untreated eyes. A: Representative recordings of scotopic focal electroretinograms (ERGs) in the untreated and pilot- and subretinal PBS injection (sPBS)-treated eyes. B: The amplitudes of the scotopic a- and b-waves in the pilot- (**p<0.01, n=10) and sPBS-treated eyes (†††p<0.001, n=8) were statistically significantly reduced compared to those in the untreated eyes (n=9). Note that a- amplitude is usually negative but is recorded as a positive absolute value for ease in comparison.
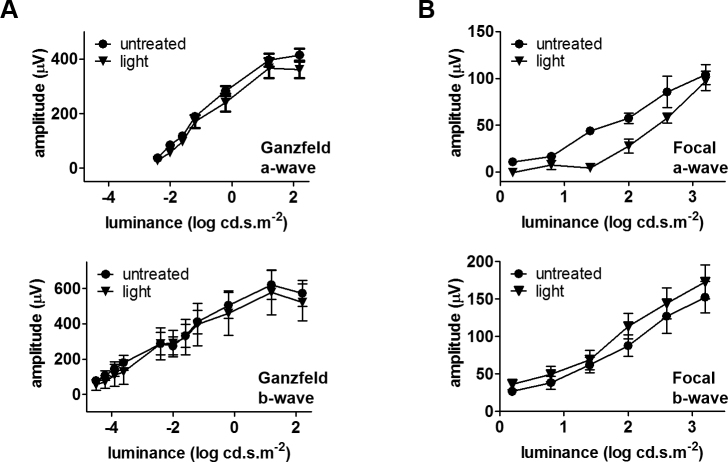
The eyelids must be opened in P8 rats from the OIR model to perform injections. To determine whether suppression of the a- and b-wave amplitudes in the scotopic ERGs of the pilot-treated eyes was due to light exposure, some eyes had eyelid opening followed by 30 s exposure to the microscope light only. The light-treated eyes had similar amplitudes of a- and b-waves on the focal and Ganzfeld ERGs compared to the untreated eyes, showing that this time duration of light exposure did not affect retinal function (Figure 8).
Figure 8.
Ganzfeld and focal ERGs in untreated and light-treated eyes. A: The a- and b-wave amplitudes of the scotopic Ganzfeld electroretinogram (ERG) and B: the focal ERG were not statistically significantly different between the untreated (n=9) and light-treated (n=6) eyes, Note that a- amplitude is usually negative but is recorded as a positive absolute value for ease in comparison.
Discussion
Subretinal injections are used in experimental studies, but the effects on the retinal structure and function have not been fully investigated. In the healthy adult rat eye, subretinal injection of a PBS-fluorescein mixture had no detrimental effect on the scotopic Ganzfeld ERG up to 5 weeks after injection [4]. In the mouse, subretinal injection of saline with fluorescein was shown to reduce the amplitude of a mixed rod and cone ERG and resulted in abnormal photoreceptor morphology in the injection area 5 weeks after injection [18]. Following the subretinal injection of the balanced salt solution, retinal function measured with a multifocal ERG was transiently reduced in the cynomolgus macaques and recovered almost fully after 9 days despite changes in the rod and cone photoreceptor morphology that persisted for at least 3 months [5]. In the rabbit, subretinal injection of PBS or balanced salt solution resulted in changes in the RPE and marked reduction of the total retinal thickness, particularly of the photoreceptor layers [6]. Some of the reported differences may be due to differences between species, methodologies, and outcome measures.
In animal models of photoreceptor degeneration, some reports suggest subretinal injections are protective. In the Royal College of Surgeons rat, which has a mutation in the Mertk gene and deficiency in phagocytosing photoreceptor outer segments by the RPE [19], and in F344 rats exposed to light-induced damage, the PBS injection into the subretinal space was associated with an increased number of surviving photoreceptors [7-9,11]. Similarly, photoreceptor death was reduced after subretinal injections of PBS in rds mice, which have a mutation in the photoreceptor protein peripherin 2 [10]. Sauvé et al. reported a non-significant trend toward an increased b-wave amplitude after subretinal injection of Ham’s F10 medium compared to the untreated controls in Royal College of Surgeons rats [20].
Minimal information is currently available on the effects of the subretinal injection procedure in rodent OIR models. At P18, the rat OIR model has moderate thinning of the retinal layers compared to pups raised in room air [21] and reduced retinal function recorded between P29 and P35 that persists after normal-appearing vasculature is restored [22]. We predicted that untreated and pilot- and light-treated eyes would not differ in the vascular features of OIR or the retinal structure or function of the entire retina measured with Ganzfeld ERG and IHC, and that in the region of the injection, the sPBS-treated eyes would have reduced retinal function measured with focal ERG and structural deficits with OCT. However, we observed differences in the vascular features of OIR and the structure and function of the entire retina in the pilot- and sPBS-treated eyes compared to the control untreated eyes.
We found that the vascular features of OIR were more severe in the sPBS- and pilot-treated eyes than in the untreated eyes. The sPBS-treated eyes had the largest AVA of any group at P32. A similar pattern was noted for the IVNV, but it was low in all groups as expected because the OIR model regresses naturally over time. Penn et al. demonstrated decreased IVNV on P20 in OIR rat pups that had received scleral punctures on P14, which was associated with increased production of antiangiogenic factors, including endostatin and pigment epithelium derived factor (PEDF) [23]. It is conceivable that a similar shift in the release of antiangiogenic factors may contribute to the increased AVA we observed in the pilot-treated OIR pups on P32. A previous communication by Holmes et al. reported an increased IVNV at P13 in a different rat OIR model following subretinal injection of PBS [24]. The underlying mechanisms are unknown, but it is possible that a subretinal injection may stimulate RPE or other cells to release inflammatory and other factors that modulate retinal neovascularization [25,26]. Upregulation of angiogenic factors may occur from the hypoxic retina that is detached from the underlying choroidal circulation and thus, stimulate the production of the IVNV [27-29].
The findings of photoreceptor layer thinning in the pilot- and sPBS-treated eyes in the OIR model are supported by previous observations that incisional damage through the layer of the eye into the retina in healthy rat eyes resulted in retinal thinning up to 500 μm from the lesion site [30]. However, advancement of an injection needle into the subretinal space in the Royal College of Surgeons rat and in a rat model of light-induced damage resulted in increased outer nuclear layer thickness [7,8]. This result suggests that the retina in the rat OIR model may resemble the healthy retina with less susceptibility to potential protective factors or greater susceptibility to damaging factors related to needle injury to the sclera [31,32].
The needle injury in the pilot-treated eyes was sufficient to reduce the a- and b-wave amplitudes of the Ganzfeld ERG. In the sPBS-treated eyes, only the a-wave amplitude was reduced compared to the untreated eyes. No difference in the b-wave amplitude was observed between the sPBS- and untreated eyes. Similar observations of greater b- but not a-wave amplitudes were made after the application of brain-derived neurotrophic factor (BDNF) in a rat model of light damage [33]. The RPE, which is disturbed by the subretinal injection procedure [6], is a source of factors, including PEDF, BDNF, and glial cell line derived neurotrophic factor (GDNF) [34]. It is conceivable that the release of factors by the subretinal injection may have improved the inner retinal function of the uninjected retina, evidenced by the greater b-wave amplitude in the Ganzfeld ERG.
Reduction of the a-wave amplitude in the central retina measured with focal ERG supports the reduced function and retinal thinning of the photoreceptor layer in the pilot- and PBS-treated eyes. There were no differences in the b-wave in the untreated, sPBS-treated, or pilot-treated eyes. This varied from what was found in the Ganzfeld ERG measurements in which the pilot-treated but not the sPBS-treated eyes had reduced b-wave amplitudes. The majority of eyes had focal and Ganzfeld ERGs, and the reasons for the different relative effects between the pilot- and sPBS-treated eyes on the b-wave measured with the Ganzfeld and focal ERGs remain unknown but may be related to the relatively lower signal obtained in the focal ERG measurements.
Although this study focused on effects in animal models and the need for appropriate comparison groups and controls, the results translate to humans in the following ways. A retinal detachment associated with a torn retina will reduce the ERG, and the amplitudes of the ERG are lower with a highly elevated retina and are less affected when the retina is shallowly detached. A recent study showed that retinal function partially recovered by 6 months after retinal reattachment surgery [35]. Patients with tractional retinal detachments from diabetic retinopathy also have reduced retinal function but often have long-standing ischemia, which itself reduces the ERG. Proliferative diabetic retinopathy and retinopathy of prematurity are closest to OIR models, and both conditions reduce ERGs. However, premature infants can have reduced ERGs even without ever having retinopathy of prematurity [36]. However, direct relevance to gene therapy trials is difficult, because gene therapy trials enroll participants who already have reduced ERGs from their diseases; therefore, it is difficult to determine whether the subretinal injections affect ERGs.
In summary, the present study showed that pilot treatment or subretinal injection on P8 is associated with slowed physiologic vascularization of the retina and the increased AVA and IVNV at P32 in the rat OIR model. The loss of photoreceptors and changes in retinal function following the pilot treatment and the subretinal PBS injection make it necessary that studies using these techniques include appropriate controls. The mechanisms underlying the observed changes in retinal vascularization, structure, and function remain to be elucidated.
Acknowledgments
This work was supported by grants from the NIH R01EY015130 and R01EY017011 to M.E.H.; University of Utah Core Vision Research Grant P30EY014800; an Unrestricted Grant from Research to Prevent Blindness, Inc., New York, NY, to the Department of Ophthalmology & Visual Sciences, University of Utah and funding from the National Center for Research Resources and the National Center for Advancing Translational Sciences, National Institutes of Health, through Grant 5UL1TR001067–02 (formerly 8UL1TR000105 and UL1RR025764) to the University of Utah Study Design and Biostatistics Center.
References
- 1.Jiang Y, Wang H, Culp D, Yang Z, Fotheringham L, Flannery J, Hammond S, Kafri T, Hartnett ME. Targeting Muller cell-derived VEGF164 to reduce intravitreal neovascularization in the rat model of retinopathy of prematurity. Invest Ophthalmol Vis Sci. 2014;55:824–31. doi: 10.1167/iovs.13-13755. [DOI] [PMC free article] [PubMed] [Google Scholar]
- 2.Wang H, Smith GW, Yang Z, Jiang Y, McCloskey M, Greenberg K, Geisen P, Culp WD, Flannery J, Kafri T, Hammond S, Hartnett ME. Short hairpin RNA-mediated knockdown of VEGFA in Muller cells reduces intravitreal neovascularization in a rat model of retinopathy of prematurity. Am J Pathol. 2013;183:964–74. doi: 10.1016/j.ajpath.2013.05.011. [DOI] [PMC free article] [PubMed] [Google Scholar]
- 3.Greenberg KP, Geller SF, Schaffer DV, Flannery JG. Targeted transgene expression in muller glia of normal and diseased retinas using lentiviral vectors. Invest Ophthalmol Vis Sci. 2007;48:1844–52. doi: 10.1167/iovs.05-1570. [DOI] [PMC free article] [PubMed] [Google Scholar]
- 4.Timmers AM, Zhang H, Squitieri A, Gonzalez-Pola C. Subretinal injections in rodent eyes: effects on electrophysiology and histology of rat retina. Mol Vis. 2001;7:131–7. [PubMed] [Google Scholar]
- 5.Nork TM, Murphy CJ, Kim CB, Ver Hoeve JN, Rasmussen CA, Miller PE, Wabers HD, Neider MW, Dubielzig RR, McCulloh RJ, Christian BJ. Functional and anatomic consequences of subretinal dosing in the cynomolgus macaque. Arch Ophthalmol. 2012;130:65–75. doi: 10.1001/archophthalmol.2011.295. [DOI] [PMC free article] [PubMed] [Google Scholar]
- 6.Bartuma H, Petrus-Reurer S, Aronsson M, Westman S, Andre H, Kvanta A. In Vivo Imaging of Subretinal Bleb-Induced Outer Retinal Degeneration in the Rabbit. Invest Ophthalmol Vis Sci. 2015;56:2423–30. doi: 10.1167/iovs.14-16208. [DOI] [PubMed] [Google Scholar]
- 7.Faktorovich EG, Steinberg RH, Yasumura D, Matthes MT, LaVail MM. Photoreceptor degeneration in inherited retinal dystrophy delayed by basic fibroblast growth factor. Nature. 1990;347:83–6. doi: 10.1038/347083a0. [DOI] [PubMed] [Google Scholar]
- 8.Faktorovich EG, Steinberg RH, Yasumura D, Matthes MT, LaVail MM. Basic fibroblast growth factor and local injury protect photoreceptors from light damage in the rat. J Neurosci. 1992;12:3554–67. doi: 10.1523/JNEUROSCI.12-09-03554.1992. [DOI] [PMC free article] [PubMed] [Google Scholar]
- 9.Silverman MS, Hughes SE. Photoreceptor rescue in the RCS rat without pigment epithelium transplantation. Curr Eye Res. 1990;9:183–91. doi: 10.3109/02713689008995205. [DOI] [PubMed] [Google Scholar]
- 10.Rex TS, Wong Y, Kodali K, Merry S. Neuroprotection of photoreceptors by direct delivery of erythropoietin to the retina of the retinal degeneration slow mouse. Exp Eye Res. 2009;89:735–40. doi: 10.1016/j.exer.2009.06.017. [DOI] [PMC free article] [PubMed] [Google Scholar]
- 11.Li LX, Sheedlo HJ, Gaur V, Turner JE. Effects of macrophage and retinal pigment epithelial cell transplants on photoreceptor cell rescue in RCS rats. Curr Eye Res. 1991;10:947–58. doi: 10.3109/02713689109020331. [DOI] [PubMed] [Google Scholar]
- 12.Hombrebueno JR, Luo C, Guo L, Chen M, Xu H. Intravitreal Injection of Normal Saline Induces Retinal Degeneration in the C57BL/6J Mouse. Transl Vis Sci Technol. 2014;3:3. doi: 10.1167/tvst.3.2.3. [DOI] [PMC free article] [PubMed] [Google Scholar]
- 13.Becker S, Wang H, Yu B, Brown R, Han X, Lane RH, Hartnett ME. Protective effect of maternal uteroplacental insufficiency on oxygen-induced retinopathy in offspring: removing bias of premature birth. Sci Rep. 2017;7:42301. doi: 10.1038/srep42301. [DOI] [PMC free article] [PubMed] [Google Scholar]
- 14.Browner W, Newman T, Cummings S, Hulley S. Getting ready to estimate sample size: hypothses and Underlying principles. In: Hulley SB CS, editor. Designing Clinical Research: An Epidemiologic Approach. Baltimore: Williams & Wilkins; 1988. [Google Scholar]
- 15.Harmonised Tripartite Guideline ICH. Statistical principles for clinical trials. International Conference on Harmonisation E9 Expert Working Group. Stat Med. 1999;18:1905–42. [PubMed] [Google Scholar]
- 16.Freemantle N. Interpreting the results of secondary end points and subgroup analyses in clinical trials: should we lock the crazy aunt in the attic? BMJ. 2001;322:989–91. doi: 10.1136/bmj.322.7292.989. [DOI] [PMC free article] [PubMed] [Google Scholar]
- 17.Van Cutsem E, Kohne CH, Hitre E, Zaluski J, Chang Chien CR, Makhson A, D’Haens G, Pinter T, Lim R, Bodoky G, Roh JK, Folprecht G, Ruff P, Stroh C, Tejpar S, Schlichting M, Nippgen J, Rougier P. Cetuximab and chemotherapy as initial treatment for metastatic colorectal cancer. N Engl J Med. 2009;360:1408–17. doi: 10.1056/NEJMoa0805019. [DOI] [PubMed] [Google Scholar]
- 18.Qi Y, Dai X, Zhang H, He Y, Zhang Y, Han J, Zhu P, Zhang Y, Zheng Q, Li X, Zhao C, Pang J. Trans-Corneal Subretinal Injection in Mice and Its Effect on the Function and Morphology of the Retina. PLoS One. 2015;10:e0136523. doi: 10.1371/journal.pone.0136523. [DOI] [PMC free article] [PubMed] [Google Scholar]
- 19.Vollrath D, Feng W, Duncan JL, Yasumura D, D’Cruz PM, Chappelow A, Matthes MT, Kay MA, LaVail MM. Correction of the retinal dystrophy phenotype of the RCS rat by viral gene transfer of Mertk. Proc Natl Acad Sci USA. 2001;98:12584–9. doi: 10.1073/pnas.221364198. [DOI] [PMC free article] [PubMed] [Google Scholar]
- 20.Sauve Y, Lu B, Lund RD. The relationship between full field electroretinogram and perimetry-like visual thresholds in RCS rats during photoreceptor degeneration and rescue by cell transplants. Vision Res. 2004;44:9–18. doi: 10.1016/j.visres.2003.08.015. [DOI] [PubMed] [Google Scholar]
- 21.Soetikno BT, Yi J, Shah R, Liu W, Purta P, Zhang HF, Fawzi AA. Inner retinal oxygen metabolism in the 50/10 oxygen-induced retinopathy model. Sci Rep. 2015;5:16752. doi: 10.1038/srep16752. [DOI] [PMC free article] [PubMed] [Google Scholar]
- 22.Liu K, Akula JD, Falk C, Hansen RM, Fulton AB. The retinal vasculature and function of the neural retina in a rat model of retinopathy of prematurity. Invest Ophthalmol Vis Sci. 2006;47:2639–47. doi: 10.1167/iovs.06-0016. [DOI] [PubMed] [Google Scholar]
- 23.Penn JS, McCollum GW, Barnett JM, Werdich XQ, Koepke KA, Rajaratnam VS. Angiostatic effect of penetrating ocular injury: role of pigment epithelium-derived factor. Invest Ophthalmol Vis Sci. 2006;47:405–14. doi: 10.1167/iovs.05-0673. [DOI] [PubMed] [Google Scholar]
- 24.Holmes JM, Chen Y, Loewen N, Leske DA, Poeschla EM. Subretinal Injection Increases Neovascularization in Oxygen-Induced Retinopathy in the Neonatal Rat. ARVO Annual Meeting; 2002 May 5–10; Ft. Lauderdale, Florida. [Google Scholar]
- 25.Gardiner TA, Gibson DS, de Gooyer TE, de la Cruz VF, McDonald DM, Stitt AW. Inhibition of tumor necrosis factor-alpha improves physiological angiogenesis and reduces pathological neovascularization in ischemic retinopathy. Am J Pathol. 2005;166:637–44. doi: 10.1016/s0002-9440(10)62284-5. [DOI] [PMC free article] [PubMed] [Google Scholar]
- 26.Nakazawa T, Matsubara A, Noda K, Hisatomi T, She H, Skondra D, Miyahara S, Sobrin L, Thomas KL, Chen DF, Grosskreutz CL, Hafezi-Moghadam A, Miller JW. Characterization of cytokine responses to retinal detachment in rats. Mol Vis. 2006;12:867–78. [PubMed] [Google Scholar]
- 27.Linsenmeier RA. Electrophysiological consequences of retinal hypoxia. Graefe’s archive for clinical and experimental ophthalmology = Albrecht Von Graefes Arch Klin Exp Ophthalmol. 1990;228:143–50. doi: 10.1007/BF00935724. [DOI] [PubMed] [Google Scholar]
- 28.Mervin K, Valter K, Maslim J, Lewis G, Fisher S, Stone J. Limiting photoreceptor death and deconstruction during experimental retinal detachment: the value of oxygen supplementation. Am J Ophthalmol. 1999;128:155–64. doi: 10.1016/s0002-9394(99)00104-x. [DOI] [PubMed] [Google Scholar]
- 29.Shelby SJ, Angadi PS, Zheng QD, Yao J, Jia L, Zacks DN. Hypoxia inducible factor 1alpha contributes to regulation of autophagy in retinal detachment. Exp Eye Res. 2015;137:84–93. doi: 10.1016/j.exer.2015.06.016. [DOI] [PMC free article] [PubMed] [Google Scholar]
- 30.Turner JE, Blair JR, Chappell ET. Peripheral nerve implantation into a penetrating lesion of the eye: stimulation of the damaged retina. Brain Res. 1986;376:246–54. doi: 10.1016/0006-8993(86)90186-1. [DOI] [PubMed] [Google Scholar]
- 31.Wen R, Song Y, Cheng T, Matthes MT, Yasumura D, LaVail MM, Steinberg RH. Injury-induced upregulation of bFGF and CNTF mRNAS in the rat retina. J Neurosci. 1995;15:7377–85. doi: 10.1523/JNEUROSCI.15-11-07377.1995. [DOI] [PMC free article] [PubMed] [Google Scholar]
- 32.Cao W, Li F, Steinberg RH, Lavail MM. Development of normal and injury-induced gene expression of aFGF, bFGF, CNTF, BDNF, GFAP and IGF-I in the rat retina. Exp Eye Res. 2001;72:591–604. doi: 10.1006/exer.2001.0990. [DOI] [PubMed] [Google Scholar]
- 33.Ikeda K, Tanihara H, Tatsuno T, Noguchi H, Nakayama C. Brain-derived neurotrophic factor shows a protective effect and improves recovery of the ERG b-wave response in light-damage. J Neurochem. 2003;87:290–6. doi: 10.1046/j.1471-4159.2003.01994.x. [DOI] [PubMed] [Google Scholar]
- 34.Ming M, Li X, Fan X, Yang D, Li L, Chen S, Gu Q, Le W. Retinal pigment epithelial cells secrete neurotrophic factors and synthesize dopamine: possible contribution to therapeutic effects of RPE cell transplantation in Parkinson’s disease. J Transl Med. 2009;7:53. doi: 10.1186/1479-5876-7-53. [DOI] [PMC free article] [PubMed] [Google Scholar]
- 35.Schatz P, Andreasson S. Recovery of retinal function after recent-onset rhegmatogenous retinal detachment in relation to type of surgery. Retina. 2010;30:152–9. doi: 10.1097/IAE.0b013e3181b32ed4. [DOI] [PubMed] [Google Scholar]
- 36.Molnar AEC, Andreasson SO, Larsson EKB, Akerblom HM, Holmstrom GE. Reduction of Rod and Cone Function in 6.5-Year-Old Children Born Extremely Preterm. JAMA Ophthalmol. 2017;135:854–61. doi: 10.1001/jamaophthalmol.2017.2069. [DOI] [PMC free article] [PubMed] [Google Scholar]


