Hyperpolarized (HP) 13Cmagnetic resonance spectroscopic imaging (MRSI) is a novel imaging technique that allows rapid and noninvasive monitoring of dynamic pathway-specific metabolic and physiologic processes [1] with unprecedented gain in sensitivity (10 000–200 000 fold increase) for imaging of 13C-labeled biomolecules that are endogenous, nontoxic, and nonradioactive [2,3]. We previously reported the first-in-human phase 1 clinical study of HP [13C]-pyruvate MRSI in patients with prostate cancer on active surveillance, and confirmed the feasibility of capturing regions of accelerated HP pyruvate-to-lactate flux in high-grade versus low-grade cancer versus benign tissue [4].
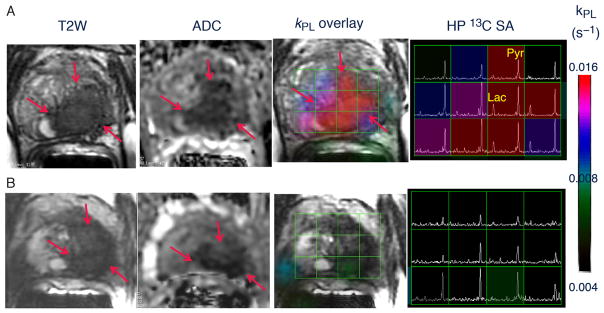
Here we describe the first results demonstrating the metabolic response to androgen deprivation therapy (ADT) using HP [13C]-pyruvate MRSI. The patient presented with serum prostate-specific antigen (PSA) of 25.2 ng/ml and Gleason 4 + 5 prostate adenocarcinoma on biopsy. Cross-sectional imaging demonstrated metastases within the pelvic nodes and osseous structures. Baseline multi-parametric (mp) 1H MRI of the prostate (anatomic imaging, diffusion-weighted imaging [DWI], dynamic contrast-enhanced [DCE] imaging, and 3D 1H MRSI) with HP [13C]-pyruvate revealed a bulky tumor involving the left apex, mid gland, and base peripheral and transition zones, and right apex, mid gland, and base peripheral zone, measuring 4.5 ×1.5 × 5.1 cm3. T2-weighted MRI showed a well-defined focus of low signal intensity (T2 score 5/5; Fig. 1A). The lesion also had marked restricted diffusion (DWI score 5/5; apparent diffusion coefficient [ADC] 930) and was DCE-positive, with increased uptake and washout of contrast agent, and MRSI-positive, with elevated choline and reduced citrate on 1H MRSI. The overall Prostate Imaging-Reporting and Data System v.2 score was 5.
Fig. 1.
Representative axial T2-weighted (T2W) anatomic image and corresponding water apparent diffusion coefficient (ADC) image and T2W image with an overlaid pyruvate-to-lactate metabolic flux (kPL) image and corresponding hyperpolarized (HP) 13C spectral array (SA) for a 52-yr-old prostate cancer patient with extensive high-grade prostate cancer (A) before therapy and (B) 6 wk after initiation of androgen ablation and chemotherapy. Before treatment, the region of prostate cancer can be clearly seen (red arrows) as a reduction in signal on the T2W and ADC images, and increased HP lactate and associated kPL flux on HP 13C MRI. After initiation of androgen deprivation therapy there was a significant reduction in reduction in HP lactate and kPL to normal levels, with only a modest treatment effect on prostate volume and ADC.
Figure 1A shows the HP 13C spectral array for the baseline scan, with markedly elevated lactate peaks within tumor-containing voxels. A color scale map of dynamic pyruvate-to-lactate metabolic flux (kPL) values likewise shows markedly elevated flux levels in the tumor compared to adjacent normal tissue in the baseline HP [13C]-pyruvate MRI.
At 6 wk after initiation of ADT, repeat imaging demonstrated nearly complete abrogation of elevated HP lactate peaks on HP 13C MRI (Fig. 1B) and associated near complete diminution of intratumoral kPL values on dynamic imaging (kPL max 0.025 s−1 at baseline and 0.007 s−1 on follow-up). Notably, there was negligible change in size of tumor on T2-weighted MRI and only a modest change on ADC imaging, supporting the ability of HP 13C MRI to detect early metabolic responses before such a response can be ascertained using standard radiographic criteria. Concordant with these findings, the patient subsequently achieved a marked clinical response, with an undetectable serum PSA nadir at 6 mo after ADT initiation.
This first patient example illustrates the potential of HP [13C]-pyruvate imaging as a metabolic biomarker of response. Further clinical studies investigating the association between metabolic changes on HP 13C MRI and response and resistance to treatment are ongoing.
Acknowledgments
This work was supported by NIH grants R01EB017449, P41EB013598, and R01CA166655. We would like to acknowledge the following for their contribution: Robert A. Bok, Peder E. Z. Larson, Jeremy W. Gordon, Hsin-Yu Chen, Marcus Ferrone, James B. Slater, Mark van Criekinge, Lucas Carvajal, Sarah J. Nelson, Eric J. Small, Matt Cooperberg, Pamela N. Munster, and Albert Chang.
Footnotes
Conflicts of interest: The authors have nothing to disclose.
References
- 1.Chen AP, Kurhanewicz J, Bok R, et al. Feasibility of using hyperpolarized [1-13C]lactate as a substrate for in vivo metabolic 13C MRSI studies. Magnetic Resonance Imaging. 2008;26:721–6. doi: 10.1016/j.mri.2008.01.002. [DOI] [PMC free article] [PubMed] [Google Scholar]
- 2.Kurhanewicz J, Vigneron DB, Brindle K, et al. Analysis of cancer metabolism by imaging hyperpolarized nuclei: prospects for translation to clinical research. Neoplasia. 2011;13:81–97. doi: 10.1593/neo.101102. [DOI] [PMC free article] [PubMed] [Google Scholar]
- 3.Ardenkjaer-Larsen JH, Fridlund B, Gram A, et al. Increase in signal-to-noise ratio of 10,000 times in liquid-state NMR. Proc Natl Acad Sci U S A. 2003;100:10158–63. doi: 10.1073/pnas.1733835100. [DOI] [PMC free article] [PubMed] [Google Scholar]
- 4.Nelson SJ, Kurhanewicz J, Vigneron DB, et al. Metabolic imaging of patients with prostate cancer using hyperpolarized [1-13C]pyruvate. Sci Transl Med. 2013;14:198ra108. doi: 10.1126/scitranslmed.3006070. [DOI] [PMC free article] [PubMed] [Google Scholar]


