

Abstract
Maximum muscle stress (MMS) is a critical parameter in musculoskeletal modeling, defining the maximum force that a muscle of given size can produce. However, a wide range of MMS values have been reported in literature, and few studies have estimated MMS in trunk muscles. Due to widespread use of musculoskeletal models in studies of the spine and trunk, there is a need to determine reasonable magnitude and range of trunk MMS. We measured trunk extension strength in 49 participants over 65 years of age, surveyed participants about low back pain, and acquired quantitative computed tomography (QCT) scans of their lumbar spines. Trunk muscle morphology was assessed from QCT scans and used to create a subject-specific musculoskeletal model for each participant. Model-predicted extension strength was computed using a trunk muscle MMS of 100 N/cm2. The MMS of each subject-specific model was then adjusted until the measured strength matched the model-predicted strength (± 20 N). We found that measured trunk extension strength was significantly higher in men. With the initial constant MMS value, the musculoskeletal model generally over-predicted trunk extension strength. By adjusting MMS on a subject-specific basis, we found apparent MMS values ranging from 40–130 N/cm2, with an average of 75.5 N/cm2 for both men and women. Subjects with low back pain had lower apparent MMS than subjects with no back pain. This work incorporates a unique approach to estimate subject-specific trunk MMS values via musculoskeletal modeling and provides a useful insight into MMS variation.
Keywords: maximum muscle stress, thoracolumbar spine model, low back pain, trunk extension strength
INTRODUCTION
Trunk extension strength is an important aspect of health status and overall quality of life in older adults, as mobility and balance in older adults are associated with trunk extension strength.1–3 Furthermore, a longitudinal study reported that postmenopausal women who performed back-strengthening exercises had a reduced incidence of vertebral fractures.4 While aging is associated with declines in both muscular strength and lean mass, the strength declines more rapidly than the concurrent loss of muscle mass.5 This suggests that aging is associated with decreasing muscle strength per unit size as well as declines in muscle mass.
In musculoskeletal models, muscle strength is typically directly proportional to muscle size, and characterized by specifying a value for maximum muscle stress (MMS). MMS, also referred to as specific tension, specific strength or stress ratio, relates the maximum force a muscle can produce to physiological cross-sectional area:
| (1) |
where FMax is the maximum isometric muscle strength, and PCSA is the muscle physiological cross-sectional area. A wide range of MMS values have been reported in literature, from 25 N/cm2 up to 134 N/cm2,6,7 representing measurements in different muscle groups, age groups, and sexes. Indeed, while musculoskeletal models typically use a single constant MMS value, MMS is not necessarily constant between muscle groups, as the MMS of elbow flexors is greater than that of elbow extensors,8 and the MMS of ankle dorsiflexors is more than twice that of ankle plantar flexors.9 Optimal fiber length and pennation angle, if used to calculate PCSA from measured anatomical cross-sectional area, may also affect MMS.10 Several cross-sectional studies have reported that MMS declines with increasing age,11–14 while other studies report no change in MMS with aging.15–17 Similarly, most studies report no difference in MMS with respect to sex,18,19 although some suggest that men tend to have larger MMS than women.15,20 Few studies have examined other factors that may be related to MMS. For example, back pain and muscle attenuation (a measure of density from QCT scans) may influence strength in general or MMS in particular. Low back pain is associated with lower muscle attenuation21 and reduced muscle strength,22–24 with most studies finding no difference in trunk muscle area,21,23 although one study found a reduction in multifidus, but not other trunk muscles.25 Since strength is reduced without a corresponding reduction in trunk muscle area, this suggests that low back pain could be associated with a reduction in MMS. Muscle attenuation is lower in older adults than young adults,26 and muscle attenuation may be associated with physical function and muscle strength.27 These observations indicate that MMS is likely not a singular value as frequently modeled, and as such there is a need for evaluation of MMS variation across different muscle groups and populations.
As musculoskeletal models become more widely used in studies of the trunk and spine in older adults28–32, reasonable estimates of MMS are necessary for models to be functionally realistic. However, measurements of MMS in spinal muscles are limited, as are measurements of MMS in elderly populations. For trunk and spine muscles, the MMS of 46 N/cm2 reported by Bogduk et al.33 has been used in a variety of modeling studies.33–35 Another study used an EMG driven model to predict MMS by basing muscle activation on the EMG signal from the muscle group, but trunk muscle anatomy was still taken from previous studies.36,37 Other spine modeling studies appear to choose an MMS value without direct reference to literature estimates.38,39 Thus, current approaches to specifying spinal muscle MMS are clearly lacking, and an examination of MMS in a sample of older adults would provide a useful insight into MMS magnitude and variation in the spine.
The primary aim of this study was to determine subject-specific apparent trunk muscle MMS in a group of older adults using experimental trunk extension strength, QCT-based muscle morphology, and musculoskeletal modeling. Our second aim was to examine whether subject-specific estimates of MMS vary with age, sex, muscle attenuation and back pain. We hypothesized that MMS would be higher in men than women, lower in individuals with back pain, positively correlated with muscle attenuation and negatively correlated with age.
METHODS
Study Participants
This study was a cross-sectional analysis conducted in a subset of subjects from the Boston Rehabilitative Impairment Study of the Elderly (Boston RISE) at Spaulding Rehabilitation Hospital in Boston, MA. The Boston RISE cohort consists of 430 community dwelling patients aged 65 years or older at risk for decline in mobility.40 A group of 49 participants (mean age = 78, 69% female) from the Boston RISE cohort volunteered for the current study,41 and had a mean age and population similar to that of the entire Boston RISE cohort (mean age = 77 years, 68% female). This study was approved by the Institutional Review Board of Spaulding Rehabilitation Hospital, and all participants provided written informed consent before participation.
Measured Trunk Extension Strength
During a study visit within the 3 months prior to their QCT scan, quasi-static maximum trunk extension strength was measured on a customized trunk extension machine (Keiser Pneumatic Lower Back; Keiser Corporation, Fresno, CA), as previously described.1 Participants were instructed to push back slowly and steadily through a small range of motion (15 degrees total range of motion centered on a neutral spine position), pause at the end of the motion, and release. Each participant practiced repetitions on the machine at low levels of resistance (30 lbs, 133N) before starting their actual strength measurement. Subjects started with a trunk extension resistance of 50 lbs (222 N), and resistance was incrementally increased with each successful repetition until the subject was either unable to perform the task or verbally acknowledged that their maximum was reached. The mean number of repetitions to reach a subject’s trunk extension strength resistance was 6.2 ± 1.8. Within the Boston RISE study, intrarater reliability for trunk extension strength measurements was excellent (r=0.96). The strength outcome variable was reported as the one-repetition maximum trunk extension force that could be resisted (N).
Low Back Pain Survey
During a study visit within the 3 months prior to their QCT scan, participants were asked if they had experienced chronic low back pain over the last 4 weeks and to rate their average low back pain from 1–10, with 10 being the most severe or excruciating pain you could imagine. In the current analysis, a pain score of less than 5 was deemed as ‘low pain,’ while a score of 5 or greater was deemed ‘moderate to severe pain’.
QCT Imaging and Analysis
Participants visited an imaging center to have a lumbar spine QCT scan. A 16-slice multidetector scanner (LightSpeed Pro 16; General Electric, Milwaukee, WI) was used to acquire volumetric QCT scans of the trunk at vertebral levels L3-L5. Scans had a nominal slice thickness of 1.25mm and in-plane pixel size of 0.98 × 0.98 mm.
Muscle cross-sectional area (CSA, cm2), position relative to vertebral body centers (cm) and attenuation (Hounsfield units, HU) were determined in the mid-plane slice of each measured vertebral level. Using previously described methods,42 we measured the following muscles: rectus abdominis, external obliques, internal obliques, latissimus dorsi, psoas major, quadratus lumborum, erector spinae and multifidus. To identify the CSA, the outer boundaries of each muscle were contoured using an imaging processing program (Analyze; Biomedical Imaging Resource, Mayo Clinic, Rochester, MN).43 The position of several major trunk muscle groups at the mid-plane of vertebral bodies L3 to L5 were calculated using the center of the CSA contours. Combined paraspinal muscle attenuation values were adjusted at each vertebral level by the water-equivalent chamber from a five-chamber phantom (Model 3 QCT Calibration Phantom, Mindways Software, Inc., Austin, TX) scanned with each subject. The voxels within muscle contour boundaries were analyzed on each side and averaged to get a muscle group CSA and attenuation. Voxels outside the range of −50 to 150 HU were excluded since this tissue is outside the range of normal muscle. Overall interreader and intrareader intraclass correlation coefficients for muscle CSA and attenuation (more than 70% greater than 0.90) are good with this method.26
Subject-Specific Musculoskeletal Models of the Spine
A subject-specific musculoskeletal model was created for each subject based on our previously developed musculoskeletal model of the thoracolumbar spine42 in OpenSim, an open-source musculoskeletal modeling software.44 Vertebral compressive loading and erector spinae muscle tension predicted by the generic model were previously validated and found to be highly correlated with measured data.42 To create models that are anatomically similar to the Boston RISE participants, we used subject-specific height, weight and QCT-based measurements of trunk muscle CSA and position. In biomechanical modeling, muscle moment arms and CSA have a profound effect on predicted muscle forces.45 A more detailed description of musculoskeletal model scaling can be found in Bruno et al.42 Briefly, the CSA and moment arms of the trunk muscles in the musculoskeletal model were adjusted to match the each individual’s muscle values that were measured from the QCT scans. Pennation angles for the trunk muscle were used as reported in previous model development and anatomy literature34 to derive PCSA from CSA measurements. Trunk muscle MMS in this generic model was 100 N/cm2.42
Simulation of Trunk Extension Strength Testing
Model trunk extension strength was determined by simulating the trunk extension strength tests performed by the subjects. The positioning of the OpenSim model was set to reflect the seated posture during the measurement, with a posterior pelvic tilt of 35° and a flattened lumbar lordosis of 21° (Fig. 1).46
Figure 1.
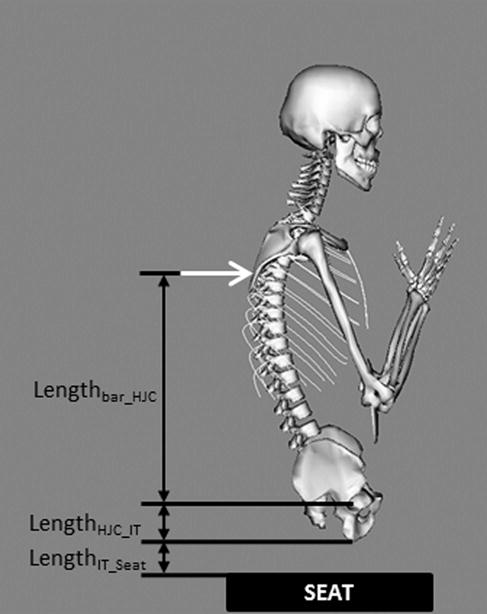
Schematic diagram showing body posture during trunk extension and variables used to find the location at which vertebral extension force was applied to the model, with an origin at the hip joint center (HJC). The black box shows the location of the seat in relation to the subject. The white arrow denotes the location of applied extension force.
The height of the seatback extension bar that subjects pushed against during testing was measured for each individual with respect to the top of the seat (Lbar_to_seat). Sagittal scout views from the QCT scans were used to measure the locations of the hip joint center and ischial tuberosity of the pelvis, providing the distance between them (LHJC_IT). Furthermore, the soft tissue thickness overlying the ischial tuberosity was measured (TST), but as the QCT scans were taken with the subjects in a supine position, the tissue thickness over the ischial tuberosity will be reduced in a seated position to approximately 19% of the tissue thickness when supine (0.19 TST).47
With this information, the force height from the hip joint center was calculated as (Fig. 1):
| (2) |
The applied force was exerted on a specific thoracic vertebra in each model. The vertical height from hip joint center (Lbar_HJC) was compared to the vertebral center of mass heights in the subject-specific model, and the external force was applied to the thoracic vertebra whose center of mass height was closest to the height of the bar.
Static Optimization
The individual musculoskeletal models were solved using an inverse dynamics based static optimization with a cost function that minimized the sum of cubed muscle activation.48 To determine the model-predicted strength, we increased the externally applied force, beginning at 200N, in 10N increments. When the applied external force exceeded the strength of the model, the optimization consistently failed to find a solution because the muscles were too weak to balance the forces acting on it. Thus, the model-predicted strength was taken to be the highest external force for which the static optimization successfully solved.
Subject-Specific MMS Estimations
When measured strength was different than model-predicted strength, the MMS of that subject’s model was iteratively changed until the model-predicted strength matched the measured strength within 20 N. The same MMS value was used for all muscle groups.
Statistical Methods
The effects of muscle attenuation, sex, subject age and back pain on measured extension strength, predicted extension strength, and estimated MMS were examined individually in separate bivariate linear regression models, and were combined within in separate multivariable linear regression models describing each dependent variable. Measured and predicted trunk extension strengths of men and women were compared using a paired 2-tailed student’s t-test. Calculated MMS values were compared between men and women using a 2-tailed student’s t-test. Statistical analyses were performed in Stata (StataCorp LP, College Station, TX) with significance set at α = 0.05.
RESULTS
A total of 49 participants (34 women and 15 men, 67–96 years old) took part in this study, with subject characteristics shown in Table 1. On average, the men were older and taller than the women. Abdominal QCT scans were obtained in all 49 participants, but one subject lacked a phantom in their QCT scan, resulting in usable muscle CSA and moment arms, but not attenuation values.
Table 1.
Mean (standard deviation) characteristics of study participants
| Characteristic | All (n=49) | Women (n=34) | Men (n=15) |
|---|---|---|---|
| Age (yrs) | 78.24 (7.2) | 76.82 (6.2) | 81.47 (8.5) |
| Weight (kg) | 75.87 (16.1) | 74.63 (18.2) | 78.67 (9.6) |
| Height (m) | 1.62 (0.1) | 1.59 (0.1) | 1.69 (0.1) |
| Muscle Attenuation (HU) | 26.56 (11.5) | 25.53 (12.2) | 28.90 (9.5) |
| Pain Score: | |||
| No or Low Pain (Score<5) | 84% (n=41) | 82% (n=28) | 87% (n=13) |
| Moderate to Severe Pain (Score≥5) | 16% (n=8) | 18% (n=6) | 13% (n=2) |
The vertebral levels at which extension force was applied in the musculoskeletal models was specific to each subject. Among women, 59% had the extension force applied at T5, with some higher (24% between T1 and T4) and some lower (18% at T6 or T7). The level of extension force application was slightly lower in the spine for men, with 13% at T5, 47% at T6, and 40% at T7.
Measured trunk extension strength was 30% higher in men than in women, and model-predicted trunk extension strength with a constant MMS value of 100 N/cm2 was similarly 30% higher in men than women (Table 2). However, with a constant MMS value of 100 N/cm2, the model significantly over-predicted trunk extension strength by about 38% (p<0.001) (Table 2, Fig. 2). The slope of the regression line between predicted and measured trunk extension strength was 0.83 (95% CI 0.51 – 1.16). Estimated MMS values were not different for men and women (p=0.99), both having an average of 75.5 N/cm2. MMS was not associated with age (p=0.74) or muscle attenuation (p=0.06) in single regressions, however muscle attenuation was negatively associated with MMS in a multiple regression (p=0.04).
Table 2.
Mean (SD) of measured strength and musculoskeletal modeling results
| All | Women | Men | P-value | |
|---|---|---|---|---|
| Measured Trunk Extension Strength (N) | 542.0 (148.5) | 496.2 (121.9) | 645.9 (154.5) | <0.001 |
|
Predicted Trunk Extension Strength (N) *From subject-specific model, constant MMS =100 |
747.6 (206.5) | 684.7 (175.5) | 890.0 (205.5) | <0.001 |
|
Predicted Trunk Extension Strength (N) *From subject-specific model, subject-specific MMS |
539.8 (151.8) | 495.3 (125.2) | 640.7 (162.2) | <0.001 |
| Subject-Specific MMS (N/cm2) | 75.5 (20.4) | 75.5 (20.2) | 75.5 (21.7) | 0.999 |
Figure 2.
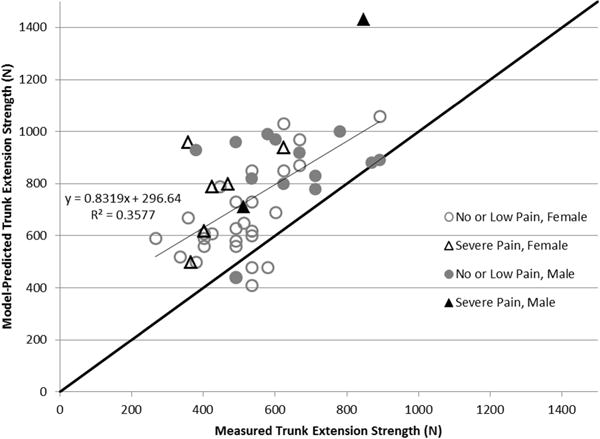
Measured versus model-predicted trunk extension strength with a constant MMS of 100 N/cm2. Subjects with moderate-severe low back pain are depicted by triangles, while those with low or no back pain are depicted by circles. Shaded markers indicate male, while open markers indicate female. The black line of y=x represents the ideal situation where model predictions match the measured trunk extension strength.
Subjects reporting moderate or severe back pain had a significantly lower apparent MMS than subjects with little or no back pain, with values of 60.9±10.8 N/cm2 and 78.3±20.7 N/cm2 respectively (p<0.05) (Fig. 3). There was no significant difference in measured or predicted trunk extension strength based on back pain.
Figure 3.
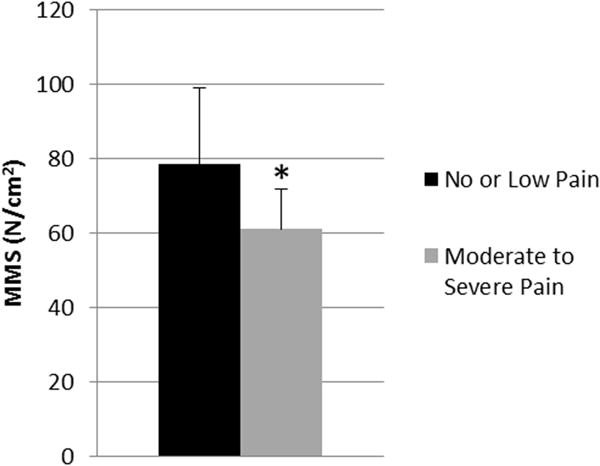
Average MMS prediction from subject-specific models in subjects with and without back pain. Black column represents adults with no or low pain scores; grey column represents adults with moderate to severe pain scores. Error bars are standard deviation. * p<0.05 vs no/low back pain group
DISCUSSION
This study estimated apparent trunk extensor muscle MMS in 49 mobility-limited older men and women using a unique combination of a validated thoracolumbar spine model, measured trunk extension strength, and subject-specific muscle morphology based on CT scans. This MMS is considered ‘apparent’ MMS since in addition to the muscle itself it may capture external factors that affect in vivo muscle strength, such as decreased neuromuscular activation or pain limitations. The range of MMS values across all subjects in this study (40–130 N/cm2) compares favorably with values reported in a prior study of 10 young men where trunk MMS ranged from 29–108 N/cm2,36 and also overlaps the MMS of 100 N/cm2 used in the base model.42 On the other hand, our mean trunk MMS value of 78 N/cm2 for elderly adults with no back pain is higher than the commonly used value of 46 N/cm2.33 For this estimate, Bogduk et al.33 created a lumbar spine model based on anatomic descriptions, radiographs, and cadaver studies of men and women. They then calculated the maximum extensor moment about L5/S1 for erector spinae and multifidus fascicles in terms of MMS, and equated this to the average moment of 145 Nm reported by McNeill et al.49 for a group of healthy men and women (age=42 years). Using the approach as Bogduk et al.33 with the OpenSim model of Bruno et al.42 used in this study produces a similarly low MMS estimate of 37 N/cm2. This suggests that these lower MMS estimates are an artifact of the methodology, which does not require balanced forces across the whole spine. Simulating trunk extension tests using a customizable subject-specific model with static optimization, as in this study, does require balanced forces across the whole spine and thus should be considered more realistic. While our results suggest wide variation in MMS between individuals, very little of this is explained by the independent variables we examined in our primary analysis. Thus, we have provided regressions in Supplement 1 (Table S1) for investigators seeking to estimate apparent MMS based on direct measurements of trunk extension strength.
Overall, our data showed no association between apparent MMS and age or sex, but we did see a negative correlation with muscle attenuation. A few studies have reported an indirect negative association between age and MMS, due to a larger decrease in muscle strength than CSA,13 and an increase in intra-muscular adipose and connective tissue in the total muscle volume,12 however it’s difficult to state that these apparent decreases in MMS weren’t due to other factors, such as pain or neuromuscular activation changes. Our study was limited to older adults with mobility problems, with an age range of 67 to 96 years. This sample of older adults may have limited our ability to detect correlations between age and MMS leading to the lack of support for our hypothesis regarding MMS decreasing with increasing age. We didn’t detect differences in MMS between sexes. This finding agrees with most available data in both young and old men and women.15,17,50 The negative correlation of MMS with muscle attenuation was counter to our hypothesis, but arises from the fact that attenuation is associated with muscle size as well as strength. While we previously reported in this same group of subjects that attenuation was associated with strength independent of muscle size,41 muscle CSA and attenuation are also positively associated. In fact, the association between attenuation and CSA (r=0.69, p <0.0001) is stronger than the association between attenuation and strength (r =0.34, p = 0.02), meaning that since MMS can be thought of as strength/CSA, an increase in attenuation would decrease this ratio.
Subjects that self-reported moderate or severe low back pain had significantly lower MMS values than subjects with no or minimal low back pain, suggesting that these individuals produced less muscle force than their muscle size indicates they are capable of. This is consistent with studies reporting reduced trunk muscle strength in patients with low back pain.24,51 However, it is not fully known if this difference reflects an actual reduction in muscle function, or an apparent reduction because subjects do not utilize the full strength capabilities of their muscles due to pain during strength testing. The latter seems likely, as a reliability study reported that acute development of moderate back pain in two participants led to a 4 standard deviation reduction in their measured extension strength between baseline and retesting.2 Additionally, patients with low back pain may have increased co-contraction of abdominal muscles,52,53 which would act in opposition to trunk extension, reducing their overall extension strength. Given that low back pain may inhibit extensor muscle activation due to pain and increase co-contraction of abdominal muscles, estimates of MMS from these patients could be artificially lower, albeit reflecting the true functional capacity of the individual. Based on the observations in this study, functional limitations due to pain should be considered in future modeling studies, as they may modify the capabilities suggested by the morphology of the musculoskeletal system.
Our study had a number of limitations that could introduce errors or uncertainty into estimates of MMS. One limitation of our study was that the differences between measured and model-predicted trunk extension strength were assumed to be entirely due to MMS. This is a reasonable assumption because it is known that MMS has a high inter-subject variability,36 and will therefore have an important role in this demanding maximum trunk extension strength activity. Due to the extension exercise modeled, the estimated MMS primarily applies to trunk extensor muscles and may not be applicable to abdominal muscles or other trunk muscle groups. One concern that persists across all studies investigating MMS is that a subject’s measured trunk strength might not actually be their maximum trunk strength. Measured trunk extension strength underestimation might have resulted from muscle fatigue due to repeated exertions while testing for maximal strength. Furthermore, the slight concentric movement during trunk extension might have reduced the strength measurements from that of a completely isometric contraction. Thus measured strength may be below actual isometric strength, in which case the estimated MMS would be reduced as well. In biomechanical modeling, trunk strength depends on body positioning. For instance, lumbar lordosis and pelvic orientation are substantially altered from upright standing to a seated position. This is true of trunk extension strength as well, for instance trunk extension strength is significantly different when sitting or kneeling compared to standing.54,55 Our OpenSim musculoskeletal model allowed replication of the testing set-up by placing the model in a seated position with arms crossed at the chest. However, a limitation is that our model assumed a similar spinal and pelvic position in each subject, while this could have varied between subjects during actual testing. On the other hand, the variations in how subjects of different body size encountered the machine were calculated and modeled accordingly. We also used a cost function that minimized the sum of cubed muscle activations, a standard approach that seeks to minimize fatigue and maximize endurance. It is not well studied whether a different cost function would be more appropriate for a maximum output situation such as this, although in theory any cost function should converge to a similar maximum output. Nonetheless, it’s possible that a different optimization approach could have resulted in slightly higher estimated strength values, which would have reduced estimated MMS. Lastly, while respectable, the sample size of the study limited our ability to investigate all possible MMS covariates. Overall, the level of subject specificity in the models is a great strength of this study, and our 49 unique subject-specific models were a large sample size for a modeling-based study.
In summary, this is the first study to estimate trunk muscle MMS in a large group of individuals using measured trunk extension strength, muscle morphology from lumbar spine QCT images, and subject-specific thoracolumbar musculoskeletal models. Our musculoskeletal models over-predicted trunk extension strength when using a constant MMS of 100 N/cm2. We found that using an MMS of 78.3 N/cm2 in the musculoskeletal models led to the best predictions of measured trunk strength for both men and women who are mobility limited, have minimal low back pain, and are over 65 years of age. Additional studies are needed to determine if MMS values are similar in younger healthy subjects. Trunk MMS was not correlated with sex or age in this study, but was significantly lower in those with moderate to severe low back pain. This finding warrants further investigation to discover if intrinsic MMS is actually decreasing with pain, or if subjects in pain were just unable to exert their true maximal strength, lowering their apparent MMS.
Supplementary Material
Acknowledgments
This work was supported by a Departmental Research Grant Award from the Department of Orthopaedics, Beth Israel Deaconess Medical Center, the National Space Biomedical Research Institute through NASA NCC 9-58, and by the National Institutes of Health through grants T32AG023480, R01AG032052, F31AG041629 and R01AR053986.
Footnotes
Author Contributions Statement: Study conception and design: MB, JB and DA. Acquisition of data: KB, AB, JB and DA. Statistical analysis: KB and DA. Interpretation of data: KB, JB, MB and DA. Drafting manuscript: KB and DA. Manuscript revision and approval: KB, AB, MB, JB and DA. All authors contributed substantially to the study and manuscript preparation, and all have read and concur with the final content.
Contributor Information
Katelyn A. Burkhart, Harvard-MIT Health Sciences and Technology Program, Massachusetts Institute of Technology, Cambridge, MA 02139; Center for Advanced Orthopaedic Studies, Beth Israel Deaconess Medical Center, 330 Brookline Ave., RN 119, Boston, MA 02215.
Alexander G. Bruno, Harvard-MIT Health Sciences and Technology Program, Massachusetts Institute of Technology, Cambridge, MA 02139 Center for Advanced Orthopaedic Studies, Beth Israel Deaconess Medical Center, 330 Brookline Ave., Boston, MA 02215.
Mary L. Bouxsein, Harvard-MIT Health Sciences and Technology Program, Massachusetts Institute of Technology, Cambridge, MA 02139 Center for Advanced Orthopaedic Studies, Beth Israel Deaconess Medical Center, 330 Brookline Ave., Boston, MA 02215; Department of Orthopaedic Surgery, Harvard Medical School, Boston, MA 02115.
Jonathan F. Bean, New England Geriatric Research Education and Clinical Center, VA Boston Healthcare System, 150 South Huntington St., Boston, MA, 02130 Spaulding Rehabilitation Hospital, Boston, MA 02115; Department of Physical Medicine and Rehabilitation, Harvard Medical School, Boston, MA, 02115.
Dennis E. Anderson, Center for Advanced Orthopaedic Studies, Beth Israel Deaconess Medical Center, 330 Brookline Ave., Boston, MA 02215 Department of Orthopaedic Surgery, Harvard Medical School, Boston, MA 02115.
References
- 1.Suri P, Kiely D, Leveille S, et al. Trunk Muscle Attributes are Associated with Balance and Mobility in Older Adults: A Pilot Study. PMC. 2009;1(10):916–924. doi: 10.1016/j.pmrj.2009.09.009. [DOI] [PMC free article] [PubMed] [Google Scholar]
- 2.Kienbacher T, Paul B, Habenicht R, et al. Reliability of isometric trunk moment measurements in healthy persons over 50 years of age. J Rehabil Med. 2014;46(3):241–249. doi: 10.2340/16501977-1266. [DOI] [PubMed] [Google Scholar]
- 3.Miyakoshi N, Hongo M, Maekawa S, et al. Back extensor strength and lumbar spinal mobility are predictors of quality of life in patients with postmenopausal osteoporosis [Internet] Osteoporos Int. 2007;18(10):1397–1403. doi: 10.1007/s00198-007-0383-3. Available from: http://link.springer.com/10.1007/s00198-007-0383-3. [DOI] [PubMed] [Google Scholar]
- 4.Sinaki M, Itoi E, Wahner HW, et al. Stronger back muscles reduce the incidence of vertebral fractures: A prospective 10 year follow-up of postmenopausal women. Bone. 2002;30(6):836–841. doi: 10.1016/s8756-3282(02)00739-1. [DOI] [PubMed] [Google Scholar]
- 5.Goodpaster BH, Park SW, Harris TB, et al. The loss of skeletal muscle strength, mass, and quality in older adults: The Health, Aging and Body Composition Study [Internet] Journals Gerontol – Ser A Biol Sci Med Sci. 2006;61(10):1059–1064. doi: 10.1093/gerona/61.10.1059. Available from: http://www.scopus.com/inward/record.url?eid=2-s2.0-33750927350&partnerID=tZOtx3y1. [DOI] [PubMed] [Google Scholar]
- 6.Narici M. Human skeletal muscle architecture studied in vivo by non-invasive imaging techniques: functional significance and applications. J Electromyogr Kinesiol. 1999;9:97–103. doi: 10.1016/s1050-6411(98)00041-8. [DOI] [PubMed] [Google Scholar]
- 7.Pruim GJ, de Jongh HJ, ten Bosch JJ. Forces acting on the mandible during bilateral static bite at different bite force levels. J Biomech. 1980;13(9):755–763. doi: 10.1016/0021-9290(80)90237-7. [DOI] [PubMed] [Google Scholar]
- 8.Buchanan TS. Evidence that maximum muscle stress is not a constant: differences in specific tension in elbow flexors and extensors [Internet] Med Eng Phys. 1995;17(7):529–536. doi: 10.1016/1350-4533(95)00005-8. Available from: http://www.sciencedirect.com/science/article/pii/1350453395000058. [DOI] [PubMed] [Google Scholar]
- 9.Fukunaga T, Hodgson JA, Hodgson JA. Specific tension of human plantar flexors and dorsiflexors. J Appl Physiol. 1996;80(1):158–165. doi: 10.1152/jappl.1996.80.1.158. [DOI] [PubMed] [Google Scholar]
- 10.Chow JW, Darling WG, Ehrhardt JC. Determining the force-length-velocity relations of the quadriceps muscles: II. Maximum Muscle Stress. J Appl Biomech. 1999;15(2):191–199. [Google Scholar]
- 11.Davies CTM, Thomas DO, White MJ. Mechanical Properties of Young and Elderly Human Muscle. Acta Physiol Scand. 1986;220(771):219–226. doi: 10.1111/j.0954-6820.1986.tb08954.x. [DOI] [PubMed] [Google Scholar]
- 12.Csapo R, Malis V, Sinha U, et al. Age-associated differences in triceps surae muscle composition and strength – an MRI-based cross-sectional comparison of contractile, adipose and connective tissue. [Internet] BMC Musculoskelet Disord. 2014;15(1):209. doi: 10.1186/1471-2474-15-209. Available from: http://www.pubmedcentral.nih.gov/articlerender.fcgi?artid=4072482&tool=pmcentrez&rendertype=abstract. [DOI] [PMC free article] [PubMed] [Google Scholar]
- 13.Klitgaard H, Mantoni M, Schiaffino S, et al. Function, morphology and protein expression of ageing skeletal muscle: a cross-sectional study of elderly men with different training backgrounds. Acta Physiol Scand. 1990;140:41–54. doi: 10.1111/j.1748-1716.1990.tb08974.x. [DOI] [PubMed] [Google Scholar]
- 14.Morse CI, Thom JM, Reeves ND, et al. In vivo physiological cross-sectional area and specific force are reduced in the gastrocnemius of elderly men. J Appl Physiol. 2005;99(3):1050–1055. doi: 10.1152/japplphysiol.01186.2004. [DOI] [PubMed] [Google Scholar]
- 15.Kent-Braun JA, Ng AV. Specific strength and voluntary muscle activation in young and elderly women and men. J Appl Physiol. 1999;87(1):22–29. doi: 10.1152/jappl.1999.87.1.22. [DOI] [PubMed] [Google Scholar]
- 16.O’Brien TD, Reeves ND, Baltzopoulos V, et al. In vivo measurements of muscle specific tension in adults and children. Exp Physiol. 2010;95(1):202–210. doi: 10.1113/expphysiol.2009.048967. [DOI] [PubMed] [Google Scholar]
- 17.Häkkinen K, Häkkinen A. Muscle cross-sectional area, force production and relaxation characteristics in women at different ages. Eur J Appl Physiol Occup Physiol. 1991;62(6):410–414. doi: 10.1007/BF00626612. [DOI] [PubMed] [Google Scholar]
- 18.Schantz P, Randall-Fox E, Hutchison W, et al. Muscle fibre type distribution, muscle cross-sectional area and maximal voluntary strength in humans. [Internet] Acta Physiol Scand. 1983;117(2):219–26. doi: 10.1111/j.1748-1716.1983.tb07200.x. Available from: http://www.ncbi.nlm.nih.gov/pubmed/6223509. [DOI] [PubMed] [Google Scholar]
- 19.Stoll T, Huber E, Seifert B, et al. Original Article Maximal Isometric Muscle Strength : Normative Values and Gender-Specific Relation to Age. Clin Rheumatol. 2000;19:105–113. doi: 10.1007/s100670050026. [DOI] [PubMed] [Google Scholar]
- 20.Goodpaster BH, Carlson CL, Visser M, et al. Attenuation of skeletal muscle and strength in the elderly: The Health ABC Study. J Appl Physiol. 2001;90(6):2157–2165. doi: 10.1152/jappl.2001.90.6.2157. [DOI] [PubMed] [Google Scholar]
- 21.Hicks GE, Simonsick EM, Harris TB, et al. Cross-sectional associations between trunk muscle composition, back pain, and physical function in the health, aging and body composition study [Internet] J Gerontol A Biol Sci Med Sci. 2005;60A(7):882–887. doi: 10.1093/gerona/60.7.882. Available from: http://www.ncbi.nlm.nih.gov/pubmed/16079212. [DOI] [PubMed] [Google Scholar]
- 22.Takemasa R, Yamamoto H, Tani T. Trunk muscle strength in and effect of trunk muscle exercises for patients with chronic low back pain. The differences in patients with and without organic lumbar lesions [Internet] Spine (Phila Pa 1976) 1995;20(23):2522–2530. doi: 10.1097/00007632-199512000-00012. Available from: http://www.ncbi.nlm.nih.gov/entrez/query.fcgi?cmd=Retrieve&db=PubMed&dopt=Citation&list_uids=8610247. [DOI] [PubMed] [Google Scholar]
- 23.Parkkola R, Rytökoski U, Kormano M. Magnetic resonance imaging of the discs and trunk muscles in patients with chronic low back pain and healthy control subjects. Spine (Phila Pa 1976) 1993;18(7):830–836. doi: 10.1097/00007632-199306000-00004. [DOI] [PubMed] [Google Scholar]
- 24.Lee JH, Ooi Y, Nakamura K. Measurement of muscle strength of the trunk and the lower extremities in subjects with history of low back pain. [Internet] Spine (Phila Pa 1976) 1995;20(18):1994–6. doi: 10.1097/00007632-199509150-00006. Available from: http://www.ncbi.nlm.nih.gov/pubmed/8578374. [DOI] [PubMed] [Google Scholar]
- 25.Danneels LA, Vanderstraeten GG, Cambier DC, et al. CT imaging of trunk muscles in chronic low back pain patients and healthy control subjects [Internet] Eur Spine J. 2000;9(4):266–272. doi: 10.1007/s005860000190. Available from: http://www.ncbi.nlm.nih.gov/entrez/query.fcgi?cmd=Retrieve&db=PubMed&dopt=Citation&list_uids=11261613. [DOI] [PMC free article] [PubMed] [Google Scholar]
- 26.Anderson DE, D’Agostino JM, Bruno AG, et al. Variations of CT-based trunk muscle attenuation by age, sex, and specific muscle. Journals Gerontol – Ser A Biol Sci Med Sci. 2013;68(3):317–323. doi: 10.1093/gerona/gls168. [DOI] [PMC free article] [PubMed] [Google Scholar]
- 27.Hicks G, Simonsick EM, Harris TB, et al. Trunk Muscle Composition as a Predictor of Reduced Functional Capacity in the Health, Aging and Body Composition Study: The Moderating Role of Back Pain. Journals Gerontol Ser A Biol Sci Med Sci. 2005;60A(11):1420–1424. doi: 10.1093/gerona/60.11.1420. [DOI] [PubMed] [Google Scholar]
- 28.Bruno AG, Mokhtarzadeh H, Allaire BT, et al. Incorporation of CT-based measurements of trunk anatomy into subject-specific musculoskeletal models of the spine influences vertebral loading predictions. J Orthop Res. 2017 doi: 10.1002/jor.23524. In Press. Available from: http://doi.wiley.com/10.1002/jor.23524. [DOI] [PMC free article] [PubMed]
- 29.Bruno AG, Burkhart K, Allaire B, et al. Spinal Loading Patterns from Biomechanical Modeling Explain the High Incidence of Vertebral Fractures in the Thoracolumbar Region. J Bone Miner Res. 2017 doi: 10.1002/jbmr.3113. In Press. Available from: http://doi.wiley.com/10.1002/jbmr.3113. [DOI] [PMC free article] [PubMed]
- 30.Ghezelbash F, Shirazi-Adl A, Arjmand N, et al. Subject-specific biomechanics of trunk: musculoskeletal scaling, internal loads and intradiscal pressure estimation. Biomech Model Mechanobiol. 2016:1–14. doi: 10.1007/s10237-016-0792-3. [DOI] [PubMed] [Google Scholar]
- 31.Bruno AG, Anderson DE, D’Agostino J, Bouxsein ML. The effect of thoracic kyphosis and sagittal plane alignment on vertebral compressive loading. J Bone Miner Res. 2012;27(10):2144–2151. doi: 10.1002/jbmr.1658. [DOI] [PMC free article] [PubMed] [Google Scholar]
- 32.Briggs AM, Wrigley TV, Van Dieën JH, et al. The effect of osteoporotic vertebral fracture on predicted spinal loads in vivo. Eur Spine J. 2006;15(12):1785–1795. doi: 10.1007/s00586-006-0158-0. [DOI] [PubMed] [Google Scholar]
- 33.Bogduk N, Macintosh JE, Pearcy MJ. A universal model of the lumbar back muscles in the upright position. Spine (Phila Pa 1976) 1992;17(8):897–913. doi: 10.1097/00007632-199208000-00007. [DOI] [PubMed] [Google Scholar]
- 34.Christophy M, Faruk Senan NA, Lotz JC, O’Reilly OM. A Musculoskeletal model for the lumbar spine. Biomech Model Mechanobiol. 2012;11(1–2):19–34. doi: 10.1007/s10237-011-0290-6. [DOI] [PubMed] [Google Scholar]
- 35.Stokes IAF, Gardner-Morse M. Lumbar spine maximum efforts and muscle recruitment patterns predicted by a model with multijoint muscles and joints with stiffness. J Biomech. 1995;28(2):173–186. doi: 10.1016/0021-9290(94)e0040-a. [DOI] [PubMed] [Google Scholar]
- 36.van Dieën JH, Kingma I. Effects of antagonistic co-contraction on differences between electromyography based and optimization based estimates of spinal forces. [Internet] Ergonomics. 2005;48(4):411–26. doi: 10.1080/00140130512331332918. Available from: http://www.ncbi.nlm.nih.gov/pubmed/15804849. [DOI] [PubMed] [Google Scholar]
- 37.Arjmand N, Gagnon D, Plamondon A, et al. Comparison of trunk muscle forces and spinal loads estimated by two biomechanical models [Internet] Clin Biomech. 2009;24(7):533–541. doi: 10.1016/j.clinbiomech.2009.05.008. Available from: http://linkinghub.elsevier.com/retrieve/pii/S0268003309001004. [DOI] [PubMed] [Google Scholar]
- 38.Briggs AM, van Dieën JH, Wrigley TV, et al. Thoracic kyphosis affects spinal loads and trunk muscle force. Phys Ther. 2007;87(5):595–607. doi: 10.2522/ptj.20060119. [DOI] [PubMed] [Google Scholar]
- 39.El Ouaaid Z, Shirazi-Adl A, Plamondon A, Larivière C. Trunk strength, muscle activity and spinal loads in maximum isometric flexion and extension exertions: A combined in vivo-computational study [Internet] J Biomech. 2013;46(13):2228–2235. doi: 10.1016/j.jbiomech.2013.06.018. Available from: http://linkinghub.elsevier.com/retrieve/pii/S0021929013002923. [DOI] [PubMed] [Google Scholar]
- 40.Holt NE, Percac-Lima S, Kurlinski LA, et al. The boston rehabilitative impairment study of the elderly: A description of methods [Internet] Arch Phys Med Rehabil. 2013;94(2):347–355. doi: 10.1016/j.apmr.2012.08.217. Available from: http://dx.doi.org/10.1016/j.apmr.2012.08.217. [DOI] [PMC free article] [PubMed] [Google Scholar]
- 41.Anderson DE, Bean JF, Holt NE, et al. Computed tomography-based muscle attenuation and electrical impedance myography as indicators of trunk muscle strength independent of muscle size in older adults. [Internet] Am J Phys Med Rehabil. 2014;93(7):553–61. doi: 10.1097/PHM.0000000000000059. Available from: http://www.ncbi.nlm.nih.gov/pubmed/24508931. [DOI] [PMC free article] [PubMed] [Google Scholar]
- 42.Bruno AG, Bouxsein ML, Anderson DE. Development and validation of a musculoskeletal model of the fully articulated thoracolumbar spine and rib cage. [Internet] J Biomech Eng. 2015;137:1–10. doi: 10.1115/1.4030408. August 2015. Available from: http://www.ncbi.nlm.nih.gov/pubmed/25901907. [DOI] [PMC free article] [PubMed] [Google Scholar]
- 43.Robb R. The Biomedical Imaging Resource at Mayo Clinc [Internet] IEEE Trans Med Imaging. 2001;20(9):854–867. doi: 10.1109/42.952724. Available from: http://www.ncbi.nlm.nih.gov/pubmed/21900812. [DOI] [PubMed] [Google Scholar]
- 44.Delp SL, Anderson FC, Arnold AS, et al. OpenSim: Open-source software to create and analyze dynamic simulations of movement. IEEE Trans Biomed Eng. 2007;54(11):1940–1950. doi: 10.1109/TBME.2007.901024. [DOI] [PubMed] [Google Scholar]
- 45.Hansen L, de Zee M, Rasmussen J, et al. Anatomy and biomechanics of the back muscles in the lumbar spine with reference to biomechanical modeling. [Internet] Spine (Phila Pa 1976) 2006;31(17):1888–99. doi: 10.1097/01.brs.0000229232.66090.58. Available from: http://www.ncbi.nlm.nih.gov/pubmed/16924205. [DOI] [PubMed] [Google Scholar]
- 46.De Carvalho DE, Soave D, Ross K, Callaghan JP. Lumbar Spine and Pelvic Posture Between Standing and Sitting: A Radiologic Investigation Including Reliability and Repeatability of the Lumbar Lordosis Measure [Internet] J Manipulative Physiol Ther. 2010;33(1):48–55. doi: 10.1016/j.jmpt.2009.11.008. Available from: http://dx.doi.org/10.1016/j.jmpt.2009.11.008. [DOI] [PubMed] [Google Scholar]
- 47.Makhsous M, Lin F, Cichowski A, et al. Use of MRI images to measure tissue thickness over the ischial tuberosity at different hip flexion. [Internet] Clin Anat. 2011;24(5):638–45. doi: 10.1002/ca.21119. Available from: http://www.ncbi.nlm.nih.gov/pubmed/21647964. [DOI] [PubMed] [Google Scholar]
- 48.Hughes RE. Effect of optimization criterion on spinal force estimates during asymmetric lifting. J Biomech. 2000;33(2):225–229. doi: 10.1016/s0021-9290(99)00153-0. [DOI] [PubMed] [Google Scholar]
- 49.McNeill T, Warwick D, Andersson G, Schultz A. Trunk strengths in attempted flexion, extension, and lateral bending in healthy subjects and patients with low-back disorders. [Internet] Spine (Phila Pa 1976) 1980;5(6):529–538. doi: 10.1097/00007632-198011000-00008. Available from: http://ukpmc.ac.uk/abstract/MED/6451033. [DOI] [PubMed] [Google Scholar]
- 50.Rantalainen T, Heinonen A, Komi PV, Linnamo V. Neuromuscular performance and bone structural characteristics in young healthy men and women. [Internet] Eur J Appl Physiol. 2008;102(2):215–22. doi: 10.1007/s00421-007-0575-8. Available from: http://www.ncbi.nlm.nih.gov/pubmed/17926061. [DOI] [PubMed] [Google Scholar]
- 51.Van Dieen JH, Selen LPJ, Cholewicki J. Trunk muscle activation in low-back pain patients, an analysis of the literature. J Electromyogr Kinesiol. 2003;13(4):333–351. doi: 10.1016/s1050-6411(03)00041-5. [DOI] [PubMed] [Google Scholar]
- 52.Schinkel-Ivy A, Nairn BC, Drake JDM. Investigation of trunk muscle co-contraction and its association with low back pain development during prolonged sitting [Internet] J Electromyogr Kinesiol. 2013;23(4):778–786. doi: 10.1016/j.jelekin.2013.02.001. Available from: http://dx.doi.org/10.1016/j.jelekin.2013.02.001. [DOI] [PubMed] [Google Scholar]
- 53.D’hooge R, Hodges P, Tsao H, et al. Altered trunk muscle coordination during rapid trunk flexion in people in remission of recurrent low back pain [Internet] J Electromyogr Kinesiol. 2013;23(1):173–181. doi: 10.1016/j.jelekin.2012.09.003. Available from: http://dx.doi.org/10.1016/j.jelekin.2012.09.003. [DOI] [PubMed] [Google Scholar]
- 54.Kocjan A, Sarabon N. Assessment of isometric trunk strength – The relevance of body position and relationship between planes of movement. J Sport Sci Med. 2014;13(2):365–370. [PMC free article] [PubMed] [Google Scholar]
- 55.Gallagher S. Trunk extension strength and muscle activity in standing and kneeling postures. Spine (Phila Pa 1976) 1997;22(16):1864–1872. doi: 10.1097/00007632-199708150-00011. [DOI] [PubMed] [Google Scholar]
Associated Data
This section collects any data citations, data availability statements, or supplementary materials included in this article.