

Abstract
The medial entorhinal cortex (MEC) occupies a central position within neural circuits devoted to the representation of spatial location and orientation. The MEC contains cells that fire as a function of the animal’s head direction (HD), as well as grid cells that fire in multiple locations in an environment, forming a repeating hexagonal pattern. The MEC receives inputs from widespread areas of the cortical mantle including the ventral visual stream, which processes object recognition information, as well as information about visual landmarks. The role of the MEC in processing the HD signal or landmark information is unclear. We addressed this issue by neurotoxically damaging the MEC and recording HD cells within the anterodorsal thalamus (ADN). Direction-specific activity was present in the ADN of all animals with MEC lesions. Moreover, the discharge characteristics of ADN HD cells were only mildly affected by MEC lesions, with HD cells exhibiting greater anticipation of future HDs. Tests of landmark control revealed that HD cells in lesioned rats were capable of accurately updating their preferred firing directions in relation to a salient visual cue. Furthermore, cells from lesioned animals maintained stable preferred firing directions when locomoting in darkness and demonstrated stable HD cell tuning when locomoting into a novel enclosure, suggesting that MEC lesions did not disrupt the integration of idiothetic cues, or angular path integration, by HD cells. Collectively, these findings suggest that the MEC plays a limited role in the formation and spatial updating of the HD cell signal.
Keywords: navigation, orientation, grid cell, place cell, anterior thalamus
INTRODUCTION
Accurate navigation depends on a large network of limbic brain regions that determine the spatial position and orientation of an animal (Taube, 2007; Moser et al., 2008). Within this network, the medial entorhinal cortex (MEC) is thought to have a central role because of its pivotal position between cortical and hippocampal regions (Burwell, 2000; Kerr et al., 2007), and because damage to the entorhinal cortex impairs accurate navigation in rats (Parron and Save, 2004; Parron et al., 2004; Steffenach et al., 2005). Strong support for this view also comes from the recent discovery of neurons in the rat MEC that fire in multiple locations within an environment forming a regular, repeating hexagonal grid pattern (Hafting et al., 2005). Grid cells display the same spacing and orientation of their firing fields as anatomically adjacent grid cells; however each grid is distributed such that a small cell ensemble forms a map-like representation of the environment. Grid cells coexist with a second type of cell that signals an animal’s head direction (HD), (Sargolini et al., 2006). These HD cells are found in several other limbic regions (Fig. 1; Wiener and Taube, 2005; Taube, 2007), with each cell tuned to a different direction, collectively forming a neural compass that tracks the animal’s moment-to-moment orientation. Finally, a third type of spatial cell in the MEC is specifically tuned to the borders of the environment, but most frequently a single border (Savelli et al., 2008; Solstad et al., 2008). Cells that contain location-specific firing (place cells) have also been identified within the MEC (Quirk et al., 1990; Hargreaves et al., 2005), however, because these recordings were made in smaller environments it is possible that these cells were actually border or grid cells (Savelli et al., 2008). Taken together, these studies demonstrate that the MEC contains information about position, distance, direction, and environmental borders, which is sufficient to construct an accurate representation of the animal’s changing position in an environment.
FIGURE 1.
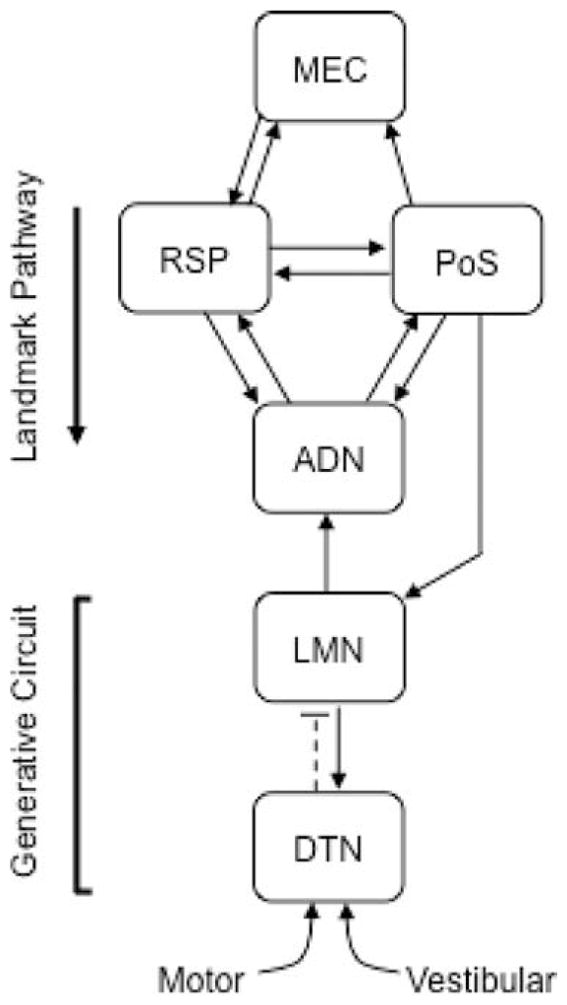
Brain regions within the limbic system that contain HD cells and a working model of information flow. Dark arrows represent excitatory connections, whereas broken lines depict inhibitory connections. The HD cell signal is generally thought to be generated within the reciprocal connections of the dorsal tegmental (DTN) and lateral mammillary nuclei (LMN) because both regions receive input from brain regions carrying idiothetic information (Brown et al., 2005; Biazoli et al., 2006; Clark et al., 2009), and lesions to both nuclei abolish the HD cell signal in downstream limbic regions (Basset et al., 2007; Blair et al., 2008; Sharp and Koester, 2008). Previous work suggests that the projections from the retrosplenial cortex to the anterodorsal thalamus (ADN) and from the postsubiculum (PoS) to ADN and LMN constitute pathways in which landmark information enters the HD cell circuit (Goodridge and Taube, 1997; Yoder and Taube, 2008; Clark et al., 2010). Because the medial entorhinal cortex (MEC) has prominent connections with the RSP, it is possible that the MEC contributes to this descending landmark-processing stream.
Numerous studies suggest that spatial information within the MEC plays a significant role in the formation and stability of location-specific neural activity within the hippocampus (McNaughton et al., 2006; Solstad et al., 2006; Blair et al., 2007; Burgess et al., 2007; Brun et al., 2008a; Van Cauter et al., 2008), however, it is presently unclear whether the MEC contributes to the processing of HD cell signals located throughout the limbic system (Fig. 1). Experimental work suggests that the HD cell signal is formed by the integration of idiothetic (vestibular or motor/proprioceptive) cues within the reciprocal connections of the dorsal tegmental and lateral mammillary nuclei (Blair et al., 1999; Bassett et al., 2007), with descending projections from the retrosplenial cortex and postsubiculum anchoring the HD system to salient environmental landmarks (Clark et al., 2010; Goodridge and Taube, 1997). Although the postsubiculum and retrosplenial cortex project to the MEC (Jones and Witter, 2007; van Strien et al., 2009), it is possible that the MEC contributes to this descending landmark processing pathway because, (1) it receives significant cortical inputs from visual-spatial processing regions via the inferior temporal regions (Burwell, 2000; Kerr et al., 2007), (2) damage to the entorhinal cortex impairs landmark-based navigation in rats (Jarrard et al., 1984; Schenk and Morris, 1985; Parron et al., 2004; Steffenach et al., 2005), and (3) it provides a direct input into the HD cell circuit through the retrosplenial cortex (Wyss and Van Groen, 1992; Agster and Burwell, 2009). The MEC may also influence HD cell processing through its connections with the hippocampus, which in turn projects to the postsubiculum either directly or indirectly via the subiculum (van Groen and Wyss, 1990a). The purpose of the present study was to address the possible role of the entorhinal cortex in HD signal processing by neurotoxically damaging the MEC and recording HD cells within the anterodorsal thalamus (ADN) in rats. Here, we report that landmark and idiothetic control over HD cell tuning is largely spared after MEC lesions, suggesting that the MEC has a limited role in processing the limbic HD cell signal.
MATERIALS AND METHODS
Subjects
Subjects were 34 female Long-Evans rats, weighing 250–350 g at the beginning of testing. Rats were housed singly in Plexiglas cages and maintained on a 12 h light/dark cycle. Water was provided ad libitum while access to food was restricted as necessary to maintain the animal’s body weight in the range of 85–90% of its free feeding weight. Subjects were divided into MEC lesion (n = 16) or unlesioned control groups (n = 18). Some of the data from the control group was reported in a previous study (Clark et al., 2010). All procedures involving the rats were performed in compliance with institutional standards as set forth by the National Institutes of Health Guide for the Care and Use of Laboratory Animals.
Presurgical Training
Prior to surgery, rats were trained to forage for food pellets scattered on the floor of a gray wooden cylinder (76 cm in diameter; 50-cm high; Fig. 2A). The floor was composed of gray photographic backdrop paper that was changed between sessions. The inside of the cylinder was featureless except for a white cue card occupying ~ 100° of arc attached to the wall. The cue card was maintained at the same position throughout training. A black floor-to-ceiling curtain (2.5 m in diameter) surrounded the cylinder and four uniformly arranged lamps were located above the cylinder to provide illumination. A color video camera (model XC-711; Sony, Tokyo, Japan) was centered above the cylinder. Training continued until all animals spent most of their time in the cylinder foraging for food pellets (5–7 days).
FIGURE 2.
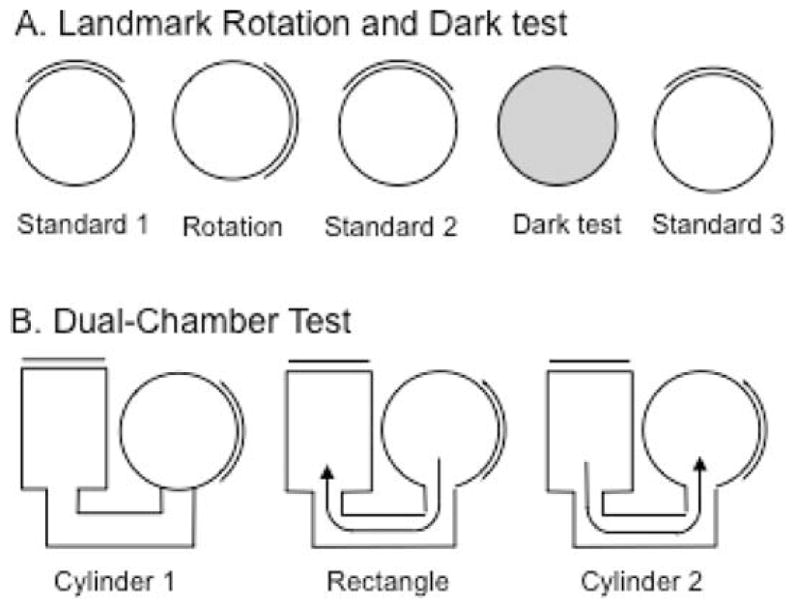
(A) Overhead view of the landmark rotation and dark test sessions. Each session, except the dark test, was separated by disorientation treatment. (B) Overhead view of the dual-chamber test sessions. The door to the rectangle was closed when the animal entered the rectangle. The door to the cylinder was closed during both cylinder sessions (Cylinder 1 and 2).
Lesions and Electrode Implantation
Animals were first anesthetized with Nembutal (40 mg kg−1, i.p.) and given atropine sulfate (5 mg kg−1, i.p.) to prevent respiratory distress. The animals were then placed in a Kopf stereotaxic instrument (David Kopf Instruments, Tujunga, CA) and an incision was made to expose the skull. Animals receiving MEC lesions (n = 16) first had small holes drilled into their skull above the MEC. Neurotoxic lesions were produced by lowering a 1-μl Hamilton syringe (Hamilton Company, Reno, NV) into the holes and infusing 0.03–0.06 μl of a 100 mM solution of N-methyl D-aspartate (NMDA; dissolved in 0.9% saline) at 14 injection sites (Table 1). For six of the injections, the syringe was placed at an angle in the saggital plane, and the anterior–posterior location was measured relative to the sinus. These sites were aimed at lesioning the dorsal-medial portions of the MEC because previous studies have shown that grid cells, HD cells, and border cells are found in high proportions within this region (Hafting et al., 2005; Sargolini et al., 2006; Solstad et al., 2008). Injection sites were based on coordinates provided by Paxinos and Watson (1998) and modified by histological results. For each injection, the NMDA solution was infused at a rate of 0.02 μl min−1, and the syringe was left in place for 3 min before it was slowly removed. The needle was wiped with distilled water after each injection and the syringe was tested to ensure that it was not clogged before being lowered to the next injection site.
TABLE 1.
Stereotaxic Coordinates and Injection Volume of NMDA
| Anterior-posterior (mm) | Medial-lateral (mm) | Dorsal-ventral (mm) | Angle (°) | Volume (μl) |
|---|---|---|---|---|
| −7.85a | ±4.95a | Bottom +1 | 0 | 0.06 |
| −8.25 | ±4.95 | Bottom +1 | 0 | 0.06 |
| −8.65 | ±4.90 | Bottom +1 | 0 | 0.06 |
| −9.05 | ±4.90 | Bottom +1 | 0 | 0.06 |
| +0.6b | ±4.30c | Bottom +1 | 10d | 0.03 |
| +0.6 | ±4.30 | Bottom +2 | 10 | 0.03 |
| +0.6 | ±4.30 | Bottom +3 | 10 | 0.03 |
For all injection sites, the needle was lowered to the bottom of the skull and then raised before infusion.
Relative to bregma.
Relative to transverse sinus.
Relative to lambda.
Needle was angled forward in the saggital plane.
All rats received implantation of recording electrodes above the ADN using the following coordinates: 1.95-mm posterior to bregma, 1.3-mm lateral to bregma and 3.7-mm below the cortical surface (Paxinos and Watson, 1998). Electrodes were constructed and surgically placed using methods similar to those described previously (Kubie, 1984; Taube, 1995a). Briefly, each electrode array consisted of a bundle of ten 25-μm diameter nichrome wires that were insulated except at the tip. The wires were threaded through a 26-gauge stainless steel cannula that was moveable in the dorsal/ventral direction after being fixed to the skull using dental acrylic.
Cell Screening Procedures
After 7 days of recovery from surgery, electrodes were monitored for cellular activity while the animals foraged for food in the cylinder. To detect cell activity, electrical signals were passed through a field-effect transistor in a source-follower configuration. Signals were amplified by a factor of 10,000–50,000 (Grass Instruments, West Warwick, RI), bandpass filtered (300–10,000 Hz, ≥3 dB/octave) and sent through a dual window discriminator (BAK Electronics) for spike discrimination. The position and directional orientation of the rat was determined by an automated video tracking system (Ebtronics, Elmont, NY). This video tracking hardware provided x and y coordinates of red and green light-emitting diodes (LED) secured 10-cm apart above the head and back of the animal, respectively. The HD of the animal was determined by the relative position of the red and green LEDs. Monitoring of cellular activity continued until each of the 10 implanted wires had been examined for HD cells or other cellular activity. If no HD cells were detected, the electrode was advanced 25–50 μm and the animal was returned to its home cage and monitored again either 4-h later or the next day. If an HD cell was identified, the cell was recorded for an 8-min session and its firing properties were evaluated (Fig. 2). Without detaching the recording cable, the animal was then removed from the cylinder and placed in a cardboard box located outside the curtained off area and the apparatus was then prepared for three different tests. For each experiment below, the floor paper was replaced in between testing sessions, and white noise was played from an overhead speaker.
Landmark rotation test
The experiment consisted of three separate 8-min sessions (Fig. 2A). First, a standard session (Standard 1) was performed in which HD cell activity was recorded while the rat foraged for food pellets in the cylinder. This session was followed by a rotation session in which the visual landmark was rotated 90° in either the clockwise (CW) or counter-clockwise (CCW) direction. The rotation of the cue always occurred while the animal was in the cardboard box (i.e., out of the view of the animal). Finally, the third session consisted of returning the cue card to its original position during the first session (Standard 2). Animals were given disorientation treatments prior to each recording session by placing the animal in a cardboard box and rotating it slowly (0.2–0.5 Hz) while the experimenter simultaneously walked around the testing room twice. This disorientation was used to prevent the animal from using idiothetic cues to maintain orientation from one session to the next.
Dark test
The test consisted of recording HD cell activity with the visual landmark removed and the room lights turned off (Fig. 2A). Prior to the dark test, the animals were removed from the cylinder and placed in a cardboard box while the floor paper was replaced and the cue card removed from the cylinder. To start the test, the room lights were turned off and the rat was gently placed in the cylinder and allowed to forage for food pellets for 8 min. Similar to previous studies (Good-ridge et al., 1998; Golob and Taube, 1999; Clark et al., 2009, 2010), animals were not disoriented prior to being placed in the cylinder for dark testing. To track the HD of the rat, the red and green LEDs remained on during the dark session. Although rats cannot see well in the red color spectrum (Neitz and Jacobs, 1986), they can see under green light. It is important to note, however, that preliminary findings from our laboratory indicate that the low level of green light present in the dark conditions is insufficient for the use of uncontrolled visual cues (see Materials and Methods in Clark et al., 2010).
Standard 3
After the 8-min dark test was complete, animals were removed from the cylinder and a final 8-min standard session (Standard 3) was conducted in which the room lights were turned back on, the floor paper replaced, and the cue card returned to its original position from the standard 1/2 sessions (Fig. 2A). Rats were given a disorientation treatment before being placed in the cylinder for Standard 3.
Dual-chamber test
The dual-chamber apparatus involves the animal self-locomoting into a novel enclosure (Taube and Burton, 1995). Figure 2B illustrates an overhead view of the dual-chamber apparatus which is composed of two gray colored compartments, a cylinder similar to that described above (76 cm in diameter) and a rectangle (51 cm × 69 cm) interconnected by a narrow U-shaped passageway (41 cm × 15 cm). The walls along one side of the alleyway were slanted by ~ 15° in order for the overhead video camera to view all areas of the passageway. A section of wall in each enclosure could be removed to control access between the two compartments and passageway. The walls of the rectangle were featureless except for a white cue card positioned along the wall such that it was rotated 90° CCW with respect to the cue card in the cylindrical compartment. The floors of the cylinder and rectangle were composed of gray photographic backdrop paper that was changed between animals. The passageway contained a gray painted wooden floor. Because the cylinder enclosure in the dual-chamber apparatus was similar to the cylinder the rats had been trained and screened in for several weeks, it was considered a familiar environment to the animals. The passageway and the rectangle represented a novel environment because the animals had no previous exposure to them. HD cells in control animals typically maintain a similar preferred firing direction between both compartments of the dual-chamber apparatus (Taube and Burton, 1995), and it has been shown that idiothetic cues available during the animal’s journey from the cylinder to the rectangle are crucial for maintaining a stable preferred direction (Stackman et al., 2003).
The procedure for the dual-chamber apparatus experiment consisted of three phases. First, the animal was placed in the cylinder portion of the apparatus with the door to the passageway closed (Cylinder 1 session). After allowing the animal to forage for food pellets scattered on the floor for 4 min, the cylinder compartment door was opened and the animal was free to walk into the passageway and enter the rectangle. Upon entering the rectangle, the hidden door was closed, trapping the animal inside the rectangle environment while the activity of the HD cell was monitored for 10 min (rectangle session). After the Rectangle session, the door to the rectangular compartment was opened and the rats were allowed to locomote back through the passageway to the cylinder where they were again trapped while HD cell activity was monitored for another 4 min (Cylinder 2). The dual-chamber apparatus experiment was conducted only once per animal since the task requires the rectangular compartment to be novel. Thus, only one HD cell recording session was collected per animal in this task.
Data Analysis
An automated video-computer tracking system, sampling at 60 Hz, recorded the number of spikes occurring during each sample period while simultaneously recording the x, y positions of each LED. Data analysis was accomplished off-line using custom software (LabView, National Instruments, Austin, TX). The animal’s HD was sorted into sixty 6° bins. Basic directional characteristics of the recorded cells were determined by examining cellular activity during the Standard 1 session. HD cells from lesioned and control animals were compared on measures of peak firing rate, background firing rate, directional firing range, directional information content, and anticipatory time interval (ATI). The preferred direction was defined as the directional bin with the highest firing rate. The peak firing rate was the firing rate corresponding to the preferred direction. The directional firing range was defined as the width at the base of a triangle fit to a firing rate vs. HD plot. The background firing rate was the average firing rate of all bins 18° outside the cell’s directional firing range. Directional information content is a measure of how many bits of HD information is conveyed by each spike (Skaggs et al., 1993) and was calculated by the following formula: directional information content = Σ pi (λi/λ) log2 (λi/λ), where pi is the probability that the head pointed in the ith directional bin, λi is the mean firing rate for bin i, and λ is the mean firing rate across all directional bins.
The ATI is a measure of the amount of time that cell firing best predicts where the animal will be pointing its head in the future. Previous work has estimated that the activity of ADN HD cells anticipate future head directions by ~ 25 ms (Blair and Sharp, 1995, Taube and Muller, 1998). We compared the ATI of cells from control and lesioned animals using the methods of Blair and Sharp (1995). First, HD cell tuning functions were calculated by constructing firing rate vs. HD plots by dividing the 360° directional range into sixty 6° bins and then calculating the average firing rate for each bin. Tuning functions were constructed for CW and CCW directions and the difference between the preferred firing directions for the two functions (i.e., separation angle) was determined. The spike record was then shifted forward and backward in time in steps of 16.67 ms (the maximum temporal resolution of the recording hardware) and the separation angle between the CW and CCW functions for head movements ≥90° s−1 computed for each shift. The spike series was shifted incrementally ±6 times (± 100 ms) relative to the HD series, providing 13 values of CW-CCW separation angles. A scattergram was then constructed from the 13 CW-CCW separation angles and their corresponding time shift. The x-intercept of the best-fit line of this plot is referred to as the ATI and is equivalent to the amount of time that the spike series has to be shifted to achieve overlapping CW and CCW functions. Cells with insufficient CW and CCW sampling were not included in this analysis. Using this criterion, six cells were removed from the control group and one cell was removed from the MEC lesion group for the analysis conducted on Session 1 data (see under Basic HD Cell Characteristics). In addition, two cells were removed from the under-rotation subgroup and three cells were removed from the normal cue control subgroup for the analysis conducted on the rotation session data (see under Landmark Rotation and Return).
Circular statistics (Batschelet, 1981) were used to determine the stability of the directional signal between the landmark rotation sessions, dark testing sessions, and the three dual-chamber sessions. Angular shift scores across testing sessions were calculated using a cross-correlation method (Taube and Burton, 1995). This approach involves shifting the firing rate vs. HD function of the first session in 6° increments while correlating this shifted function with the nonshifted function from the other session. The amount of shift required to produce the maximal Pearson r correlation between the two sessions is defined as the angular shift score between the sessions. These values were then subjected to Rayleigh tests (Batschelet, 1981) to determine if the scores were clustered randomly or if the preferred directions tended to shift in the same direction and amount. The Rayleigh test computes a mean vector length (r) for the distribution of angular shift values. This r value represents the variability in the shift angles for the group with values of 1.0 indicating an absence of variability. Independent sample t tests were utilized for group comparisons of the basic directional characteristics and absolute angular shift scores produced during the different test sessions (Tabachnick and Fidell, 2007).
Histological Analysis
At the completion of the experiment, animals were deeply anesthetized with sodium pentobarbital and a small anodal current (20 μA, 10 s) was passed through 1–4 wires to conduct a Prussion blue reaction. The rats were then perfused intracardially with saline followed by 10% formalin solution. Each brain was removed from the skull and was postfixed in a 10% formalin solution containing 2% potassium ferrocyanide for at least 24 h. The brains were then cryoprotected in a 20% sucrose solution for 24 h, and were then frozen and cut coronally in 30-μm sections with a cryostat. Sections taken through the ADN and MEC were mounted on glass microscope slides, stained with thionin, and examined under light microscopy to determine the location of recording sites and evaluate the lesions.
To quantify the extent of the neurotoxic lesions, digital images were taken of every third slice through the caudal to rostral extent of the entorhinal cortex, which is roughly −8.8 to −5.6 mm relative to bregma (Paxinos and Watson, 1998). From these images, unfolded maps of the entorhinal cortex were produced for control and lesioned animals (Insausti et al., 1997; Dolorfo and Amaral, 1998a; Steffanach et al., 2005). Briefly, the medial-lateral length of the EC was measured in each section and was unfolded and stacked using the lateral border as an alignment point (Fig. 4). Measurements were made using Image-J software (http://rsb.info.nih.gov/ij/index.html). The MEC and lateral entorhinal cortex were differentiated based on previously described cytoarchitectural differences. The lateral entorhinal cortex is defined by a relatively cell-free zone between Layers II and III, whereas, in the MEC this zone is not clearly distinguishable (Dolorfo and Amaral, 1998b; van Groen, 2001). The extent of damaged entorhinal tissue for each lesioned animal was mapped onto the average unfolding of the entorhinal cortex from five control animals (Fig. 4A). Tissue was considered lesioned if it contained very few healthy neurons. When the lesions crossed cytoarchitectural-defined boundaries within the entorhinal cortex, we estimated the boundaries based on comparable sections in control animals.
FIGURE 4.
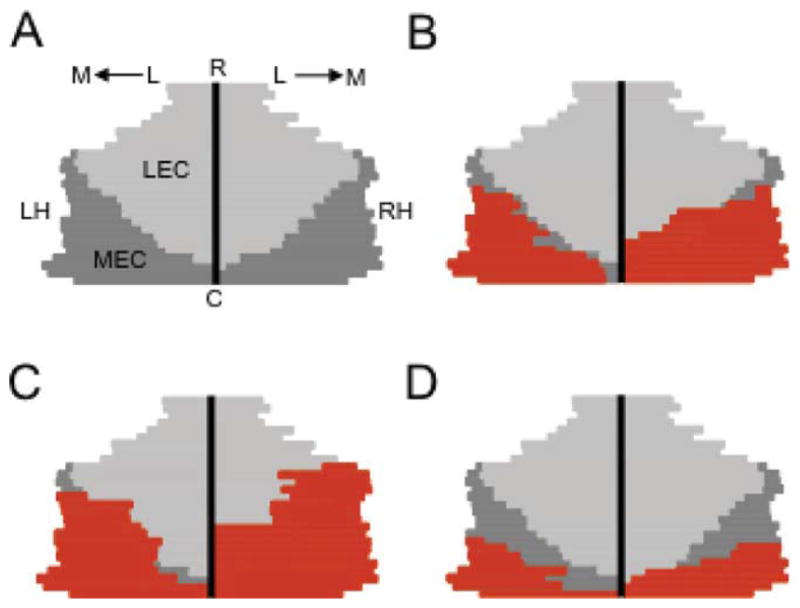
(A) Average unfolded map for control animals. Briefly, to construct each map, the medial-lateral length of the entorhinal cortex was measured in each brain section and was straightened along the vertical black bar in the center of the diagram, which represents the lateral border. The dark and light gray regions represent the unfolded MEC and lateral entorhinal cortex (LEC), respectively. L, lateral; M, medial; LH, left hemisphere; RH, right hemisphere; R, rostral; C, caudal. (B) Unfolded map showing the lesion extent (red) of a rat with a representative lesion (size of MEC lesion = 84.2%). (C) Unfolded map showing the lesion extent of the animal with the largest MEC lesion (96.1%). (D) Unfolded map showing the extent of the smallest lesion (46.5%). Note that lesions generally covered large portions of the caudal MEC, especially the caudal-medial portions, which contains a large proportion of grid cells (Hafting et al., 2005; Sargolini et al., 2006).[Color figure can be viewed in the online issue, which is available at wileyonlinelibrary.com.]
RESULTS
Lesions of the Medial Entorhinal Cortex
Figure 3 shows representative sections from control and MEC lesioned rats at two rostral-caudal levels. In general, neurotoxic lesions of the MEC were significantly large and typically included all cell layers. Of the 16 rats that received NMDA lesions, 3 were largely unilateral, and were therefore removed from further analysis. An additional three rats were removed from the lesion group because the electrode arrays completely missed the ADN. The electrode arrays were judged to have completely advanced through the ADN in the remaining 10 animals. Figure 4A shows the average unfolded map for the control group, and Figure 4B displays the lesion extent for an animal with a representative lesion. Figures 4C,D show animals with the largest and smallest lesions, respectively. Overall, lesion volumes ranged from 46.5 to 96.1% (mean and standard error of mean (SEM) from unfolded maps: 77.4% ± 5.01%). Seven rats had at least 80% of their MEC damaged, and three had lesion volumes of 46.5, 54.6, and 71.4%. Despite the smaller lesions in the latter three animals, each rat had significant damage to their caudal MEC, especially the dorsal-medial MEC (Fig. 4D), which as mentioned earlier, contains a high proportion of sharply tuned grid cells, HD cells, and border cells (Hafting et al., 2005; Sargolini et al., 2006; Solstad et al., 2008). Thus, spared MEC tissue was generally restricted to the rostral and rostral-lateral MEC. Because a recent report indicates that the rostral or ventral MEC also contains neurons with broad periodic firing fields (Brun et al., 2008b), we compared the rats with the three smallest lesions, which also had the most sparing in rostral MEC, to animals with larger lesions for each parameter in the study.
FIGURE 3.

(A) Representative sections from control (left panel) and MEC lesioned (right panel) animals at the caudal pole of the entorhinal cortex, ~ −8.8 mm relative to bregma (middle panel from Paxinos and Watson, 1998). Arrows denote borders between the MEC and parasubiculum (PaS) and between the MEC and overlying cortex (visual cortex, VC; rhinal cortex, RC). The dashed outline in the section of the lesioned rat (right panel) represents unhealthy tissue. Notice that the lesion extended into the adjacent PaS as well as the overlying cortex (marked by asterisk). (B) High magnification images of the MEC regions marked by the small boxes in A. Notice the general absence of large neurons and the large number of glial cells in the lesioned animal (right panel), indicating that the lesion was large at this level. (C) Representative sections from control (left panel) and MEC lesioned (right panel) rats at −7.8 mm relative to bregma (middle panel, Paxinos and Watson, 1998). The arrows mark the boundaries between the lateral entorhinal (LEC) and MEC, as well as the boundaries between the MEC and PaS. Notice that the lesion included a little over half of the MEC and extended medially into the PaS (marked by top asterisk). Thus, spared tissue was largely confined to the lateral portions of the MEC (marked by bottom asterisk).
In addition to the damage created in the MEC, neurotoxic lesions frequently produced unintentional damage to the overlying visual cortex and parts of the postrhinal cortex around the syringe tracks (Fig. 3A right), and in most cases included small portions of the lateral entorhinal cortex. Nonetheless, additional damage to these structures did not exceed 20% of their total volume, and was mostly restricted to caudal regions. Unintentional damage was also observed in the subiculum (n = 3) and the adjacent ventral presubiculum (n = 2) and para-subiculum (n = 7). There was no evidence of damage to the postsubiculum in any of the animals. Of the three cases with subiculum damage, the lesions were small, unilateral, and restricted to the syringe tracks near the caudal end of the structure (between −7 and −7.3 mm relative to bregma). Thus, lesions to the subiculum did not constitute more than 20% of its total volume. In the two cases with ventral presubiculum damage, the lesions occurred between −7.0 and −7.3 mm relative to bregma and were mostly unilateral, accounting for less than 20% of its total volume. Of the seven cases with parasubiculum damage, two had small lesions (<10%), but in the other five animals, parasubiculum damage was extensive, approaching ~ 50% of its total volume (e.g., Fig. 3). Because of the large amount of parasubicular damage in these five animals, and because this region has been linked to spatial processing (Taube, 1995b; Liu et al., 2001; Hargreaves et al., 2005; Solstad et al., 2008; Boccara et al., 2010), we compared this subgroup with the remaining animals.
Overview of Neural Activity
A total of 89 cells were isolated within the dorsal-ventral extent of the ADN in the MEC lesioned group. Forty-four of these cells were identified as HD cells, and the remaining cells had nondeterminable correlates. In general, lesioned animals displayed a wide range of incidence rates of HD cell activity in their ADN (9.1–72.7%), however, there was no evidence of a significant difference in the mean percentage of HD cells recorded in control (mean ± SEM = 50.7% ± 4.91%) and lesioned animals (48.3% ± 6.1%; t(24) = −0.298, P = 0.77). The mean percentage of isolated HD cells did not differ significantly between the subgroup of rats with additional parasubiculum damage (42.2% ± 8.46%) and the remaining rats (54.4% ± 8.87%; t(8) = −1.00, P = 0.35). There was a trend for lower HD cell percentages in animals with large lesions, but this trend did not reach a significant difference (small lesion: 56.7% ± 8.4%; large lesion: 44.7% ± 8.0%; t(8) = 0.89, P = 0.40). Taken together, these results suggest that MEC lesions do not alter the proportion of HD cells within the ADN.
Basic HD Cell Characteristics
Thirty-two of the 44 HD cells observed in the lesioned group were considered to be well-isolated from background noise during the Standard 1 session and were therefore included in the analysis of basic directional properties. Table 2 shows the mean and SEM for each measure for the control and lesion groups, as well as each lesion subgroup. In general, there were no obvious differences between MEC lesioned and control animals for measures of peak firing rate, directional firing range, background firing rate, and information content. This observation was confirmed by nonsignificant mean comparisons conducted on each parameter [t(75) = 1.53, −1.86, 1.65, and 0.80 for peak firing rate, background firing rate, directional firing range, and information content, respectively; P > 0.05]. Moreover, mean comparisons failed to indicate an influence of additional PaS damage [t(30) = 1.12, 0.21, 0.71, and −0.29; P > 0.05] or the size of the MEC lesion [t(30) = 1.86, 0.001, 1.54, and 0.67; P > 0.05]. Lesions of the MEC, however, increased the time by which HD cells anticipate future HDs (see Table 2). Indeed, the mean ATI for the MEC lesion group more than doubled the mean displayed by control cells [t(68) = 4.63, P < 0.001]. Further analysis failed to indicate a significant influence of additional PaS damage [t(29) = 0.08, P = 0.935] or the size of MEC damage [t(29) = −1.45, P = 0.16] on ATI values. Nevertheless, there was a general trend for HD cells in the small lesion group to have lower ATI values compared to the large lesion subgroup. Regardless, the anticipation displayed by cells in the small lesion group was still significantly greater than control animals [t(48) = 2.36, P = 0.02], suggesting that spared tissue in the ventral MEC is not sufficient for the display of normal ATIs in the ADN. Figure 5 shows the distribution of ATI values for MEC lesion and control animals, as well as the small and large lesion subgroup.
TABLE 2.
Mean and SEM for Basic Directional Parameters for Control, MEC Lesion, and Lesion Subgroups
| Parameter | Control | MEC lesion | Small MEC lesion | Large MEC lesion | PaS lesion | No-PaS lesion |
|---|---|---|---|---|---|---|
| Peak firing rate (spikes s−1) | 44.0 ± 3.1 | 50.9 ± 3.3 | 58.5 ± 4.8 | 46.4 ± 4.1 | 55.3 ± 5.5 | 47.9 ± 3.9 |
| Background firing rate (spikes s−1) | 1.64 ± 0.21 | 1.11 ± 0.17 | 1.11 ± 0.26 | 1.11 ± 0.24 | 1.16 ± 0.26 | 1.08 ± 0.24 |
| Directional firing range (°) | 98.8 ± 3.8 | 107.6 ± 3.5 | 114.3 ± 6.9 | 103.6 ± 3.5 | 110.9 ± 6.5 | 105.5 ± 3.9 |
| Information content (bits/spike) | 1.30 ± 0.09 | 1.41 ± 0.11 | 1.51 ± 0.18 | 1.36 ± 0.63 | 1.38 ± 0.17 | 1.44 ± 0.15 |
| ATI (ms) | 27.2 ± 8.4 | 76.8 ± 5.8* | 65.7 ± 7.2 | 90.0 ± 7.9 | 77.4 ± 9.7 | 76.4 ± 7.4 |
P < 0.001 between control and MEC lesioned rats.
FIGURE 5.
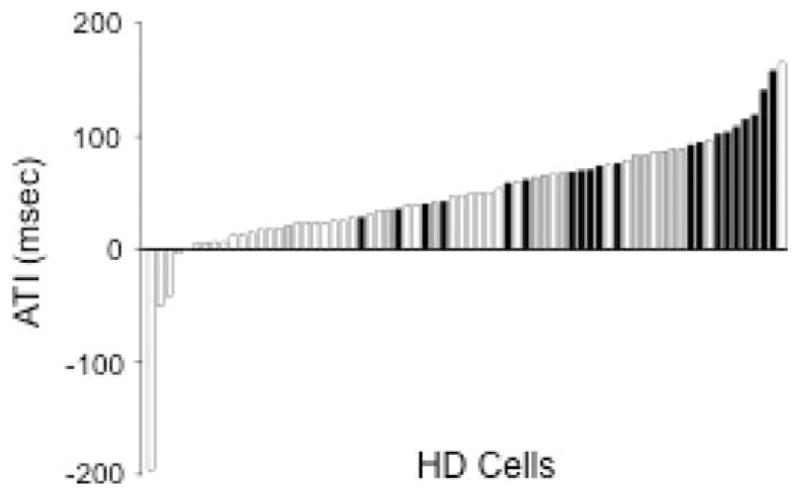
Distribution of ATI values (msec) for HD cells recorded in control (white bars) and MEC lesioned animal (small lesion: gray bars; large lesion: black bars). Note that many of the HD cells from lesioned rats have greater ATI values than those recorded in control animals. Also notice the trend for greater ATIs in animals with large lesions.
Because previous work has shown that anticipation by ADN HD cells increases linearly as a function of angular head velocity (Taube and Muller, 1998), one possible explanation for the group differences in ATIs may be that MEC lesions alter the speed by which the rats move their head. To investigate this possibility, we computed the mean instantaneous angular head velocity during the Standard 1 session for each cell in the control and lesion group (except for the cells that were excluded from the ATI analysis because of poor CW or CCW sampling). In general, mean angular head velocities did not differ significantly between the control [(40.0 ± 1.87)° s−1] and MEC lesion groups [(37.0 ± 2.46)° s−1; t(68) = −0.970, P = 0.34]. Furthermore, there was no significant influence of the additional parasubiculum damage [lesion: (36.9 ± 2.7)° s−1; no lesion: (37.1 ± 3.7)° s−1; t(29) = −0.047, P = 0.96], or the size of the MEC lesion [small: (31.5 ± 2.4° s−1; large: 40.0 ± 3.4° s−1; t(29) = −1.70, P = 0.10]. These results suggest that changes in the speed of head movements do not account for the greater ATIs observed in lesioned rats.
To summarize, lesions of the MEC did not have a significant impact on most HD cell properties, suggesting that the MEC plays a limited role in processing the HD cell signal within the ADN. The results, however, indicate that MEC lesions produce a general increase in the time of anticipation. One possible explanation for this effect is that the MEC functions as an ATI reducer by informing the HD circuit about current HD using environmental landmarks. This possibility is consistent with the position of the MEC in the landmark-processing stream of the HD cell circuit (Fig. 1). Moreover, on average, the ATI values reported in the present study are similar to previous experiments in which other portions of the landmark-processing stream are damaged (i.e., retrosplenial cortex lesions: Clark et al., 2010; postsubiculum lesions: Goodridge and Taube, 1997). Whether MEC lesions alter ATIs because of poor landmark control is investigated in the following section.
Landmark Rotation and Return
To determine whether MEC lesions disrupted landmark control over ADN HD cells, cell activity was monitored after the white cue card was rotated 90° CW or CCW along the wall of the recording chamber. A total of 28 HD cells from MEC lesioned animals and 19 from control animals were recorded during these sessions. The results are presented in circular histograms in Figure 6A showing the amount of angular shift in the preferred firing direction between the Standard 1 and Rotation sessions for control (left panel) and MEC lesioned animals (right panel). In general, HD cells in control animals rotated in the same direction and angular distance as the cue card, suggesting strong control by the landmark. Similarly, HD cells recorded in MEC lesioned rats displayed a significant amount of landmark control by the white cue card. Rayleigh tests confirm these observations by indicating that angular shift values were significantly clustered around 90° for both lesion and control groups (control: r = 0.95, P < 0.001; MEC lesion: r = 0.95, P < 0.001). It is noteworthy, however, that compared to control animals, several HD cells in the lesioned group under-rotated >18° (control: 3 out of 19; MEC lesion: 14 out of 28; (χ2(1) = 5.74, P = 0.02), suggesting a mild influence of the MEC lesion. This difference is reflected in a significant mean comparison on measures of angular deviation from the expected 90° shift (control: 15.2° ± 2.73°; MEC lesion: 25.5° ± 2.81°; t(45) = 2.53, P = 0.02). Further analysis did not indicate a significant influence of additional parasubiculum damage (lesion: 24.0° ± 3.3°; no lesion: 27.0° ± 4.6°; t(26) = −0.53, P = 0.60), or a general influence of lesion size (small: 28.4° ± 3.8°; large: 23.6° ± 3.9°; t(26) = 0.82, P = 0.42). We did notice, however, that HD cells recorded in the small lesion group underotated more frequently than cells recorded in the large lesion subgroup (7 out of 17 sessions vs. 7 out of 11 sessions for large and small lesion subgroups, respectively; see Fig. 6A, right panel). Representative firing rate × HD plots for cells recorded in lesioned animals are shown in Figure 7.
FIGURE 6.
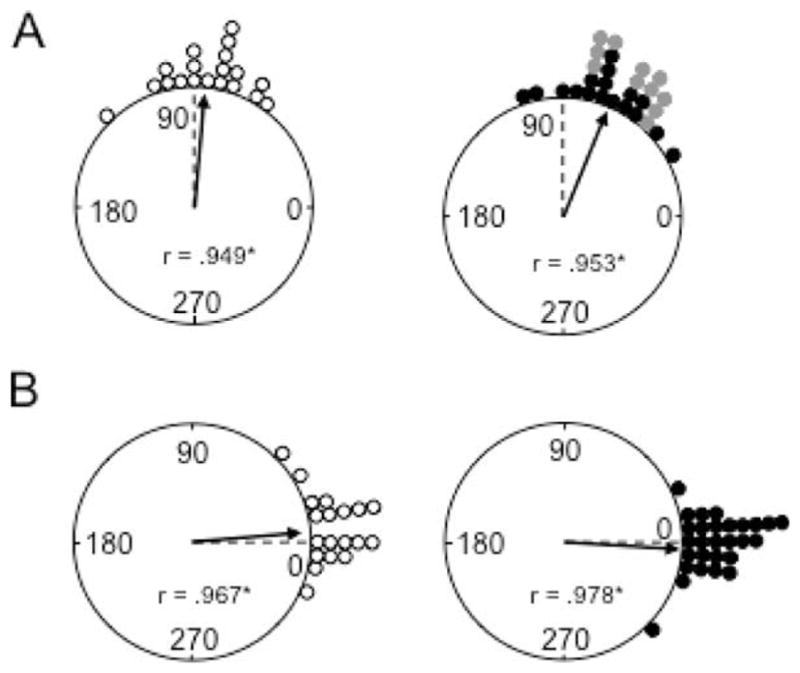
(A) Polar plots showing the angular shift in the preferred firing direction between the Standard 1 and Rotation sessions for control (left panel) and MEC lesioned (right panel) rats. Each dot on the periphery represents the magnitude of the shift in the preferred firing direction for one HD cell. The arrows denote the observed mean vector angle and the broken line denotes the expected 90° vector if the angular shift values are perfectly predicted by the cue card. Mean vector length values (r) are indicated within the plot and are depicted by the length of the arrow. The length of r represents the variability in the shift angles for the group, with values of 1.0 falling on the circle and indicating an absence of variability. Asterisks mark r values that tested significantly nonrandom as indicated by the Rayleigh test (*P < 0.001). Note that the shifts for both groups are distributed nonrandomly; however, there was a tendency for under-rotation in the lesioned group. Also note that under-rotation was more frequent in the subgroup with small MEC lesions (gray dots). (B) Polar plots showing the angular shift in the preferred firing direction between the Standard 1 and 2 sessions for control (left panel) and MEC lesioned (right panel) rats. The 0° point indicates the expected vector if the shift values are perfectly predicted by the cue card position. Note that the shifts for both groups are distributed non-randomly and are concentrated around 0°.
FIGURE 7.

Representative firing rate × HD tuning curves for HD cells from MEC lesioned rats during the landmark rotation and return series. Each panel depicts an HD cell recorded from different lesioned animals with similar lesion sizes (>80%). The black line in each plot indicates the Standard 1 session, the gray lines represent the Rotation session, and the red lines indicate the Standard 2 sessions. The dashed vertical line in the plot shows the expected HD if cell tuning is perfectly predicted by cue card rotation. The top panel depicts an HD cell in a lesioned animal that under-rotated in response to a CW cue card rotation; however, control over this cell’s preferred direction was strong when the cue card was returned to its original position in the Standard 2 session. The middle and bottom panels depict sessions in which HD cell tuning in lesioned animals was strongly controlled by a CCW rotation of the cue card. [Color figure can be viewed in the online issue, which is available at wileyonlinelibrary.com.]
The results above indicate that MEC lesions had a rather mild influence on landmark control of HD cells, although there was a tendency for HD cells to under-rotate their preferred directions in response to cue card rotations. We speculated earlier that poor spatial updating by landmarks might have influenced the results of the ATI analysis, which indicated that MEC lesions increase anticipation of future HDs. To test the relationship between the ATI and landmark control, we compared the ATI values for sessions in which HD cells showed under-rotation (>18°) with the ATI values from sessions in which cue card control was reasonably good (<18°). It was reasoned that if increased anticipation reflects poor spatial updating by landmarks, then cells that showed poor landmark control should also demonstrate larger ATI values. On average, ATI values did not differ significantly between the under-rotation group and the group that showed relatively normal cue control (t(21) = −0.755, P = 0.46). In fact, there was a trend toward lower ATI values in the under-rotation group (66.0 ± 14.0 ms) compared to the normal rotation group (79.1 ± 9.6 ms), which likely reflects the greater number of under-rotation sessions contributed by the small lesion subgroup. In sum, this result suggests that the increased ATI in the MEC lesioned group is not likely related to weakened landmark control.
In the Standard 2 sessions, landmark control was tested again by returning the white cue card to its original angular position in the cylinder. It was hypothesized that if the cue card had significant control over HD cell orientation, the difference in preferred direction shift between Standard 1 and 2 should be near 0°. Indeed, Figure 6B plots this data in circular histograms and shows that for both control and lesioned groups, angular shift values clustered significantly around 0° (control: r = 0.97, P < 0.001; MEC lesion: r = 0.99, P < 0.001). A t test did not indicate a significant difference between the two groups on measures of angular deviation from the expected 0° (control: 11.7° ± 2.57°; MEC lesion: 8.57° ± 1.65°; t(45) = −1.07, P = 0.29). Moreover, there was no significant influence of additional parasubiculum damage (lesion: 7.29° ± 1.69°; no lesion: 9.86° ± 2.86°; t(26) = −0.78, P = 0.45), or an influence of lesion size (small: 9.27° ± 1.87°; large: 8.12° ± 2.46°; t(26) = 0.34, P = 0.74). In sum, these results suggest that animals with MEC lesions were capable of accurately updating HD cell orientation based on landmark information. Because this observation conflicts with the mild impairment observed during the initial cue card rotation session, it was of interest to monitor the influence of the cue card in subsequent tests. Thus, landmark control was further evaluated during the Standard 3 sessions and in the dual-chamber task. However, we first investigated whether MEC lesions disrupt spatial updating using self-generated idiothetic cues.
Dark Test
The recent discovery of grid cells in the dorsal-caudal MEC has stimulated the theoretical view that the MEC is a key component of a neural circuit devoted to the integration and updating of idiothetic information to determine spatial location over time, a process referred to as path integration (Hafting et al., 2005; Fuhs and Touretzky, 2006; McNaughton et al., 2006). To determine whether MEC lesions disrupt the normal processing of idiothetic information in the HD cell circuit, we monitored HD cell activity while rats foraged in the cylinder without the cue card present and with the room lights turned off (control: n = 19; MEC lesion: n = 22). It was predicted that if MEC lesions impaired idiothetic processing, then the preferred directions of HD cells in the lesioned group should demonstrate a greater magnitude of drift while foraging in darkness. We tested this prediction by calculating the mean absolute shift in the preferred direction between sequential 1-min epochs for each cell in each group (i.e., the mean change in preferred direction between 0–1 min and 1–2 min, between 1–2 min and 2–3 min, etc.). This analysis indicated that the drift was relatively slow for control animals (range: 5.1 to 26.6° min−1), and was mildly faster for MEC lesioned animals (range: 4.7 to 52.0° min−1). Roughly half of the cells in each group drifted >18° min−1 (MEC: 10 of 22 cells; control: 8 of 19 cells; χ2(1) = 0.046, P = 0.83), and mean comparisons did not indicate a significant group difference [control: (16.5 ± 1.2)° min−1; MEC lesion: (20.7 ± 2.4)° min−1; t(30.3) = 1.59, P = 0.12]. Moreover, there was no evidence for a significant influence of additional parasubiculum damage [lesion: (18.2 ± 2.8)° min−1; no lesion: (23.3 ± 3.8)° min−1; t(20) = −1.09, P = 0.29], or an influence of lesion size [small: (23.3 ± 4.2)° min−1; large: (18.6 ± 2.6)° min−1; t(20) = 0.969, P = 0.34].
We also measured preferred direction stability by constructing HD × time plots for each HD cell recorded in control and lesion groups (Clark et al., 2009, 2010; Yoder and Taube, 2009). Figure 8A shows representative HD × time plots for individual HD cells recorded in each group. Each circle in the plots represents the animal’s HD and time in which the cell fired at a rate ≥50% of its peak firing rate (peak firing rate obtained from the overall firing rate × HD plot). Overall, HD cells in lesioned and control animals demonstrated peak firing rates clustered within a narrow range of directions throughout the 8-min recording session, suggesting that MEC lesions did not impair preferred direction stability in rats. To quantify this observation, we compared the angular deviation for peak firing rate points in each HD × time plot (Fig. 8B). A mean comparison conducted on these measures failed to indicate significant group differences [control: 31.2° ± 2.4°; MEC lesion: 30.3° ± 1.5°; t(39) = −0.312, P = 0.76]. Moreover, a follow-up analysis did not reveal a significant influence of lesion size [small: 29.0° ± 1.81°; large: 31.4° ± 2.37°; t(20) = −0.771, P = 0.45] or additional damage to the parasubiculum [lesion: 28.5° ± 1.8°; no lesion: 32.1° ± 2.4°; t(20) = −1.20, P = 0.24].
FIGURE 8.

(A) HD × time plots for representative examples of individual cells recorded in control (top panel) and MEC lesioned (bottom panel) rats during the 8-min dark test. Each dot depicts when the HD cell fired ≥50% of its maximum firing rate (as measured from the entire 8-min session). Sampling resolution was 1 s. For cells in both groups, preferred directions showed brief periods of drift in darkness; however, cells in both groups generally fired within a narrow range of directions. (B) Distribution of the angular deviation for the preferred directions in the HD × time plots for cells recorded in control (white bars) and MEC lesioned (black bars) groups during the dark test. Notice that angular deviation values are similar for both groups of animals.
Collectively, the results above indicate that MEC lesions have very little influence on HD cell stability in darkness, suggesting that idiothetic-based processing by ADN HD cells occurs independently of the MEC. Alternatively, it is possible that behavioral differences may explain the absence of group differences. For instance, because the accuracy of path integration can degrade over time through the accumulation of integration error (Séguinot et al., 1993; Etienne et al., 2004), it is possible that lesioned rats taxed their angular path integrator less than control animals by making fewer changes in their head direction as well as making fewer movements throughout the cylinder. To address this possibility, we measured the number of head turns, angular head velocity, and cumulative distance traveled by rats during each dark session and found no significant group differences for each measure (cumulative distance: t(39) = 0.017, P = 0.99; number of head turns: t(39) = 0.090, P = 0.93; angular head velocity: t(39) = −0.549, P = 0.59). Indeed, rats in both groups walked a similar distance (control: 4197.9 ± 291.3 cm; MEC lesion: 4205.0 ± 302.9 cm), made a similar number of head turns (control: 183.9 ± 12.2; MEC lesion: 185.3 ± 8.60), and moved their heads at the same angular head velocity (control: 41.9 ± 2.82; MEC lesion: 40.0 ± 2.18), suggesting that behavioral differences cannot account for the results of the dark test.
Finally, it is important to consider the possibility that HD stability in the dark test does not exclusively reflect accurate idiothetic processing because rats may have access to uncontrolled sources of external stimuli. For example, lesioned rats may have utilized odors from urine markings or boli on the floor and walls of the cylinder to maintain HD cell orientation. We cannot exclude this possibility entirely; however, it is important to mention that the magnitude of preferred direction drift, as measured by the angular deviation in the HD × time plots above, was positively correlated with the number of head turns made by the animal (MEC lesion: r = 0.377, P = 0.04; control: r = 0.348, P = 0.07). There was no noticeable relationship between the direction of preferred direction drift and the number of head turns in CW vs. CCW directions. For instance, in four sessions in which preferred directions drifted steadily in the CW direction, rats made roughly 50% more head turns in the CW direction in two sessions, and 50% more CCW head turns in the other two sessions.
The positive relationship between head turns and the magnitude of preferred direction drift suggests that angular path integration may have been at least partially responsible for preferred direction stability in darkness. Nevertheless, because of the potential influence of uncontrolled landmarks, we conducted a more rigorous test of angular path integration using the dual-chamber apparatus. However, before presenting this task, we first tested whether both groups of rats could use the cue card to reorient after drifting in the dark-test (see below).
Standard 3 (Landmark Returned/Room Light Turned-On)
After the 8-min dark test, the room lights were turned back on and the white cue card was returned to its original angular position within the cylinder. To determine whether the preferred directions of HD cells maintained their orientation between Standard 2 and 3 sessions, we measured the amount of angular shift between the two sessions for each HD cell in each group (control: n = 18; MEC lesion: n = 20). Figure 9 displays this data for control (left panel) and MEC lesion (right panel) groups. Rayleigh tests indicate that angular shift values were significantly clustered around 0° for both groups (control: r = 0.88, P < 0.001; MEC lesion: r = 0.94, P < 0.001), suggesting that HD cells generally maintained their orientation between Standard 2 and 3 sessions. Further supporting these observations, mean comparisons on the absolute angular shift values did not indicate a significant difference between the groups (control: 19.7° ± 5.94°; MEC lesion: 13.5° ± 3.66°; t(36) = −0.903, P = 0.37). Furthermore, there was no evidence of an influence of additional parasubiculum damage (lesion: 15.3° ± 6.4°; no lesion: 11.3° ± 2.5°; t(18) = 0.525, P = 0.61), as well as no evidence of a significant influence of lesion size on angular shift values (small: 16.8° ± 6.9°; large: 10.2° ± 2.5°; t(18) = 0.896, P = 0.38). Collectively, these results indicate that MEC lesions did not impair the ability to maintain HD cell orientation across the Standard 2 and 3 sessions, suggesting that both groups of animals were able to use the cue card to reorient after drifting in the dark test. This finding is consistent with the results of the landmark return test reported above.
FIGURE 9.
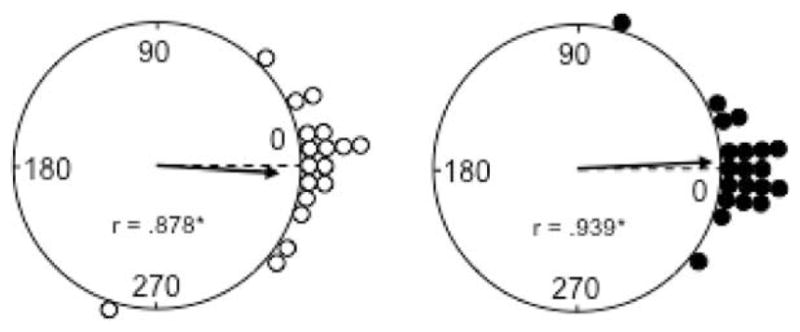
Polar plots showing the angular shift in the preferred firing direction between the Standard 2 and 3 sessions for control (left panel) and MEC lesioned (right panel) rats. The 0° point indicates the expected vector if the cells preferred firing directions are maintained across sessions. Note that for both groups, the angular shift values are clustered around 0° and are distributed nonrandomly (*P < 0.001). Circles represent vector length values = 1.
Dual-Chamber Apparatus
To further test whether MEC lesions disrupt angular path integration, we assessed the stability of HD cell tuning in the dual-chamber apparatus as animals locomoted from a familiar environment to a novel one. A total of eight HD cells from the MEC lesion group and eight from the control group were monitored. In general, cells from the control group exhibited largely stable preferred firing directions when locomoting from the familiar cylinder to the novel rectangular environment, suggesting that control rats utilized idiothetic cues to maintain orientation across the environments. Similarly, HD cells from MEC lesioned rats largely maintained their preferred direction across the environments, indicating that MEC lesions spare idiothetic cue processing in ADN HD cells. These observations are clearly illustrated in the polar plots showing the angular shift in the preferred firing direction between the cylinder and rectangle sessions (Fig. 10A). Indeed, only two out of the eight cells in the lesion group shifted outside of the range of the control group. Rayleigh tests indicate that the angular shift values were significantly clustered around 0° for both control and lesion groups (control: r = 0.98, P < 0.001; MEC lesion: r = 0.93, P < 0.001). Moreover, mean comparisons failed to indicate significant differences between the lesion and control groups on measures of absolute angular shift (control: 10.5° ± 3.54°; MEC lesion: 20.3° ± 4.53°; t(14) = 1.70, P = 0.11). Follow-up analysis did not indicate a significant influence of additional parasubiculum damage (lesion: 18.0° ± 6.48°; no lesion: 22.5° ± 7.09°; t(6) = −0.47, P = 0.66), or an influence of lesion size (small: 24.0° ± 6.93°; large: 18.0° ± 6.29°; t(6) = 0.61, P = 0.56). Figure 11 presents representative HD cells from the lesion group showing the stability of the preferred directions across the two enclosures.
FIGURE 10.
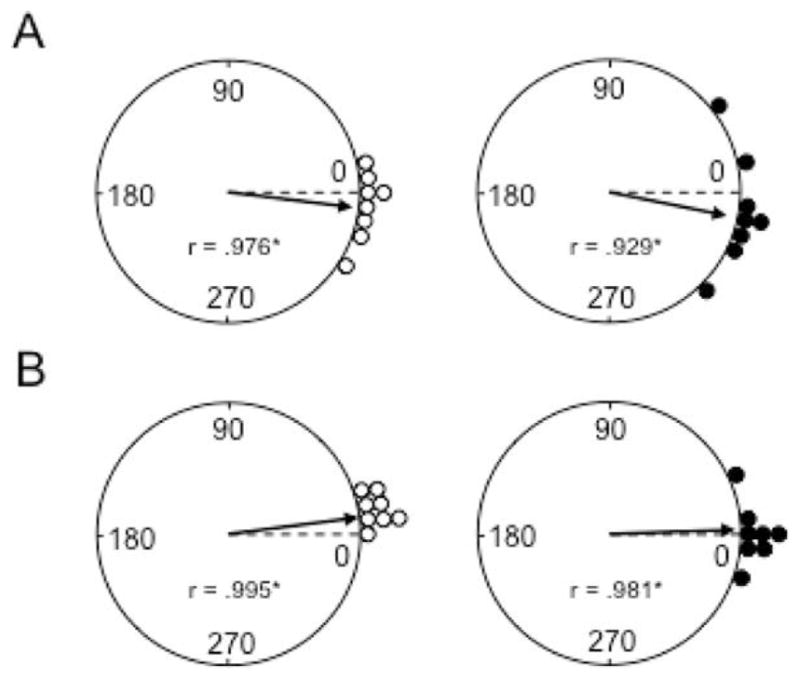
(A) Polar plots showing the angular shift in the preferred directions between the Cylinder 1 and Rectangle sessions of the dual-chamber task for control (left panel) and MEC lesioned (right panel) rats. The broken line at 0° indicates the expected vector if the preferred directions of cells are maintained across sessions. Notice that the angular shift values for both groups are clustered around 0° and are distributed nonrandomly (*P < 0.001). (B) Polar plots showing the angular shift in the preferred firing direction between the Cylinder 1 and 2 sessions for control (left panel) and MEC lesioned (right panel) rats. Again, the broken line at 0° points to the expected vector if the angular shift values maintain their orientation between session. Note that the angular shifts are clustered around 0° and are distributed nonrandomly (*P < 0.001). Circles represent vector length values = 1.
FIGURE 11.

Representative firing rate x HD tuning curves for HD cells from MEC lesioned rats recorded during the dual-chamber test. Each panel depicts an HD cell recorded from different lesioned animals with similar lesion sizes (>80%); however, the cell depicted in the bottom plot was recorded in an animal with additional parasubiculum damage. The black lines in each plot indicate the Cylinder 1 session, the gray lines represent the rectangle session, and the red lines indicate the Cylinder 3 sessions. Note that cells from lesioned rats maintain a similar preferred direction during the transitions between the cylinder and rectangle environments. [Color figure can be viewed in the online issue, which is available at wileyonlinelibrary.com.]
To determine whether the preferred directions of HD cells could return to the orientation established during the original cylinder session (Cylinder1), the rats were allowed to walk back from the rectangular compartment to the familiar cylinder. Figure 10B presents the angular shift in preferred directions between the original and return cylinder sessions. Rayleigh tests indicated that angular shift values were significantly clustered around 0° for both control and MEC lesion groups (control: r = 0.99, P < 0.001; MEC lesion: r = 0.98, P < 0.001), suggesting that HD cells generally returned to their orientation established in the Cylinder 1 session. Mean comparisons on the absolute angular shift failed to indicate significant group differences (control: 9.75° ± 2.25°; MEC lesion: 7.50° ± 3.16°; t(14) = −0.50, P = 0.57). Again, subsequent analysis failed to indicate a significant influence of additional parasubiculum damage (lesion: 1.50° ± 1.50°; no lesion: 13.5° ± 4.50°; t(3.66) = −2.53, P = 0.07), or a general influence of lesion size (small: 6.00° ± 6.00°; large: 8.40° ± 4.07°; t(6) = −0.34, P = 0.74).
To summarize, the results of the dual-chamber apparatus indicate that MEC lesions do not impair the stability of HD cell preferred directions when locomoting between familiar and novel enclosures. This result provides additional evidence that idiothetic processing by ADN HD cells is largely independent of the MEC. In addition, these results demonstrate that MEC lesioned rats are capable of reorienting to their original preferred orientation when returning to the cylinder (Cylinder 2 session), and provides further confirmation that the MEC plays a limited role in anchoring the HD cell system to environmental landmarks.
DISCUSSION
Our findings support two general conclusions regarding the influence of the MEC on the HD cell circuit. First, several results strongly suggest that the MEC plays a minimal role in forming associations between the HD cell circuit and environmental landmarks. Specifically, in the landmark rotation series, all of the HD cells in lesioned rats shifted their preferred directions in the same direction as the cue card (Fig. 6A), and when the cue card was returned to its original orientation, the preferred directions returned to their original orientation (Figs. 6B and 7). In addition, HD cells in lesioned rats maintained their preferred directions between the Standard 2 and Standard 3 sessions despite drifting in darkness (Fig. 9), and returned to their original orientation after returning to the cylinder in the dual-chamber test (Figs. 10B and 11). A second general conclusion is that the MEC does not contribute to idiothetic processing within the HD cell circuit. Strong support for this conclusion comes from the dark test, which demonstrated that HD cells in lesioned animals had relatively stable preferred firing directions during an 8-min session in darkness (Fig. 8). Moreover, HD cells in lesioned rats maintained their preferred directions when locomoting into a novel environment (Figs. 10A and 11), suggesting that the animals could use idiothetic cues in the absence of familiar stimuli. Taken together, these findings suggest that the MEC has a limited role in processing the limbic HD cell signal.
All animals in the lesion group had significant damage to the dorsal-medial MEC, but spared tissue was generally found in the rostral and rostral-lateral portions of the MEC, especially in rats in the small lesion subgroup. Although it is possible that sparing in the rostral MEC may have contributed to the present findings, we think that this possibility is unlikely for three reasons. First, in the present study, there was no trend for weaker landmark control or impaired angular path integration in the rats with the largest MEC lesions. Second, anatomical studies report that the rostral MEC has fewer connections with brain regions involved in visual-spatial processing (Burwell, 2000; Kerr et al., 2007). Moreover, a recent study indicates that direct projections from the rostral and lateral portions of the MEC to the HD cell circuitry, specifically to the retrosplenial cortex, are relatively sparse compared to the caudal MEC (Agster and Burwell, 2009). Finally, consistent with anatomical research, behavioral studies show that lesions or inactivation of the rostral MEC generally fail to impair spatial learning, whereas lesions or inactivation of the caudal MEC produce impairments in navigation (Steffenach et al., 2005; Gaskin and White, 2007), suggesting a greater role for the caudal MEC in spatial processing.
The failure to observe impairments in landmark control after MEC lesions is surprising given the fact that the entorhinal cortex receives information from the ventral visual pathway, which is thought to be essential for object recognition and visual-spatial processing (Knierim et al., 2006; Manns and Eichenbaum, 2006; Eichenbaum and Lipton, 2008). It is possible; however, that other pathways stemming from this processing stream bypass the MEC and project directly to HD cell circuitry. For instance, one area within the ventral visual stream that projects directly to HD cell circuitry is the postrhinal cortex. This region is of particular interest because it has been linked to contextual information processing in rats (Burwell et al., 2004), which is likely important for landmark learning. Moreover, in humans, functional neuroimaging studies have shown that the homologous region, frequently called the parahippocampal place area, is engaged when viewing spatial scenes or prominent landmarks (Epstein and Kanwisher, 1998). The postrhinal cortex projects prominently to the MEC (Furtak et al., 2007), and could influence landmark learning in the HD cell circuit through its direct inputs to the retrosplenial cortex (Burwell et al., 1995) or indirectly through the subiculum (Naber et al., 2001), which in turn projects to the postsubiculum (van Groen and Wyss, 1990a).
Several studies from our laboratory and others now point to the postsubiculum and retrosplenial cortex as having a central role in landmark learning as both structures have direct and extensive connections with visual processing regions such as areas 17, 18b, and the lateral dorsal thalamus (Vogt and Miller, 1983; van Groen and Wyss, 1990b, 1992, 2003). In addition, lesions of the postsubiculum or retrosplenial cortex disrupt landmark control of HD cells (Goodridge and Taube, 1997; Yoder and Taube, 2008; Clark et al., 2010) and place cells (Cooper and Mizumori, 2001; Calton et al., 2003), and lesions of either structure impair accurate landmark-dependent navigation by rats (Taube et al., 1992; Liu et al., 2001; Keene and Bucci, 2009; Vann et al., 2009). The relative contribution of each area is presently unclear, but it does seem that the postsubiculum has a greater role because impairments in landmark control are milder after retrosplenial lesions (Clark et al., 2010). Nonetheless, precisely what each of these brains regions contribute to landmark processing in the HD cell circuit remains unclear.
The absence of significant impairments in the dark test and dual-chamber task after MEC lesions are consistent with converging evidence suggesting that the HD cell signal is formed by idiothetic information within the reciprocal connections of the lateral mammillary and dorsal tegmental nuclei (Fig. 1; Taube, 2007). Both of these nuclei contain cells that are responsive to the animal’s angular head velocity, a source of self-movement information that can be integrated over time to determine an animal’s current HD (Blair et al., 1998; Stackman and Taube, 1998; Bassett and Taube, 2001; Sharp et al., 2001). Also consistent with this view are studies showing that lesions to either structure completely abolish the HD signal within the ADN (Blair et al., 1999; Bassett et al., 2007). The precise pathways conveying information about head motion is presently unclear; however, anatomical work suggests that projections from the supragenual nucleus and/or nucleus prepositus may be critical because both receive direct inputs from the vestibular system (Brown et al., 2005; Biazoli et al., 2006) and preliminary studies showed that lesions of the supragenual nucleus disrupted HD cell activity in ADN (Brown et al., 2007). Some recent studies also indicate that the direct projections from the lateral habenula and interpeduncular nucleus to the dorsal tegmental nucleus may also contribute angular head velocity information to the HD cell circuit (Sharp et al., 2006; Clark et al., 2009).
An alternative pathway in which self-movement information is processed and conveyed to the HD cell circuit is through the hippocampus (Golob and Taube, 1999; Maaswinkel et al., 1999; however, see Alyan and McNaughton, 1999). Specifically, Golob and Taube (1999) demonstrated that neurotoxic lesions of the hippocampus reduce the stability of ADN HD cells under conditions in which idiothetic cues are likely integrated to maintain a stable preferred directional orientation (i.e., in sustained darkness and in the dual-chamber task). The results of the present study indicate that the influence of hippocampal processing does not pass through the MEC, but is instead likely conveyed through the subicular complex, either directly to the postsubiculum, or through the subiculum and then to the postsubiculum (van Groen and Wyss, 1990a). Lesions of the postsubiculum have been shown to disrupt the stability of HD cell orientation under darkened environmental conditions (Yoder and Taube, 2008); however, it has not been established whether this finding reflects a general impairment of nonvisual landmark control or a disruption in idiothetic processing. Lesions of the postsubiculum have also been shown to disrupt performance on spatial tasks (Taube et al., 1992) and the ability of HD cells to maintain a stable preferred firing direction when locomoting to a novel environment (Goodridge and Taube, 1997).
Although the present study indicates that the MEC does not contribute significantly to the limbic HD cell signal, several studies have shown that the MEC is involved in representing spatial location (Fyhn et al., 2004; Parron et al., 2004; Hafting et al., 2005; Steffenach et al., 2005; Brun et al., 2008a, b; Van Cauter et al., 2008). However, it is unclear whether the MEC determines location using landmarks (Schenk and Morris, 1985; Parron et al., 2004; Steffenach et al., 2005), environmental boundaries (Hartley et al., 2000; Solstad et al., 2008), or by path integrating changes in velocity and HD over time (Fuhs and Touretzky, 2006; McNaughton et al., 2006; Burgess et al., 2007; Hasselmo et al., 2007). Certainly, the presence of HD cell activity within the MEC and the observed velocity modulation of each cell type are consistent with the path integration hypothesis (Sargolini et al., 2006); however, the results of behavioral studies somewhat contradict this notion. Whereas Parron and Save (2004) demonstrated that rats with entorhinal lesions are impaired at accurately path integrating a direct route home after searching for food in an open field, a recent study by Shrager et al. (2008) showed that blindfolded humans with extensive damage to their entorhinal cortex could accurately point back to their starting location after walking a path that included a series of turns. Both studies included subjects with large lesions of the entorhinal cortex, and often included other portions of the parahippocampal gyrus; thus, lesion size is not likely a contributing factor to these differing results. Nevertheless, it is possible that the subjects in the latter study were indeed impaired at path integration, but were capable of using an intact HD cell system to accurately point in the direction of the start point. This outcome may have been possible because of the relatively short paths that the human subjects were required to walk, compared to the paths walked by the rats in the Parron and Save study (Whitlock et al., 2008).
One intriguing result of our study was the general absence of impairments of the HD signal in animals with additional parasubiculum damage. This finding was particularly interesting when considering that the parasubiculum projects to several regions within the HD cell circuit, including the ADN, retrosplenial cortex, and postsubiculum (van Groen and Wyss, 1990c). In addition, the parasubiculum contains neurons that are modulated by spatial location (Taube, 1995a,b; Hargreaves et al., 2005; Solstad et al., 2008). Interestingly, a recent report indicates that many parasubicular neurons have grid cell and HD cell characteristics (Boccara et al., 2010). Nevertheless, the additional damage to the parasubiculum did not exceed 50% of its total volume; thus, it will be of interest to determine whether complete removal of the structure would disrupt normal HD cell activity.
CONCLUSION
In conclusion, our experiments demonstrate that the MEC does not significantly contribute to landmark processing or angular path integration by ADN HD cells. Although these findings suggest that the MEC plays a limited role in determining an animal’s current HD, a large body of experimental and theoretical work now suggests that the MEC is dedicated to the representation of spatial position. However, whether the MEC determines current location using environmental cues, or by path integrating HD cell information over time, is unclear and should be a goal of future investigation.
Acknowledgments
Grant sponsor: National Institute of Health; Grant number: NS053907; Grant sponsor: National Sciences and Engineering Research Council of Canada.
References
- Agster KL, Burwell RD. Cortical efferents of the perirhinal, postrhinal, and entorhinal cortices of the rat. Hippocampus. 2009;19:1159–1186. doi: 10.1002/hipo.20578. [DOI] [PMC free article] [PubMed] [Google Scholar]
- Alyan S, McNaughton BL. Hippocampectomized rats are capable of homing by path integration. Behav Neurosci. 1999;113:19–31. doi: 10.1037//0735-7044.113.1.19. [DOI] [PubMed] [Google Scholar]
- Bassett JP, Taube JS. Neural correlates for angular head velocity in the rat dorsal tegmental nucleus. J Neurosci. 2001;21:5740–5751. doi: 10.1523/JNEUROSCI.21-15-05740.2001. [DOI] [PMC free article] [PubMed] [Google Scholar]
- Bassett JP, Tullman ML, Taube JS. Lesions of the tegmentomammillary circuit in the head direction system disrupt the head direction signal in the anterior thalamus. J Neurosci. 2007;27:7564–7577. doi: 10.1523/JNEUROSCI.0268-07.2007. [DOI] [PMC free article] [PubMed] [Google Scholar]
- Batschelet E. Circular Statistics in Biology. New York, NY: Academic Press; 1981. [Google Scholar]
- Biazoli CE, Jr, Goto M, Campos AM, Canteras NS. The supragenual nucleus: A putative relay station for ascending vestibular signs to head direction cells. Brain Res. 2006;1094:138–148. doi: 10.1016/j.brainres.2006.03.101. [DOI] [PubMed] [Google Scholar]
- Blair HT, Sharp PE. Anticipatory head direction signals in anterior thalamus: Evidence for a thalamocortical circuit that integrates angular head motion to compute head direction. J Neurosci. 1995;15:6260–6270. doi: 10.1523/JNEUROSCI.15-09-06260.1995. [DOI] [PMC free article] [PubMed] [Google Scholar]
- Blair HT, Cho J, Sharp PE. Role of the lateral mammillary nucleus in the rat head direction circuit: A combined single-unit recording and lesion study. Neuron. 1998;21:1387–1397. doi: 10.1016/s0896-6273(00)80657-1. [DOI] [PubMed] [Google Scholar]
- Blair HT, Cho J, Sharp PE. The anterior thalamic head-direction signal is abolished by bilateral but not unilateral lesions of the lateral mammillary nucleus. J Neurosci. 1999;19:6673–6683. doi: 10.1523/JNEUROSCI.19-15-06673.1999. [DOI] [PMC free article] [PubMed] [Google Scholar]
- Blair HT, Welday AC, Zhang K. Scale-invariant memory representations emerge from moiré interference between grid fields that produce theta oscillations: A computational model. J Neurosci. 2007;27:3211–3229. doi: 10.1523/JNEUROSCI.4724-06.2007. [DOI] [PMC free article] [PubMed] [Google Scholar]
- Boccara CN, Sargolini F, Thoresen VH, Solstad T, Witter MP, Moser EI, Moser MB. Grid cells in pre- and parasubiculum. Nat Neurosci. 2010;13:987–994. doi: 10.1038/nn.2602. [DOI] [PubMed] [Google Scholar]
- Brown JE, Card JP, Yates BJ. Polysynaptic pathways from the vestibular nuclei to the lateral mammillary nucleus of the rat: Substrates for vestibular input to head direction cells. Exp Brain Res. 2005;161:47–61. doi: 10.1007/s00221-004-2045-4. [DOI] [PubMed] [Google Scholar]
- Brown JE, Clark BJ, Taube JS. Program No. 90.9. 2007 Neuroscience Meeting Planner. San Diego, CA: Society for Neuroscience (Online); 2007. Effects of supragenual nucleus lesions on head direction cell activity in the rat. [Google Scholar]
- Brun VH, Leutgeb S, Wu HQ, Schwarcz R, Witter MP, Moser EI, Moser MB. Impaired spatial representation in CA1 after lesion of direct input from entorhinal cortex. Neuron. 2008a;57:290–302. doi: 10.1016/j.neuron.2007.11.034. [DOI] [PubMed] [Google Scholar]
- Brun VH, Solstad T, Kjelstrup KB, Fyhn M, Witter MP, Moser EI, Moser MB. Progressive increase in grid scale from dorsal to ventral medial entorhinal cortex. Hippocampus. 2008b;18:1200–1212. doi: 10.1002/hipo.20504. [DOI] [PubMed] [Google Scholar]
- Burgess N, Barry C, O’Keefe J. An oscillatory interference model of grid cell firing. Hippocampus. 2007;17:801–812. doi: 10.1002/hipo.20327. [DOI] [PMC free article] [PubMed] [Google Scholar]
- Burwell RD. The parahippocampal region: Corticocortical connectivity. Ann N Y Acad Sci. 2000;911:25–42. doi: 10.1111/j.1749-6632.2000.tb06717.x. [DOI] [PubMed] [Google Scholar]
- Burwell RD, Witter MP, Amaral DG. Perirhinal and postrhinal cortices of the rat: A review of the neuroanatomical literature and comparison with findings from the monkey brain. Hippocampus. 1995;5:390–408. doi: 10.1002/hipo.450050503. [DOI] [PubMed] [Google Scholar]
- Burwell RD, Saddoris MP, Bucci D, Wiig KA. Corticohippocampal contributions to spatial and contextual Learning. J Neurosci. 2004;24:3826–3836. doi: 10.1523/JNEUROSCI.0410-04.2004. [DOI] [PMC free article] [PubMed] [Google Scholar]
- Calton JL, Stackman RW, Goodridge JP, Archey WB, Dudchenko PA, Taube JS. Hippocampal place cell instability after lesions of the head direction cell network. J Neurosci. 2003;23:9719–9731. doi: 10.1523/JNEUROSCI.23-30-09719.2003. [DOI] [PMC free article] [PubMed] [Google Scholar]
- Clark BJ, Sarma A, Taube JS. Head direction cell instability in the anterior dorsal thalamus after lesions of the interpeduncular nucleus. J Neurosci. 2009;29:493–507. doi: 10.1523/JNEUROSCI.2811-08.2009. [DOI] [PMC free article] [PubMed] [Google Scholar]
- Clark BJ, Bassett JP, Wang S, Taube JS. Impaired head direction cell representation in the anterodorsal thalamus after lesions of the retrosplenial cortex. J Neurosci. 2010;30:5289–5302. doi: 10.1523/JNEUROSCI.3380-09.2010. [DOI] [PMC free article] [PubMed] [Google Scholar]
- Cooper BG, Mizumori SJ. Temporary inactivation of the retrosplenial cortex causes a transient reorganization of spatial coding in the hippocampus. J Neurosci. 2001;21:3986–4001. doi: 10.1523/JNEUROSCI.21-11-03986.2001. [DOI] [PMC free article] [PubMed] [Google Scholar]
- Dolorfo C, Amaral D. Entorhinal cortex of the rat: Topographic organization of the cells of origin of the perforant path projection to the dentate gyrus. J Comp Neurol. 1998a;398:25–48. [PubMed] [Google Scholar]
- Dolorfo C, Amaral D. Entorhinal cortex of the rat: Organization of intrinsic connections. J Comp Neurol. 1998b;398:49–82. doi: 10.1002/(sici)1096-9861(19980817)398:1<49::aid-cne4>3.0.co;2-9. [DOI] [PubMed] [Google Scholar]
- Eichenbaum H, Lipton PA. Towards a functional organization of the medial temporal lobe memory system: Role of the parahippocampal and medial entorhinal cortical areas. Hippocampus. 2008;18:1314–1324. doi: 10.1002/hipo.20500. [DOI] [PMC free article] [PubMed] [Google Scholar]
- Epstein R, Kanwisher N. A cortical representation of the local visual environment. Nature. 1998;392:598–601. doi: 10.1038/33402. [DOI] [PubMed] [Google Scholar]
- Etienne AS, Maurer R, Boulens V, Levy A, Rowe T. Resetting the path integrator: A basic condition for route-based navigation. J Exp Biol. 2004;207:1491–1508. doi: 10.1242/jeb.00906. [DOI] [PubMed] [Google Scholar]
- Fuhs MC, Touretzky DS. A spin glass model of path integration in rat medial entorhinal cortex. J Neurosci. 2006;26:4266–4276. doi: 10.1523/JNEUROSCI.4353-05.2006. [DOI] [PMC free article] [PubMed] [Google Scholar]
- Furtak SC, Wei SM, Agster KL, Burwell RD. Functional neuro-anatomy of the parahippocampal region in the rat: The perirhinal and postrhinal cortices. Hippocampus. 2007;17:709–722. doi: 10.1002/hipo.20314. [DOI] [PubMed] [Google Scholar]
- Fyhn M, Molden S, Witter MP, Moser EI, Moser MB. Spatial representation in the entorhinal cortex. Science. 2004;305:1258–1264. doi: 10.1126/science.1099901. [DOI] [PubMed] [Google Scholar]
- Gaskin S, White NM. Unreinforced spatial (latent) learning is mediated by a circuit that includes dorsal entorhinal cortex and fimbria fornix. Hippocampus. 2007;17:586–594. doi: 10.1002/hipo.20295. [DOI] [PubMed] [Google Scholar]
- Golob EJ, Taube JS. Head direction cells in rats with hippocampal or overlying neocortical lesions: Evidence for impaired angular path integration. J Neurosci. 1999;19:7198–7211. doi: 10.1523/JNEUROSCI.19-16-07198.1999. [DOI] [PMC free article] [PubMed] [Google Scholar]
- Goodridge JP, Taube JS. Interaction between postsubiculum and anterior thalamus in the generation of head direction cell activity. J Neurosci. 1997;17:9315–9330. doi: 10.1523/JNEUROSCI.17-23-09315.1997. [DOI] [PMC free article] [PubMed] [Google Scholar]
- Goodridge JP, Dudchenko PA, Worboys KA, Golob EJ, Taube JS. Cue control and head direction cells. Behav Neurosci. 1998;112:749–761. doi: 10.1037//0735-7044.112.4.749. [DOI] [PubMed] [Google Scholar]
- Hafting T, Fyhn M, Molden S, Moser MB, Moser EI. Microstructure of a spatial map in the entorhinal cortex. Nature. 2005;436:801–806. doi: 10.1038/nature03721. [DOI] [PubMed] [Google Scholar]
- Hargreaves EL, Rao G, Lee I, Knierim JJ. Major dissociation between medial and lateral entorhinal input to dorsal hippocampus. Science. 2005;308:1792–1794. doi: 10.1126/science.1110449. [DOI] [PubMed] [Google Scholar]
- Hartley T, Burgess N, Lever C, Cacucci F, O’Keefe J. Modeling place fields in terms of the cortical inputs to the hippocampus. Hippocampus. 2000;10:369–379. doi: 10.1002/1098-1063(2000)10:4<369::AID-HIPO3>3.0.CO;2-0. [DOI] [PubMed] [Google Scholar]
- Hasselmo ME, Giocomo LM, Zilli EA. Grid cell firing may arise from interference of theta frequency membrane potential oscillations in single neurons. Hippocampus. 2007;17:1252–1271. doi: 10.1002/hipo.20374. [DOI] [PMC free article] [PubMed] [Google Scholar]
- Insausti R, Herrero MT, Witter MP. Entorhinal cortex of the rat: Cytoarchitectonic subdivisions and the origin and distribution of cortical efferents. Hippocampus. 1997;7:146–183. doi: 10.1002/(SICI)1098-1063(1997)7:2<146::AID-HIPO4>3.0.CO;2-L. [DOI] [PubMed] [Google Scholar]
- Jarrard LE, Okaichi H, Steward O, Goldschmidt RB. On the role of hippocampal connections in the performance of place and cue tasks: Comparisons with damage to hippocampus. Behav Neurosci. 1984;98:946–954. doi: 10.1037//0735-7044.98.6.946. [DOI] [PubMed] [Google Scholar]
- Jones BF, Witter MP. Cingulate cortex projections to the parahippocampal region and hippocampal formation in the rat. Hippocampus. 2007;17:957–976. doi: 10.1002/hipo.20330. [DOI] [PubMed] [Google Scholar]
- Keene C, Bucci D. Damage to the retrosplenial cortex produces specific impairments in spatial working memory. Neurobiol Learn Mem. 2009;91:408–414. doi: 10.1016/j.nlm.2008.10.009. [DOI] [PubMed] [Google Scholar]
- Kerr KM, Agster KL, Furtak SC, Burwell RD. Functional neuroanatomy of the parahippocampal region: The lateral and medial entorhinal areas. Hippocampus. 2007;17:697–708. doi: 10.1002/hipo.20315. [DOI] [PubMed] [Google Scholar]
- Knierim JJ, Lee I, Hargreaves EL. Hippocampal place cells: Parallel input streams, subregional processing, and implications for episodic memory. Hippocampus. 2006;16:755–764. doi: 10.1002/hipo.20203. [DOI] [PubMed] [Google Scholar]
- Kubie JL. A driveable bundle of microwires for collecting single-unit data from freely-moving rats. Physiol Behav. 1984;32:115–118. doi: 10.1016/0031-9384(84)90080-5. [DOI] [PubMed] [Google Scholar]
- Liu P, Jarrard LE, Bilkey DK. Excitotoxic lesions of the pre-and parasubiculum disrupt object recognition and spatial memory processes. Behav Neurosci. 2001;115:112–124. doi: 10.1037/0735-7044.115.1.112. [DOI] [PubMed] [Google Scholar]
- Maaswinkel H, Jarrard LE, Whishaw IQ. Hippocampectomized rats are impaired in homing by path integration. Hippocampus. 1999;9:553–561. doi: 10.1002/(SICI)1098-1063(1999)9:5<553::AID-HIPO9>3.0.CO;2-G. [DOI] [PubMed] [Google Scholar]
- Manns JR, Eichenbaum H. Evolution of declarative memory. Hippocampus. 2006;16:795–808. doi: 10.1002/hipo.20205. [DOI] [PubMed] [Google Scholar]
- McNaughton BL, Battaglia FP, Jensen O, Moser EI, Moser MB. Path integration and the neural basis of the “cognitive map”. Nat Rev Neurosci. 2006;7:663–678. doi: 10.1038/nrn1932. [DOI] [PubMed] [Google Scholar]
- Moser EI, Kropff E, Moser MB. Place cells, grid cells, and the brain’s spatial representation system. Ann Rev Neurosci. 2008;31:69–89. doi: 10.1146/annurev.neuro.31.061307.090723. [DOI] [PubMed] [Google Scholar]
- Naber PA, Witter MP, Lopes da Silva FH. Evidence for a direct projection from the postrhinal cortex to the subiculum in the rat. Hippocampus. 2001;11:105–117. doi: 10.1002/hipo.1029. [DOI] [PubMed] [Google Scholar]
- Neitz J, Jacobs GH. Reexamination of spectral mechanisms in the rat (Rattus norvegicus) J Comp Psych. 1986;100:21–29. [PubMed] [Google Scholar]
- Parron C, Save E. Evidence for entorhinal and parietal cortices involvement in path integration in the rat. Exp Brain Res. 2004;159:349–359. doi: 10.1007/s00221-004-1960-8. [DOI] [PubMed] [Google Scholar]
- Parron C, Poucet B, Save E. Entorhinal cortex lesions impair the use of distal but not proximal landmarks during place navigation in the rat. Behav Brain Res. 2004;154:345–352. doi: 10.1016/j.bbr.2004.03.006. [DOI] [PubMed] [Google Scholar]
- Paxinos G, Watson C. The Rat Brain in Stereotaxic Coordinates. 4. San Diego, CA: Academic Press; 1998. [Google Scholar]
- Quirk G, Muller R, Kubie J, Ranck J. The positional firing properties of medial entorhinal neurons: Description and comparison with hippocampal place cells. J Neurosci. 1990;12:1945–1963. doi: 10.1523/JNEUROSCI.12-05-01945.1992. [DOI] [PMC free article] [PubMed] [Google Scholar]
- Sargolini F, Fyhn M, Hafting T, McNaughton BL, Witter MP, Moser MB, Moser EI. Conjunctive representation of position, direction, and velocity in entorhinal cortex. Science. 2006;312:758–762. doi: 10.1126/science.1125572. [DOI] [PubMed] [Google Scholar]
- Savelli F, Yoganarasimha D, Knierim JJ. Influence of boundary removal on the spatial representations of the medial entorhinal cortex. Hippocampus. 2008;18:1270–1282. doi: 10.1002/hipo.20511. [DOI] [PMC free article] [PubMed] [Google Scholar]
- Schenk F, Morris RG. Dissociation between components of spatial memory in rats after recovery from the effects of retrohippocampal lesions. Exp Brain Res. 1985;58:11–28. doi: 10.1007/BF00238949. [DOI] [PubMed] [Google Scholar]
- Séguinot V, Maurer R, Etienne AS. Dead reckoning in a small mammal: The evaluation of distance. J Comp Physiol A. 1993;173:103–113. doi: 10.1007/BF00209622. [DOI] [PubMed] [Google Scholar]
- Sharp PE, Tinkelman A, Cho J. Angular velocity and head direction signals recorded from the dorsal tegmental nucleus of Gudden in the rat: Implications for path integration in the head direction cell circuit. Behav Neurosci. 2001;115:571–588. [PubMed] [Google Scholar]
- Sharp PE, Turner-Williams S, Tuttle S. Movement related correlates of single cell activity in the interpeduncular nucleus and habenula of the rat during a pellet-chasing task. Behav Brain Res. 2006;166:55–70. doi: 10.1016/j.bbr.2005.07.004. [DOI] [PubMed] [Google Scholar]
- Shrager Y, Kirwan CB, Squire LR. Neural basis of the cognitive map: Path integration does not require hippocampus or entorhinal cortex. Proc Natl Acad Sci USA. 2008;105:12034–12038. doi: 10.1073/pnas.0805414105. [DOI] [PMC free article] [PubMed] [Google Scholar]
- Skaggs WE, McNaughton BL, Gothard KM, Markus EJ. An information-theoretic approch to deciphering the hippocampal code. In: Hanson SJ, Cowan JD, Giles CL, editors. Advances in Neural Information Processing Systems. Vol. 5. San Mateo, CA: Morgan Kaufmann; 1993. pp. 1030–1037. [Google Scholar]
- Solstad T, Moser EI, Einevoll GT. From grid cells to place cells: A mathematical model. Hippocampus. 2006;16:1026–1031. doi: 10.1002/hipo.20244. [DOI] [PubMed] [Google Scholar]
- Solstad T, Boccara CN, Kropff E, Moser MB, Moser EI. Representation of geometric borders in the entorhinal cortex. Science. 2008;322:1865–1868. doi: 10.1126/science.1166466. [DOI] [PubMed] [Google Scholar]
- Stackman RW, Taube JS. Firing properties of rat lateral mammillary single units: Head direction, head pitch, and angular head velocity. J Neurosci. 1998;18:9020–9037. doi: 10.1523/JNEUROSCI.18-21-09020.1998. [DOI] [PMC free article] [PubMed] [Google Scholar]
- Stackman RW, Golob EJ, Bassett JP, Taube JS. Passive transport disrupts directional path integration by rat head direction cells. J Neurophysiol. 2003;90:2862–2874. doi: 10.1152/jn.00346.2003. [DOI] [PubMed] [Google Scholar]
- Steffenach HA, Witter M, Moser MB, Moser EI. Spatial memory in the rat requires the dorsolateral band of the entorhinal cortex. Neuron. 2005;45:301–313. doi: 10.1016/j.neuron.2004.12.044. [DOI] [PubMed] [Google Scholar]
- Tabachnick BG, Fidell LS. Using Multivariate Statistics. 5. Boston, MA: Allyn and Bacon; 2007. [Google Scholar]
- Taube JS. Head direction cells recorded in the anterior thalamic nuclei of freely moving rats. J Neurosci. 1995a;15:70–86. doi: 10.1523/JNEUROSCI.15-01-00070.1995. [DOI] [PMC free article] [PubMed] [Google Scholar]
- Taube JS. Place cells recorded in the parasubiculum of freely moving rats. Hippocampus. 1995b;5:569–583. doi: 10.1002/hipo.450050608. [DOI] [PubMed] [Google Scholar]
- Taube JS. The head direction signal: Origins and sensory-motor integration. Ann Rev Neurosci. 2007;30:181–207. doi: 10.1146/annurev.neuro.29.051605.112854. [DOI] [PubMed] [Google Scholar]
- Taube JS, Burton HL. Head direction cell activity monitored in a novel environment and during a cue conflict situation. J Neurophysiol. 1995;74:1953–1971. doi: 10.1152/jn.1995.74.5.1953. [DOI] [PubMed] [Google Scholar]
- Taube JS, Muller RU. Comparisons of head direction cell activity in the postsubiculum and anterior thalamus of freely moving rats. Hippocampus. 1998;8:87–108. doi: 10.1002/(SICI)1098-1063(1998)8:2<87::AID-HIPO1>3.0.CO;2-4. [DOI] [PubMed] [Google Scholar]
- Taube JS, Kesslak JP, Cotman CW. Lesions of the rat postsubiculum impair performance on spatial tasks. Behav Neural Biol. 1992;57:131–143. doi: 10.1016/0163-1047(92)90629-i. [DOI] [PubMed] [Google Scholar]
- Van Cauter T, Poucet B, Save E. Unstable CA1 place cell representation in rats with entorhinal cortex lesions. Eur J Neurosci. 2008;27:1933–1946. doi: 10.1111/j.1460-9568.2008.06158.x. [DOI] [PubMed] [Google Scholar]
- van Groen T. Entorhinal cortex of the mouse: Cytoarchitectonical organization. Hippocampus. 2001;11:397–407. doi: 10.1002/hipo.1054. [DOI] [PubMed] [Google Scholar]
- van Groen T, Wyss JM. The postsubicular cortex in the rat: Characterization of the fourth region of the subicular cortex and its connections. Brain Res. 1990a;529:165–177. doi: 10.1016/0006-8993(90)90824-u. [DOI] [PubMed] [Google Scholar]
- van Groen T, Wyss JM. Connections of the retrosplenial granular a cortex in the rat. J Comp Neurol. 1990b;300:593–606. doi: 10.1002/cne.903000412. [DOI] [PubMed] [Google Scholar]
- van Groen T, Wyss JM. The connections of presubiculum and parasubiculum in the rat. Brain Res. 1990c;518:227–243. doi: 10.1016/0006-8993(90)90976-i. [DOI] [PubMed] [Google Scholar]
- van Groen T, Wyss JM. Connections of the retrosplenial dysgranular cortex in the rat. J Comp Neurol. 1992;315:200–216. doi: 10.1002/cne.903150207. [DOI] [PubMed] [Google Scholar]
- van Groen T, Wyss JM. Connections of the retrosplenial granular b cortex in the rat. J Comp Neurol. 2003;463:249–263. doi: 10.1002/cne.10757. [DOI] [PubMed] [Google Scholar]
- van Strien NM, Cappaert NL, Witter MP. The anatomy of memory: An interactive overview of the parahippocampal-hippocampal network. Nat Rev Neurosci. 2009;10:272–282. doi: 10.1038/nrn2614. [DOI] [PubMed] [Google Scholar]
- Vann SD, Aggleton JP, Maguire EA. What does the retrosplenial cortex do? Nat Rev Neurosci. 2009;10:792–802. doi: 10.1038/nrn2733. [DOI] [PubMed] [Google Scholar]
- Vogt BA, Miller MW. Cortical connections between rat cingulate cortex and visual, motor, and postsubicular cortices. J Comp Neurol. 1983;216:192–210. doi: 10.1002/cne.902160207. [DOI] [PubMed] [Google Scholar]
- Whitlock JR, Sutherland RJ, Witter MP, Moser MB, Moser EI. Navigating from hippocampus to parietal cortex. Proc Natl Acad Sci USA. 2008;105:14755–14762. doi: 10.1073/pnas.0804216105. [DOI] [PMC free article] [PubMed] [Google Scholar]
- Wiener SI, Taube JS. Head Direction Cells and the Neural Mechanisms of Spatial Orientation. Cambridge, MA: MIT Press; 2005. [Google Scholar]
- Wyss JM, van Groen T. Connections between the retrosplenial cortex and the hippocampal formation: A review. Hippocampus. 1992;1:1–11. doi: 10.1002/hipo.450020102. [DOI] [PubMed] [Google Scholar]
- Yoder R, Taube JS. Program No. 90.9. 2008 Neuroscience Meeting Planner. Washington, DC: Society for Neuroscience (Online); 2008. The postsubiculum provides visual landmark control to the head direction signal at the lateral mammillary nuclei. [Google Scholar]
- Yoder R, Taube JS. Head direction cell activity in mice: Robust directional signal depends on intact otolith organs. J Neurosci. 2009;29:1061–1076. doi: 10.1523/JNEUROSCI.1679-08.2009. [DOI] [PMC free article] [PubMed] [Google Scholar]