

Abstract
Sphingosine‐1‐phosphate receptor 1 (S1P1) modulators sequester circulating lymphocytes within lymph nodes, thereby preventing potentially pathogenic autoimmune cells from exiting into the blood stream and reaching inflamed tissues. S1P1 receptor modulation may thus offer potential to treat various autoimmune diseases. The first nonselective S1P1‐5 receptor modulator FTY720/fingolimod/Gilenya® has successfully demonstrated clinical efficacy in relapsing forms of multiple sclerosis. However, cardiovascular, hepatic, and respiratory side‐effects were reported and there is a need for novel S1P1 receptor modulators with better safety profiles. Here, we describe the discovery of cenerimod, a novel, potent and selective S1P1 receptor modulator with unique S1P1 receptor signaling properties and absence of broncho‐ and vasoconstrictor effects ex vivo and in vivo. Cenerimod dose‐dependently lowered circulating lymphocyte counts in rats and mice after oral administration and effectively attenuated disease parameters in a mouse experimental autoimmune encephalitis (EAE) model. Cenerimod has potential as novel therapy with improved safety profile for autoimmune diseases with high unmet medical need.
Keywords: autoimmune diseases, G protein‐coupled receptor signaling, lipid receptors, lymphocyte trafficking, multiple sclerosis, sphingosine‐1‐phosphate
Abbreviations
- CHO
Chinese hamster ovary
- EAE
experimental autoimmune encephalitis
- EC50
half maximal excitatory concentration
- Emax
maximal effect
- HR
heart rate
- HUVEC
human umbilical vein endothelial cells
- MAP
mean arterial blood pressure
- Penh
enhanced pause
- RMS
relapsing multiple sclerosis
- S1P1
sphingosine‐1‐phosphate receptor 1
- S1P
sphingosine‐1‐phosphate
- SHR
spontaneous hypertensive rats
1. INTRODUCTION
Sphingosine‐1‐phosphate (S1P) is a bioactive sphingolipid ligand that specifically binds to and activates five known G protein‐coupled receptors, S1P1‐5, to regulate different physiological and pathophysiological processes. Tissue and cell type‐specific S1P receptor subtype expression and activation of different intracellular signaling pathways contribute to the functional selectivity. The S1P1 receptor is highly expressed in endothelial cells and it is the predominant S1P receptor subtype expressed in lymphocytes. Brain‐specific expression was shown for the S1P5 receptor, whereas S1P4 receptor expression is limited to the immune system. S1P2 and S1P3 receptors are widely expressed and were shown to be involved in cardiovascular and lung physiology.1 The concentration of S1P in blood is high, approximately 1 μmol·L‐1, and it is much lower in tissues. It is believed that lymphocytes, through activation of S1P1 receptors, migrate along a natural S1P gradient to exit secondary lymphoid tissue or thymus and enter the blood circulation. The nonselective S1P1‐5 receptor agonist FTY720 is a prodrug that is converted by sphingosine kinase into the phosphorylated bioactive form, pFTY720. In lymphocytes, pFTY720 promotes S1P1 receptor activation, leading to sustained internalization and desensitization.1, 2 This process renders the S1P1 receptor functionally inactive, thereby trapping lymphocytes in secondary lymphoid organs. Experiments conducted in various animal models of autoimmune disease have demonstrated efficacy of S1P1 receptor modulators across several immune‐mediated chronic inflammatory conditions.3 FTY720 (Fingolimod/Gilenya®) became the first approved oral therapy for treatment of relapsing forms of multiple sclerosis.4
In rodents, S1P3 receptor agonism was associated with a reduction of heart rate by activation of G protein‐coupled inwardly rectifying potassium channels (GIRK) that regulate pacemaker frequency, shape, and duration of action potentials.5, 6 S1P3 receptor activation was also shown to mediate S1P‐induced coronary and cerebral vasoconstriction.7, 8 Furthermore, S1P2 and S1P3 receptor signaling stimulated extracellular matrix synthesis in human lung fibroblasts9 and FTY720‐induced pathological lung fibrosis findings were reported in dogs and monkeys.10 S1P augments agonist‐induced contraction of isolated mouse bronchial smooth muscle cells,11 isolated mouse bronchi, and isolated mouse whole lung.12 S1P levels were increased in asthmatic patients upon segmental allergen challenge 13 and S1P2 receptor signaling induced smooth muscle cell contraction.14, 15 This suggests that S1P signaling is involved in homeostatic control of airway physiology. Indeed, bronchoconstriction, as measured by a reduction in mean forced expiratory volume in 1 second (FEV1), was identified as a drug‐related side‐effect in the clinical use of FTY720.4 In summary, these observations suggest that nonselective S1P receptor agonism, exemplified by FTY720, is associated with side‐effects, which can be mitigated with improved S1P1 receptor modulators.
In the present study, we describe cenerimod, a novel, selective and orally available S1P1 receptor modulator that displays biased S1P1 receptor signaling. We show that cenerimod induced potent blood lymphocyte count reduction in vivo and attenuated disease in a mouse experimental autoimmune encephalomyelitis (EAE) model. Cenerimod was also shown to lack bronchoconstrictive and vasoconstrictive effects ex vivo and in vivo. The data presented here show that cenerimod has unique S1P1 receptor signaling properties with a beneficial safety profile, encouraging further evaluation in human clinical trials targeting autoimmune diseases.
2. MATERIALS AND METHODS
2.1. Ethics statement
All experimental procedures were conducted in accordance with the Swiss animal welfare ordinance and Actelion Animal Welfare policy on the use of experimental animals. The studies were approved by the Baselland Cantonal Veterinary Home Office. The number of animals was kept to a strict minimum.
2.2. Compounds
Sphingosine‐1‐phosphate (S1P) was purchased from Avanti Polar Lipids Inc. (USA). FTY720 and pFTY720 were purchased from commercial vendors. Siponimod, p‐amiselimod, TASP0277308, and TY52156 were synthesized by Actelion Pharmaceuticals Ltd. (Switzerland). Cenerimod/ACT‐334441 ((S)‐3‐(4‐(5‐(2‐cyclopentyl‐6‐methoxypyridin‐4‐yl)‐1,2,4‐oxadiazol‐3‐yl)‐2‐ethyl‐6‐methylphenoxy)propane‐1,2‐diol) was synthesized by Actelion Pharmaceuticals Ltd. (Switzerland).16
2.3. GTPγS assay
Membrane preparations of Chinese Hamster Ovary (CHO) cells, expressing recombinant human S1P1, S1P2, S1P3, S1P4, and S1P5 receptor, or of Human Umbilical Vein Endothelial Cells (HUVEC) (Cascade Biologics Inc., UK) were used for (35S)‐GTPγS‐binding assays to measure intracellular G protein activation following agonist binding. The assays were essentially performed as described previously.17 EC50 values were calculated with the IC50Witch software (Actelion Pharmaceuticals Ltd, Switzerland), using the maximal response of the compound as the maximum (Smart Max) and the no‐effect level of the lowest compound concentration as the minimum. The maximal effect (E max) is expressed as a percentage of the maximal response that was induced by S1P in the same assay (either 1 μmol·L‐1 or 10 μmol·L‐1, depending on the S1P receptor subtype).
2.4. Ca2+ mobilization assay (FLIPR)
Human Umbilical Vein Endothelial Cells (HUVEC) were seeded at 10 000 cells/well in M200 cell culture medium (Cascade Biologics Inc., UK) using gelatin‐coated 384‐well black, clear‐bottomed sterile plates and incubated overnight at 37°C/5% CO2. The following day, the cell growth medium was replaced with dye loading buffer 1x HBSS, 0.0375% NaHCO3, 20 mmol·L‐1 HEPES, pH 7.4, 5 mmol·L‐1 probenecid, 3 μmol·L‐1 Fluo‐4 Dye (Life Technologies Europe B.V., Switzerland) and cells were incubated for 1 hour at 37°C/5% CO2. The plates were then washed once with 1x HBSS, 0.0375% NaHCO3, 20 mmol·L‐1 HEPES, 1 mg·mL−1 fatty‐acid free BSA, 2.5 mmol·L‐1 probenecid (Life Technologies Europe B.V., Switzerland). Plates were incubated 30 minutes at room temperature in the dark before compound addition. Fluorescence was measured for 3 minutes using a FLIPR Tetra device (Molecular Devices, USA). Maximum relative fluorescence units (RFU) were exported and used to determine EC50 values that were calculated with IC50Witch software (Actelion Pharmaceuticals Ltd., Switzerland), using the maximal response of the compound as the maximum (Smart Max) and the no‐effect level of the vehicle as the minimum. The maximal effect (E max) is expressed as a percentage of the maximal response that was induced by S1P in the same assay (200 nmol·L‐1).
2.5. QPCR analysis
Tissues for Quantitative Polymerase Chain Reaction (QPCR) analysis were prepared from the upper (proximal) or lower (distal) trachea or the primary right bronchus from male Wistar rats (Harlan Laboratories Inc., Switzerland) and placed in RNAlater according to the manufacturer's instructions (Ambion, USA). Total RNA was extracted using RNAeasy kits according to the manufacturer's instruction (Qiagen, Germany). Remaining genomic DNA was digested using the DNAse free kit (Ambion, USA). The quantity of RNA was analyzed using a Nanodrop spectrophotometer (Thermo Fisher, USA) and RNA quality was assessed using a Bioanalyzer 2100 (Agilent, USA). Total RNA was reverse transcribed with the high capacity cDNA archive kit according to the manufacturer's protocol (Applied Biosystems, USA). The cDNA was preamplified according to the preamp kit with 14 cycles (Applied Biosystems, USA). S1P1,2,3,4,5 receptor subtype mRNA expression was analyzed by quantitative PCR (QPCR) on a Biomark HD (Fluidigm, USA), using Taqman assays (Applied Biosystems, USA). Ppia‐Rn00690933_m1and Pgk1‐Rn00821429_g1 was used as reference genes and S1pr1 Rn02758712_s1, S1pr2‐custom assay (For = GGAGAGACCAGGTGACCTCATC, probe = TGTCCCTCAGTGCCAC, Rev = ATGAGCCGTGGTCAGTTCCT), S1pr3‐Rn02758880_s1, S1pr4‐Rn04108095_s1, and S1pr5‐Rn00572952_s1 for mRNA detection. Results were calculated using a modified delta delta Ct method,18 where an expression value of 1 reflects no detectable expression. Statistical comparison was performed using Student's unpaired t test (two‐tailed).
2.6. Measurement of isometric force development
Rat mesenteric arteries were prepared for isometric force recording using standard techniques. Briefly, following euthanasia with CO2, two arterial rings (1.5 mm wide, 2nd and 3rd branch) were prepared and suspended between 20 μm wires in a Mulvany‐Halpern myograph system (10 mL) containing modified Krebs‐Henseleit buffer of the following composition: 115 mmol·L‐1 NaCl; 4.7 mmol·L‐1 KCl; 1.2 mmol·L‐1 MgSO4; 1.5 mmol·L‐1 KH2PO4; 2.5 mmol·L‐1 CaCl2; 25 mmol·L‐1 NaHCO3; 10 mmol·L‐1 glucose. Care was taken to avoid damage to the endothelium. Bathing solution was maintained at 37°C and aerated with 95% O2/5% CO2/pH7.4. An initial resting force of 2.9 mN was applied to the vessel, and changes in force generation were measured using an isometric force recorder (Multi Wire Myograph System Model 610 M Version 2.2, DMT A/S, Aarhus, Denmark) coupled to a EMKA data acquisition system (EMKA Technologies Inc, Paris, France). Viability of the artery was tested by measuring contraction to KCl (60 mmol·L‐1) and the presence of functional endothelium was confirmed by measuring the ability of acetylcholine (10‐5 mol·L‐1) to relax arterial rings contracted with U46619 (10‐6 mol·L‐1).
Tracheal rings were prepared for measurement of isometric force using standard techniques. Briefly, following euthanasia with CO2, lungs were removed en bloc from rats and isolated trachea rings (5 mm wide) were suspended under a resting force of 4.9 mN in tissue baths (10 mL) containing modified Krebs‐Henseleit buffer. Bathing solution was maintained at 37°C and aerated with 95% O2/5% CO2/pH 7.4. Changes in force generation were measured using an isometric force recorder (EMKA Technologies Inc, France). Viability of tracheal rings was assessed by exposure to a depolarizing concentration of KCl (50 mmol·L‐1).
Human bronchial tissue (4th order) was dissected from donor lungs (nontransplantable, de‐identified human lungs, consented for use in medical research by the donor's family or next of kin, in line with each US State's Uniform Anatomical Gift Act). Lungs obtained from donors who were declared brain‐dead were retrieved from either heart beating donors, or within 60 minutes following cardiac death. Bronchial rings (2 mm wide) were prepared for isometric force recording as described for rat trachea, and suspended under a resting force of 10 mN. Potency is expressed as pEC50, defined as the negative logarithm of the EC50. E max is expressed as a % of the reference contraction to KCl (50 mmol·L‐1). Data (n = 4) are expressed as mean ± SEM.
2.7. Measurement of blood lymphocyte count
Blood lymphocyte count was measured in male Wistar rats weighing 294‐510 g (Harlan Laboratories Inc., Switzerland). The rats were housed in climate‐controlled conditions with a 12‐hours light/dark cycle with free access to normal pelleted chow (Provimi Kliba SA, Switzerland) and water ad libitum. The rats were used for blood sampling after an acclimatization period of at least 7 days. All rats were housed in Makrolon cages (Indulab, Switzerland) with wire mesh tops and standardized softwood bedding and appropriate environmental enrichment. Cenerimod was first dissolved in 100% DMSO and then diluted to the appropriate concentration in 7.5% gelatin; solutions were protected from light. The final concentration of DMSO in the formulation was 5%. Peripheral blood lymphocyte count was assessed by hematology following single oral administration of 0.1, 0.3, 1, 3 and 10 mg/kg cenerimod (n = 6 per dose group) or vehicle (n = 12 per dose group). Blood samples from rats were collected before and 3, 6, 24 and 48 hours after oral administration of cenerimod or its vehicle by sublingual puncture. Blood (0.25 mL) was drawn into tubes containing 5% EDTA. For the determination of blood lymphocyte count, undiluted blood was analyzed using a Beckman Coulter 5diffCP hematology analyzer (Beckman Coulter, Switzerland).
2.8. Measurement of compound concentrations in plasma
After measurement of lymphocyte count, plasma was separated by centrifugation and stored at ‐20°C. Plasma samples were analyzed for cenerimod concentrations using liquid chromatography coupled to mass spectrometry. The performance of the bioanalytical assay was checked and documented by including quality‐control samples.
2.9. Blood pressure and heart rate measurements
After an acclimatization period of at least 7 days, male spontaneous hypertensive rats (SHRs) were weighed before surgery and pretreated subcutaneously with buprenorphine (Temgesic®, 0.05 mg·kg‐1, Essex Chemie AG, Lucerne, Switzerland). Anesthesia was induced and maintained by inhalation of 2.5% isoflurane (100% O2). A telemetry transmitter (PA‐C40) was implanted in the peritoneal cavity under sterile conditions. The blood pressure‐sensing catheter was placed in the descending aorta below the renal arteries, pointing upstream. The catheter was secured in place by a cellulose patch and medical tissue adhesive (Vetbond, N° 1469 SB, 3M, St Paul, MN, USA). Using a nonabsorbable Dagrofil 4.0 suture (B/Braun, Aesculap), the transmitter was sutured to the inside of the abdominal wall, 1 cm from the edge of the incision. The abdominal musculature and the skin were closed with a Vicryl 4.0 suture (Ethicon, V3040, Johnson & Johnson). Buprenorphine (0.05 mg·kg‐1) was administered subcutaneously once a day for 2 days after surgery.
Mean arterial pressure (MAP) and heart rate (HR) were collected continuously using the Dataquest ART Gold acquisition system (version 4.2). Blood pressure signals were sampled at 500 Hz. MAP and HR were collected at 5 minute intervals over 24 hours, resulting in a series of 576 data points per rat/day. Hourly means ± SEM were calculated. MAP is expressed in millimeters of mercury (mmHg) and HR in beats per minute (bpm).
The effect of cenerimod (30 mg·kg‐1) and FTY720 (3 mg·kg‐1) on MAP and HR was assessed after single oral administration to SHRs after a recovery period of at least 3 weeks. Compound administration took place in the morning, ie during the sleep phase of the animals. The maximal effect in MAP and HR was calculated as the mean delta value over 6 consecutive hours around the maximal effect to reduce interanimal variability. Statistical analysis was performed using a paired Student's t test comparing the 24 hours control period vs 24 or 30 hours of the treatment period.
2.10. In vivo lung function
Male Wistar rats (200‐250 g) were obtained from Janvier (Le Genest‐Saint‐Isle, France) and allowed to acclimatize in the animal facility for at least 7 days. Lung function was measured in unrestrained, conscious and spontaneously breathing rats by whole‐body barometric plethysmography (WBP, Emka Technologies, Paris, France). Enhanced pause, Penh, ((Te/RT)‐1)*PEF/PIF, where Te: expiratory time, RT: relaxation time, PEF: peak expiratory flow, PIF: peak inspiratory flow) was used as an index of bronchoconstriction.19 Each plethysmography chamber was calibrated before reading by rapid injection of 5 mL air. One rat was placed per plethysmography chamber and lung function parameters were recorded for 120 minutes for baseline assessment. Cenerimod, FTY720 or vehicle (methylcellulose 0.25%, containing 0.05% Tween 80) was administered orally at indicated doses and respiration parameters were measured for 6 hours after administration in the plethysmograph. Data were analyzed using Datanalyst (Emka) and expressed as AUC (area under the curve) recorded for 30 minutes and averaged at 5 minute intervals. The time indicated refers to the starting time of the analyzed period. For example, 120 minutes refers to the AUC calculated for the 120‐150 minute time interval.
2.11. Mouse EAE model
For the induction of EAE, 6‐week‐old female C57/BL6JOlaHsd (Harlan Netherlands) mice were immunized with myelin oligodendrocyte glycoprotein peptide 33‐55 (MOG33‐55) emulsified in complete Freund's adjuvant (CFA). After anesthesia was induced by inhalation (3‐5% isofluorane and 100% O2), the mice were subcutaneously injected with the MOG/CFA emulsion into the left and right flank with a 25G 5/8” syringe. Each mouse received 150 μg MOG dissolved in PBS / mixed 1:2 with CFA. In order to boost disease development, an intraperitoneal (i.p.) injection of a pertussis toxin (PTX) preparation was performed with a 1 mL Sub‐Q syringe. Each mouse received 400 ng PTX in 1% normal mouse serum on day 0 and day 2. Mice were administered with vehicle (0.25% methylcellulose, 0.05% Tween 80 in water) or 6 mg·kg‐1·day‐1 cenerimod starting on day 0 (“preventive”). Alternatively, cenerimod dosing was started at day 14 (“therapeutic”). Mice were scored daily for signs of EAE using the following grades: Score 0 = no clinical sign of EAE; Score 0.5 = distal limp, tail paralyzed; Score 1.0 = complete limp, tail paralyzed; Score 1.5 = limp, tail paralyzed, and hind limb weakness; Score 2.0 = unilateral partial hind limb paralysis; Score 2.5 = bilateral partial hind limb paralysis; Score 3.0 = complete bilateral hind limb paralysis; Score 3.5 = complete bilateral hind limb paralysis and partial forelimb paralysis; Score 4.0 = complete paralysis; Score 5.0 = death.
2.12. Histopathology
Mice were euthanized via intraperitoneal (i.p.) injection of pentobarbital at 300 mg·kg‐1. Mice were perfused with 0.9% NaCl and spinal cord was removed, fixed in 10% neutral buffered formalin (4% formaldehyde) at room temperature for 24 hours. Tissues were paraffin embedded and processed to 4 μm sections, then stained with Hematoxylin and Eosin (HE) for routine morphological evaluation and with Cresylviolet and Luxol Fast Blue (CL) to assess demyelination. Naïve mice served as background controls. Nine segments of spinal cord were processed to slides according to their anatomical location. Demyelination was assessed in a blinded fashion using a semiquantitative grading method according to the intensity of two stainings (cresylviolet and luxol fast blue): minimal = grade 1, moderate = grade 2 and marked = grade 3.
2.13. Statistical analysis
Blood lymphocyte results are presented as means ± SEM; EAE scores are presented as means ± SEM. Statistical analyses were performed by Student's t test using Graph Pad Prism (v5) where indicated. Statistical analysis of EAE scores and histopathological evaluation was performed using the Kruskal‐Wallis analysis of variance (ANOVA) with Dunn's multiple comparison test for differences between groups. Results were considered significant at P < .05.
3. RESULTS
3.1. In vitro S1P1 receptor modulator potency and selectivity
The receptor‐binding profile of cenerimod, (S)‐3‐(4‐(5‐(2‐cyclopentyl‐6‐methoxypyridin‐4‐yl)‐1,2,4‐oxadiazol‐3‐yl)‐2‐ethyl‐6‐methylphenoxy)propane‐1,2‐diol (Figure 1), was evaluated and compared with the activity of the natural ligand S1P20 and the nonselective synthetic S1P receptor agonist pFTY720,21 using (35S)‐GTPγS assays for human recombinant S1P1‐5 receptor subtypes (Table 1). Cenerimod was a highly potent (EC50 = 1 nM) and selective S1P1 receptor agonist, with a 16‐fold higher potency on the S1P1 receptor compared to the natural ligand S1P and similar maximal effect. In contrast to S1P and pFTY720, cenerimod displayed no detectable agonist activity on the S1P2 receptor up to the highest tested concentration (10 μmol·L‐1), which was confirmed in cellular assays (Figure S1). Cenerimod was at least 2000‐fold less active at the S1P3 receptor (EC50 = 228 nmol·L‐1) than S1P (EC50 = 0.1 nmol·L‐1) and 400‐fold less active at the S1P3 receptor than pFTY720 (EC50 = 0.5 nmol·L‐1). Cenerimod displayed weak activity at the S1P4 receptor (EC50 = 2.1 μmol·L‐1) with a 30‐ to 35‐fold lower potency than S1P (EC50 = 60 nmol·L‐1) or pFTY720 (EC50 = 64 nM). Cenerimod was twofold more potent on the S1P5 receptor (EC50 = 36 nmol·L‐1) than the natural ligand S1P (EC50 = 67 nmol·L‐1), but 70‐fold less potent than pFTY720 (EC50 = 0.5 nmol·L‐1). Cenerimod also showed high potency on rat and mouse S1P1 receptors and pronounced selectivity over S1P3 receptors (Table S1). The data demonstrate that cenerimod is a selective S1P1 receptor modulator that exhibits a pronounced selectivity over the S1P2, S1P3, and S1P4 receptor subtypes.
Figure 1.
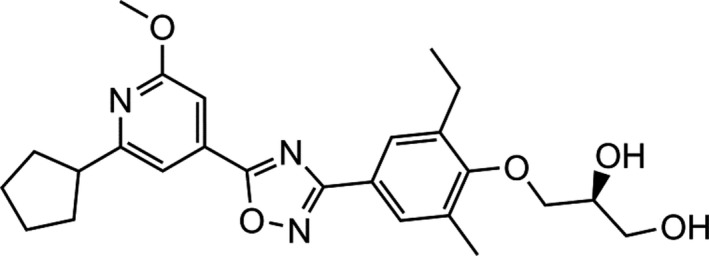
The chemical structure of cenerimod. ((S)‐3‐(4‐(5‐(2‐cyclopentyl‐6‐methoxypyridin‐4‐yl)‐1,2,4‐oxadiazol‐3‐yl)‐2‐ethyl‐6‐methylphenoxy)propane‐1,2‐diol), C25H31N3O5 (molecular weight 453.54)
Table 1.
In vitro potency and maximal effect of cenerimod, pFTY720 and S1P on the S1P receptor family
| hS1P1 | hS1P2 | hS1P3 | hS1P4 | hS1P5 | ||
|---|---|---|---|---|---|---|
| Cenerimod | EC50 | 1 | >10 000 | 228 | 2134* | 36 |
| 95% CI | 0.4‐3 | n.a. | 112‐465 | 1826‐2494 | 18‐74 | |
| E max (%) | 126 | n.a. | 81 | 123 | 65 | |
| pFTY720 | EC50 | 0.3 | 1484 | 0.5 | 64* | 0.5 |
| 95% CI | 0.1‐1.2 | 418‐5265 | 0.2‐1.6 | 13‐319 | 0.1‐5.6 | |
| E max (%) | 97 | 11 | 107 | 109 | 43 | |
| S1P | EC50 | 16 | 22 | 0.1 | 60* | 67 |
| 95% CI | 3‐97 | 6‐91 | 0.04‐0.4 | 31‐118 | 17‐265 | |
| E max (%) | 100 | 100 | 100 | 100 | 100 |
Membrane preparations of Chinese Hamster Ovary (CHO) cells, overexpressing human S1P1, S1P2, S1P3, S1P4, and S1P5 receptors, were used to perform (35S)‐GTPγS incorporation assays to quantify S1P receptor‐mediated G protein activation. EC50 values are expressed as geometric mean and 95% confidence interval (CI) in nmol·L‐1. The maximal effect (E max) is expressed as a percentage of the maximal response induced by 1 μmol·L‐1 or 10 μmol·L‐1 S1P (n = 5; values marked by * indicate n = 2‐4). n.a., not applicable.
Next, the activity of cenerimod on intracellular signaling was studied. It was compared to that of S1P and pFTY720, using (35S)‐GTPγS and cellular Ca2+ signaling assays in human primary umbilical vein endothelial cells (HUVEC), which naturally and predominantly express high S1P1 receptor levels (Figure S2).22 As shown in Table 2, cenerimod and pFTY720 were highly potent S1P receptor agonists in (35S)‐GTPγS assays using HUVEC cell membrane preparations and S1P was less potent. However, whereas S1P and pFTY720 preserved a similar or higher potency for inducing Ca2+ signaling in HUVEC compared to (35S)‐GTPγS binding, cenerimod was much less potent (approximately 500‐fold) in Ca2+ signaling than in (35S)‐GTPγS assays. Interestingly, p‐amiselimod, the active metabolite of amiselimod,23 and siponimod,24 two other recently described selective S1P1 receptor agonists in clinical development, were also devoid of such a pronounced pathway bias (Table S2), suggesting that cenerimod is indeed different. The Ca2+ signaling responses in HUVEC were pertussis toxin sensitive and fully blocked by the selective S1P1 receptor antagonist TASP027730825 (Figure S3). In CHO cells, expressing recombinant human S1P1 receptor, a pronounced potency shift between (35S)‐GTPγS and Ca2+ signaling was again observed for cenerimod (EC50 (GTPγS) 1 nmol·L‐1 and EC50 (Ca2+) 124 nmol·L‐1), but not for pFTY720 (EC50 (GTPγS) 0.3 nmol·L‐1 and EC50 (Ca2+) 3.6 nmol·L‐1).
Table 2.
Potency and maximal effect of cenerimod, pFTY720 and S1P in primary human endothelial cells
| GTPγS | Ca2+ | ||
|---|---|---|---|
| Cenerimod | EC50 | 2 | 1042 |
| 95% CI | 1‐7 | 521‐2086 | |
| E max (%) | 81 | 37 | |
| pFTY720 | EC50 | 9 | 10.4 |
| 95% CI | 2‐34 | 3.2‐34 | |
| E max (%) | 96 | 44 | |
| S1P | EC50 | 119 | 34 |
| 95% CI | 38‐368 | 8.4‐138 | |
| E max (%) | 100 | 100 |
Human umbilical vein endothelial cells (HUVEC) were used to quantify S1P1 receptor‐mediated activity in (35S)‐GTPγS and Ca2+‐mobilization assays. EC50 values are expressed as geometric mean and 95% confidence interval (CI) in nmol·L‐1. The maximal effect (E max) is expressed as a percentage of the maximal response induced by 10 μmol·L‐1 S1P or 200 nmol·L‐1 S1P (n = 5; values marked by * indicate n = 3‐4).
3.2. Cenerimod caused no vasoconstriction ex vivo and in vivo
To evaluate the potential for vasoconstriction, cenerimod and pFTY720 were compared in isolated rat mesenteric arteries. Cenerimod (10 μmol·L‐1) did not contract rat mesenteric arteries, whereas pFTY720 caused a concentration‐dependent contraction, which was statistically significant at 1 nM concentration and above (Figure 2).
Figure 2.
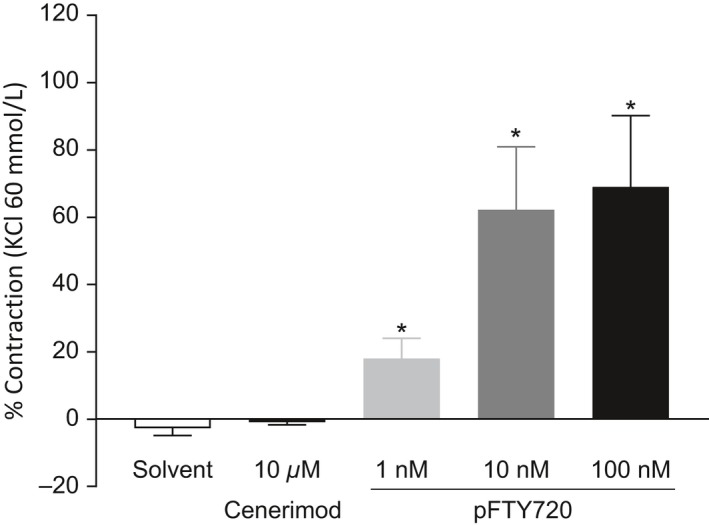
Cenerimod does not induce contraction of rat mesenteric artery. Changes in force generation by rat mesenteric artery in response to cenerimod (10 μmol·L‐1) and pFTY720 (1 nmol·L‐1, 10 nmol·L‐1 or 100 nmol·L‐1) were measured. Data are shown as means ± SEM. Statistical analyses were performed by Student's t test with *P ≤ .05 compared to solvent control. n = 4
The in vivo effects of FTY720 and cenerimod on blood pressure were investigated in conscious SHR, using single oral doses of FTY720 (3 mg·kg‐1) or cenerimod (30 mg·kg‐1). These doses were ten times higher than the minimal dose that was required by both compounds to induce maximal lymphocyte reduction over 24 hours.21 Mean arterial blood pressure (MAP) was similar in all experimental groups at baseline. Within a 48 hours observation period, oral administration of FTY720 increased MAP by 12 ± 2 mmHg, whereas cenerimod moderately decreased MAP by 9 ± 3 mmHg (Figure 3A and B). Cenerimod showed no effect on heart rate (HR), whereas FTY720 slightly decreased HR by 26 ± 8 bpm.
Figure 3.
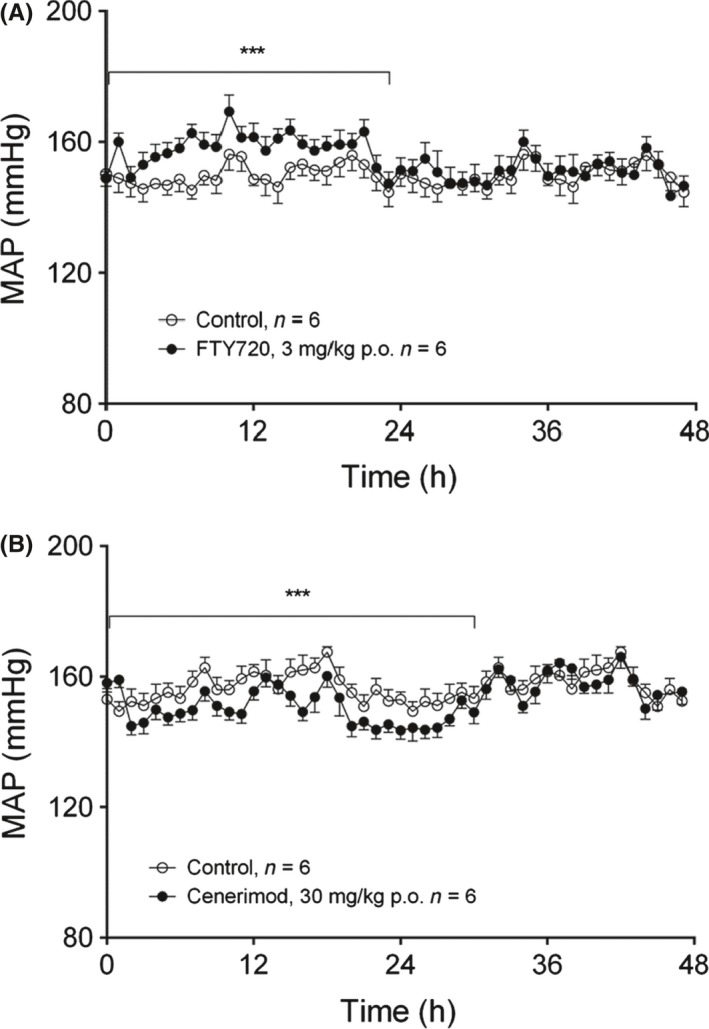
Cenerimod induced a moderate blood pressure decrease in vivo. The effects of single oral administration of FTY720 (3 mg·kg‐1) or cenerimod (30 mg·kg‐1) on mean arterial pressure (MAP) (A, B) were measured in conscious spontaneous hypertensive rats using telemetry. Statistical analysis was performed using a paired Student's t‐test 24 hours before vs 24 to 30 hours after the treatment with *P ≤ .05, **P ≤ .01, ***P ≤ .001
3.3. Cenerimod caused no bronchoconstriction ex vivo and in vivo
As it is known that the nonselective S1P receptor modulator FTY720 induces bronchoconstriction in animals and humans,4, 26 we assessed the potential of cenerimod to induce bronchoconstriction ex vivo and in vivo. We first determined the mRNA expression levels of all S1P1‐5 receptor subtypes in rings from the upper rat trachea, lower rat trachea and right rat bronchus by using quantitative PCR (Figure 4A). Moderate S1P1 and S1P2 receptor mRNA expression was observed in all sections, with a slightly higher S1P1 receptor expression in bronchi than in upper trachea. In contrast, S1P3 receptor expression was moderate in the upper trachea but its abundance significantly increased almost threefold toward the lower trachea and almost fourfold in bronchi. Very low expression of the S1P4 and S1P5 receptor subtypes was detected in upper and lower trachea or bronchi. Consistent with this expression pattern, we observed S1P‐induced lower rat trachea constriction (Figure 4B) that was inhibited by the selective S1P1 receptor antagonist TASP027730825 and the selective S1P3 receptor antagonist TY52156.7 The S1P‐induced constriction was fully abolished in absence of extracellular Ca2+.
Figure 4.
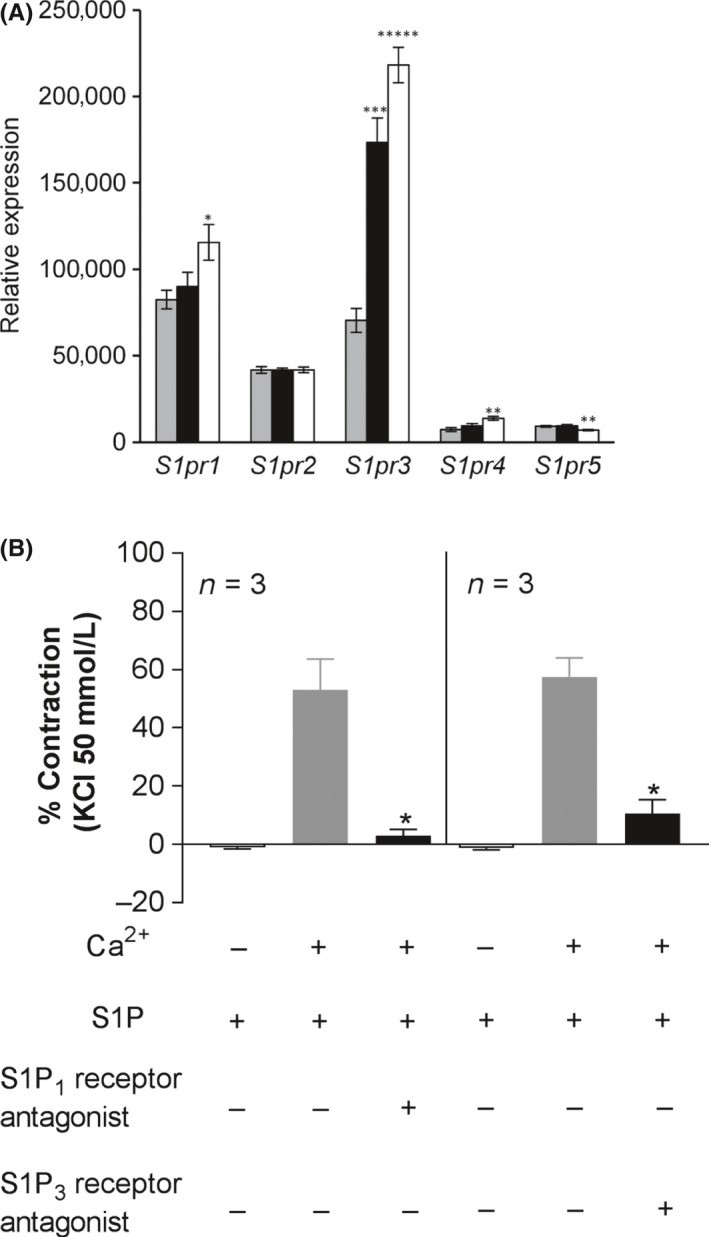
Differential airway S1P1‐5 receptor mRNA expression and functionality. (A) S1P1‐5 receptor expression was determined by quantitative PCR in upper (gray bars) and lower (black bars) rat trachea and right bronchi (white bars). Data are shown as means ± SEM (n = 6). Statistical comparison was performed using Student's unpaired t test (two‐tailed) with *P ≤ .05, **P ≤ .01, ***P ≤ .001, ****P ≤ .0001 vs expression in the upper trachea (gray bars). (B) Tracheal rings (5 mm wide) were suspended under a resting force of 4.9 mN in aerated tissue baths at 37°C and changes in force generation were measured using an isometric force recorder. Responses to S1P (1 μmol·L‐1) were measured in the absence or presence of Ca2+ (2.5 mmol·L‐1), 10 μmol·L‐1 S1P1 receptor antagonist (TASP0277308) or 10 μmol·L‐1 S1P3 receptor antagonist (TY52156). Contraction of tracheal rings is expressed as % of response to a maximal depolarizing concentration of KCl (50 mmol·L‐1). Data are shown as means ± SEM. Statistical analyses were performed by Student's paired t test with *P ≤ .05 compared to S1P in the presence of Ca2+ n = 3
Next, the effects of cenerimod and pFTY720 were evaluated in isolated rat trachea constriction experiments using upper and lower trachea segments and in bronchi. A complete lack of response was observed with cenerimod in the upper and lower trachea even at the highest tested concentration (10 μmol·L‐1) (Figure 5A). In contrast, pFTY720 induced a concentration‐dependent contractile response in the upper trachea with an even more pronounced response in lower trachea (Figure 5B). Similar results were seen in isolated rat bronchus (data not shown). Interestingly, the active metabolite of amiselimod (p‐amiselimod), which is a potent and selective S1P1 receptor agonist with Ca2+ signaling activity,23 also induced effective rat trachea constriction at 1 μmol·L‐1 and 10 μmol·L‐1 (Figure S4). To extend these studies, we performed concentration response experiments in human bronchi. pFTY720 contracted human bronchi in a concentration‐dependent manner (pEC50: 6.4 ± 0.5 and E max: 86.5 ± 20.2%, n = 4), whereas cenerimod caused no contraction of human bronchi at 10 μmol·L‐1. The bronchoconstrictive potential of cenerimod and FTY720 was then evaluated in Wistar rats, using enhanced pause (Penh) as an index of bronchoconstriction. Cenerimod (100 mg·kg‐1 p.o.) did not increase Penh values in comparison to vehicle during the 4 hours evaluation period, suggesting an absence of bronchoconstriction (Figure 6). In contrast, single oral administration of FTY720 (3 or 10 mg·kg‐1 p.o.) induced significant dose‐dependent increases in Penh (Figure 6). The plasma concentration of cenerimod, measured 4 hours after oral administration, was 4.4 ± 0.6 μg·mL‐1. This concentration is at least 70‐times higher than the minimal concentration needed to maintain maximal reduction of lymphocyte counts in rats (60 ng·mL‐1, see below).
Figure 5.
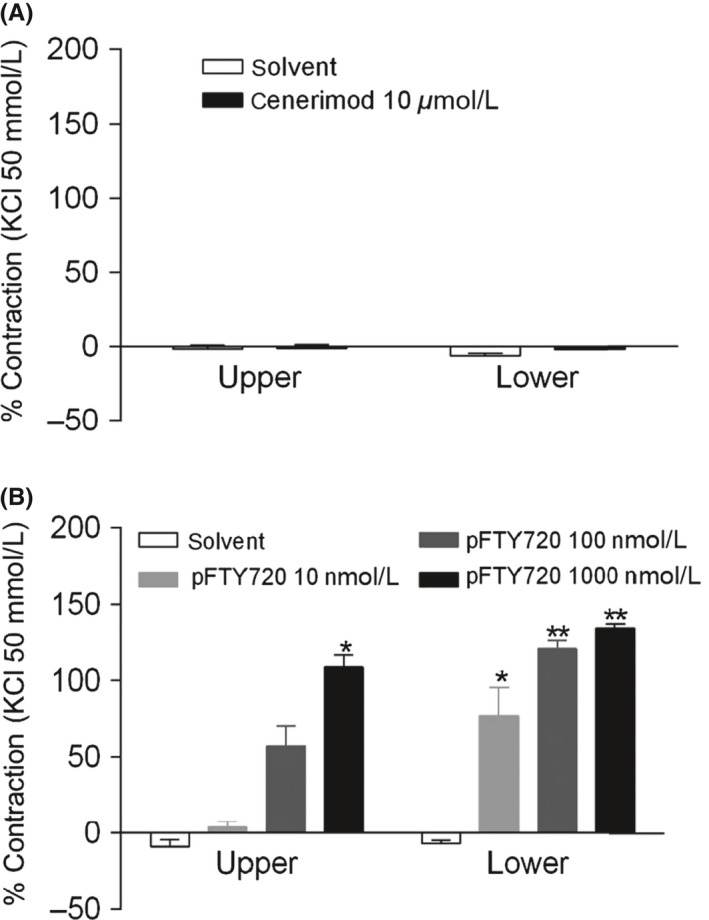
Cenerimod does not induce rat trachea ring contraction. Trachea rings (5 mm wide) were suspended under a resting force of 4.9 mN in aerated tissue baths at 37°C. Changes in force generation were measured using an isometric force recorder after addition (A) cenerimod (10 μmol·L‐1) (B) pFTY720 (10 nmol·L‐1, 100 nmol·L‐1 or 1000 nmol·L‐1). Viability of tracheal rings was assessed by exposure to a depolarizing concentration of KCl (50 mmol·L‐1). Data are shown as means ± SEM. Statistical analyses were performed by Student's t test with *P ≤ .05, **P ≤ .01 compared to solvent control. n = 4
Figure 6.
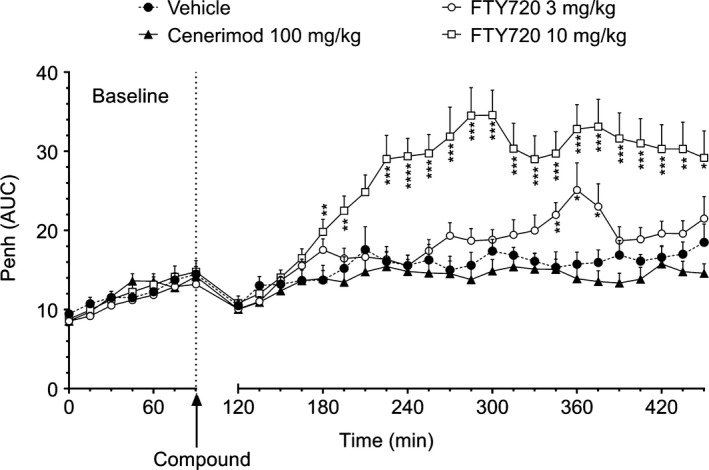
Cenerimod does not induce bronchoconstriction (Penh) in vivo. Wistar rats were treated with a single oral dose of cenerimod (100 mg·kg‐1) or FTY720 (3 mg·kg‐1 and 10 mg·kg‐1) (n = 10 per group). Results are expressed as Penh AUC and shown as means ± SEM. Statistical analyses were performed by Student's t test with *P ≤ .05, **P ≤ .01, ***P ≤ .001, ****P ≤ .0001 vs vehicle
3.4. Cenerimod reversibly reduced blood lymphocyte counts
Cenerimod caused a dose‐dependent reduction in the number of circulating lymphocytes in rats, with a plateau reached after a single oral dose of 1 mg·kg‐1. Blood lymphocyte counts decreased from 7900 ± 690 to 2900 ± 370 lymphocytes/μL, corresponding to a decrease of 63 ± 4%; P ˂ .001 (Figure 7). The duration of lymphocyte count reduction was also dose‐dependent. At 1 mg·kg‐1, the lymphocyte count returned to predose levels within 48 hours, whereas at 3 mg·kg‐1 the blood lymphocyte count was still reduced by more than 40% at 48 hours. At a dose of 10 mg·kg‐1, the peripheral blood lymphocyte count was still maximally reduced by 65 ± 3% after 48 hours (Figure 7). The plasma concentration of cenerimod increased in a dose‐dependent manner and reached a maximum at 3 hours after dosing. At the time of maximal lymphocyte count reduction (6 hours), plasma concentrations ranged from 41 ± 2 ng·mL‐1 (1 mg·kg‐1) to 869 ± 73 ng·mL‐1 (10 mg·kg‐1) (Table S3). A more detailed analysis correlating blood lymphocyte counts and compound plasma concentrations from individual rats suggested that a minimal plasma concentration of approximately 60 ng·mL‐1 (132 nmol·L‐1) was needed to maintain maximum lymphocyte count reduction (Figure S5). Repeated oral dosing of 1 or 3 mg·kg‐1·day‐1cenerimod in rats for 7 days showed that the circulating lymphocyte count was maximally reduced 3 hours following the last dose, which was very similar to single oral dosing, and this effect was maintained for 24 hours. The lymphocyte count returned to physiological levels within 2 or 4 days after the last dose, respectively (data not shown). The blood lymphocyte count reducing effects of cenerimod were also investigated in mice. The effect after a single dose of cenerimod (Figure S6A/B) indicated that maximal lymphocyte count reduction over 24 hours was achieved at a plasma concentration of 30 ng·mL‐1 (66 nmol·L‐1) or higher. After administration of three repeated doses of 6 mg·kg‐1·day‐1, both lymphocyte count and plasma concentrations did not differ significantly between day 0 and day 2, indicating absence of compound accumulation in mice at this dose (data not shown).
Figure 7.
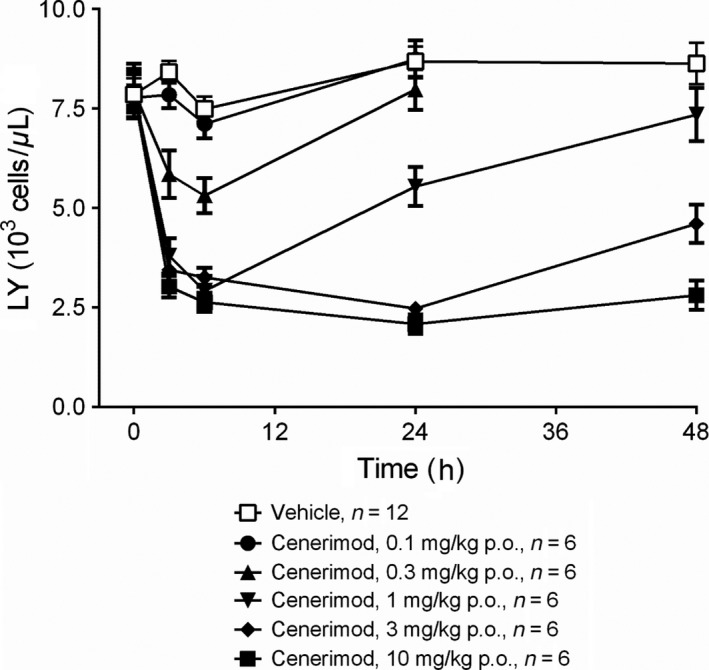
Effective and reversible lymphocyte count reduction by cenerimod in rats. Effect of single oral administration of cenerimod (0.1, 0.3, 1, 3, 10 mg·kg‐1 p.o.) or vehicle on circulating lymphocyte count (LY) in Wistar rats 3, 6, 24 and 48 hours after dosing. Datapoints are expressed as means ± SEM. n = 6‐12
3.5. Cenerimod‐attenuated disease in the mouse EAE model
Cenerimod was studied in MOG33‐55 peptide‐induced, monophasic and chronic EAE model in C57BL/6 mice.27 A clear increase in clinical scores was observed in vehicle‐treated mice compared to naïve mice without MOG33‐55 peptide‐induced EAE. Five out of eight mice that were treated with cenerimod (6 mg·kg‐1·day‐1), starting from the day of MOG33‐55 injection (“preventive treatment”), were completely protected from disease development (Figure 8A). The remaining three mice developed disease, two mice reaching maximal clinical scores of 2.5 and 3.0 and one mouse reached a mild clinical score of 0.5.
Figure 8.
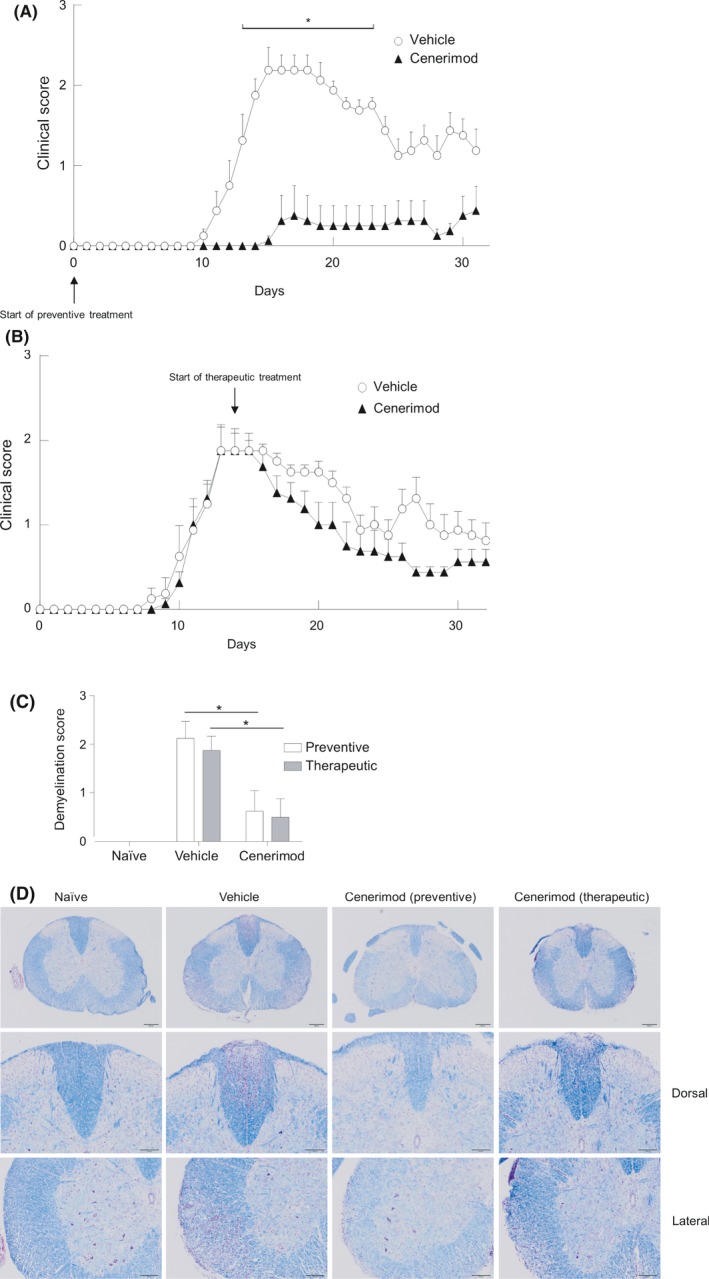
Beneficial effect of cenerimod in a mouse experimental autoimmune encephalitis model. (A) Female C57BL/6 mice were administered vehicle (0.25% methylcellulose +0.05% Tween 80 in water) (open circles) or 6 mg·kg‐1·day‐1 cenerimod (closed triangles) dosing starting on day 0 (“preventive”). (B) Cenerimod dosing was started at day 14 (“therapeutic”). Data are presented as mean clinical score ± SEM (n = 8). Statistical analysis (*P < .05) was performed using the Kruskal‐Wallis test with Dunn's test for multiple comparisons. (C) Reduced spinal cord demyelination in cenerimod‐treated animals. Nine segments of spinal cord were stained with cresylviolet and luxol fast blue and demyelination was assessed as: minimal = grade 1, moderate = grade 2 and marked = grade 3 (n = 8). Statistical analysis (*P < .05) was performed using the Kruskal‐Wallis test with Dunn's test for multiple comparisons. (D) Representative photographs show cresylviolet and luxol fast blue‐stained spinal cord sections of naïve, vehicle‐treated and cenerimod (“preventive”) and cenerimod (“therapeutic”)‐treated animals, using low (4x, upper panel) and high magnification (10x, middle and lower panel). Intense cresylviolet staining in vehicle‐treated disease animals indicates marked demyelination. Cenerimod (“preventive”)‐ and cenerimod (“therapeutic”)‐treated animals displayed reduced cresylviolet staining at low magnification (upper) and high magnification (middle and lower panel). Bar = 1 μm
Mice that were treated with cenerimod starting from the time of maximal disease severity, ie 14 days after MOG33‐55 injection (“therapeutic treatment”), showed a faster improvement of clinical signs compared to vehicle‐treated mice and the average clinical score was lower (Figure 8B). All cenerimod‐treated mice reached a maximum reduction to a clinical score of 0.5. Six out of eight mice reached a score of 0.5 within 6 days and two mice reached the disease score of 0.5 within 11 days after treatment initiation. Cenerimod‐treated mice maintained this overall low clinical score throughout the observation period, while transitory increases of clinical score late in the study were observed in vehicle‐treated mice. Interestingly, histopathological evaluation revealed that the incidence and severity of spinal cord demyelination was equally reduced in mice treated with either a “preventive” or “therapeutic” regimen (Figure 8C and D).
4. DISCUSSION
Sphingosine‐1‐phosphate receptor 1 (S1P1) modulation has been successfully applied for the treatment of remitting forms of multiple sclerosis (RMS), leading to the approval of the first oral, nonselective S1P1‐5 receptor modulator (FTY720/fingolimod/Gilenya®). This attractive concept holds promise to treat other autoimmune‐related diseases such as psoriasis, ulcerative colitis, or systemic lupus erythematosus. However, signaling through the S1P1 receptor is not unique to lymphocytes but is also found in endothelial cells and cardiomyocytes, where S1P1 receptors are also expressed. Furthermore, the S1P receptor family consists of five members with divergent tissue expression. Consequently, nonselective S1P1 receptor modulators were shown to be associated with adverse events, including bradycardia, atrioventricular conduction block, mild hypertension, and dyspnea.3, 4, 17, 21, 22, 28, 29, 30
Here, we show that cenerimod is a novel, potent and selective S1P1 receptor modulator with unique signaling properties. Cenerimod, in comparison to S1P and pFTY720, was devoid of S1P2 receptor agonism in (35S)‐GTPγS assays up to the highest tested concentration. S1P2 receptor agonism can be difficult to detect in (35S)‐GTPγS assays, because the receptor is prone to signal through the Gα12/13 protein pathway, as recently shown for pFTY720.9 However, cenerimod showed no S1P2 receptor agonist activity even in more sensitive assays.
Unexpectedly, cenerimod displayed a pronounced S1P1 receptor‐mediated pathway bias in cells expressing recombinant S1P1 receptors and in nonrecombinant human endothelial cells, leading to a substantially attenuated intracellular Ca2+‐ mobilization response, despite high potency in (35S)‐GTPγS assays. Neither pFTY720, p‐amiselimod, siponimod nor the natural ligand S1P displayed such a pathway bias, suggesting that cenerimod displays unique S1P1 receptor signaling properties. Ca2+ signaling in endothelial cells has a multitude of physiological and pathophysiological roles.31, 32 S1P1 receptor‐mediated Ca2+ signaling was described in cardiomyocytes,33 aortic smooth muscle cells 34 and human umbilical vein endothelial cells,35 suggesting that Ca2+ signaling is a physiological response and a potentially important second messenger pathway. Selective S1P1 receptor pathway activation, in addition to S1P receptor subtype selectivity, might thus lead to distinct pharmacological profiles of different selective S1P1 receptor modulators. During the medicinal chemistry program leading to cenerimod, we screened compounds for their potential to cause vasoconstriction, using isometric force measurements on isolated rat mesenteric arteries, and bronchoconstriction, using isolated rat trachea, rat bronchi and isolated human bronchi. We demonstrate here that cenerimod, unlike pFTY720, neither constricted rat mesenteric arteries or rat trachea, nor human bronchi. The low ex vivo bronchoconstricting potential of cenerimod was confirmed in vivo at plasma concentrations that were almost 70‐fold higher than the minimal concentration required to maintain maximal lymphocyte reduction. Previous studies had suggested that the bronchoconstricting activity in mice, and possibly also in rats, is due to S1P3 receptor activation. However, we demonstrate here that rat airways display a complex regional expression pattern of different S1P receptor subtypes and that both S1P1 and S1P3 receptor activation can induce Ca2+ signaling‐dependent trachea constriction. It is thus conceivable that the interplay of several S1P receptor subtypes and distinct signaling pathways influence physiological airway responses. In support of this hypothesis, we show that the nonselective, Ca2+ signaling S1P1‐5 receptor agonist pFTY720 induces pronounced bronchoconstriction ex vivo and in vivo, as reported previously,36, 37 and in addition we now show that the selective, Ca2+ signaling S1P1 receptor agonist p‐amiselimod 23 also leads to bronchoconstriction.
We also investigated the potential of cenerimod to influence mean arterial blood pressure in vivo and found that at doses exceeding ten times the doses that are required to induce maximal reduction of circulating lymphocytes, cenerimod did not induce an increase in blood pressure, but rather a moderate reduction in mean arterial blood pressure. This was in contrast to FTY720, which showed a mean arterial blood pressure increase also at a dose that was approximately ten times above the dose that is required to induce maximal lymphocyte count reduction21 (data not shown). Together, these data demonstrate that cenerimod, unlike FTY720, lacked vasoconstricting and bronchoconstricting potential in our test systems. Our data thus show that cenerimod has a particularly favorable profile ex vivo and in vivo, which might be attributed to the unique combination of S1P1 receptor selectivity and S1P1 receptor signaling bias .
EAE reproduces some, but not all, pathophysiological hallmarks of human RMS. However, the EAE model is suitable for the study of histopathological features, including inflammation, demyelination, and neurodegeneration. As such the model can instruct about the mechanism of action on immunopathogenesis much more than it can predict efficacy in humans.4, 17 The pathobiological mechanisms of CNS atrophy include both immune and nonimmune mechanisms of neuronal degeneration. While the important contribution of CD4+ T cells is undisputed, recognition of new roles of CD8+ T cells, B cells and innate immunity are shifting the paradigm of MS pathophysiology. Cenerimod demonstrated a dose‐dependent efficacy and duration of lymphocyte count reduction that was fully reversible upon dosing discontinuation. It is currently assumed that maximal lymphocyte count reduction is required to achieve maximal efficacy in animal models of autoimmune disease.3 Treatment of EAE mice with cenerimod at 6 mg·kg‐1, which corresponds to a dose that induces maximal lymphocyte count reduction, was efficacious in preventing disease onset and progression. Therapeutic intervention, ie when dosing was initiated at the peak of disease induction, showed a trend to ameliorate disease scores, although statistical significance was not reached. Interestingly, both preventive and therapeutic treatment significantly reduced demyelination, suggesting that clinical scores and demyelination do not fully correlate. Treatment with cenerimod led to clinical and histological efficacy in the mouse EAE model, confirming the importance of lymphocyte sequestration in preventing CNS damage. We show here that the development of a potent, selective and Ca2+‐signaling‐deficient S1P1 receptor modulator, cenerimod, may provide reversible immune‐modulation with a significantly reduced burden of adverse events in patients with autoimmune diseases.
AUTHOR CONTRIBUTIONS
Participated in research design: Piali, Birker‐Robaczewska, Froidevaux, Schmitz, Morrison, Kohl, Rey, Studer, Hess, Steiner, Nayler, Bolli, Vezzali; Conducted experiments: Schmitz, Rey, Studer, Birker‐Robaczewska; Contributed new reagents or analytic tools: Lescop, Bolli; Performed data analysis: Piali, Birker‐Robaczewska, Kohl, Lescope, Nayler, Clozel, Steiner, Bolli, Morrison, Froidevaux, Rey, Hess, Vezzali, Studer, Schmitz; Wrote or contributed to the writing of the manuscript: Nayler, Piali, Birker‐Robaczewska, Kohl, Clozel, Steiner, Bolli, Studer, Vezzali, Hess, Morrison, Froidevaux, Rey.
DISCLOSURES
All experiments described in this report have been conducted in the research facilities of Actelion Pharmaceuticals Ltd and all authors acknowledge that the work was performed as employees of Actelion Pharmaceuticals Ltd. During manuscript preparation and review, Actelion Pharmaceuticals Ltd. was acquired by Johnson & Johnson, and its drug discovery and early development activities subsequently transferred into a newly created company, Idorsia Pharmaceuticals Ltd.
Supporting information
ACKNOWLEDGEMENTS
The authors especially thank Jeremy Scherer, Virginie Sippel, Matthias Bolinger, Sylvie Poirey, Maxime Boucher, Jennifer Brandes, Roland Ernst, Franck Haag, Odette Birko, Manuela Schläpfer and Markus Kramberg for experimental support and Hashem Salloukh for proof reading the manuscript. All acknowledged persons are employees of Idorsia Pharmaceuticals Ltd.
Piali L, Birker‐Robaczewska M, Lescop C, et al. Cenerimod, a novel selective S1P1 receptor modulator with unique signaling properties. Pharmacol Res Perspect. 2017;e00370 https://doi.org/10.1002/prp2.370
BS, MHB, and ON are senior authors and contributed equally to this research
REFERENCES
- 1. Hla T, Brinkmann V. Sphingosine 1‐phosphate (S1P): physiology and the effects of S1P receptor modulation. Neurology. 2011;76:S3‐S8. [DOI] [PubMed] [Google Scholar]
- 2. Pinschewer DD, Brinkmann V, Merkler D. Impact of sphingosine 1‐phosphate modulation on immune outcomes. Neurology. 2011;76:S15‐S19. [DOI] [PubMed] [Google Scholar]
- 3. D'Ambrosio D, Freedman MS, Prinz J. Ponesimod, a selective S1P1 receptor modulator: a potential treatment for multiple sclerosis and other immune‐mediated diseases. Ther Adv Chronic Dis. 2016;7:18‐33. [DOI] [PMC free article] [PubMed] [Google Scholar]
- 4. Cohen JA, Barkhof F, Comi G, et al. Oral fingolimod or intramuscular interferon for relapsing multiple sclerosis. N Engl J Med. 2010;362:402‐415. [DOI] [PubMed] [Google Scholar]
- 5. Camm J, Hla T, Bakshi R, Brinkmann V. Cardiac and vascular effects of fingolimod: mechanistic basis and clinical implications. Am Heart J. 2014;168:632‐644. [DOI] [PubMed] [Google Scholar]
- 6. Koyrakh L, Roman MI, Brinkmann V, Wickman K. The heart rate decrease caused by acute FTY720 administration is mediated by the G protein‐gated potassium channel I. Am J Transplant. 2005;5:529‐536. [DOI] [PubMed] [Google Scholar]
- 7. Murakami A, Takasugi H, Ohnuma S, et al. Sphingosine 1‐phosphate (S1P) regulates vascular contraction via S1P3 receptor: investigation based on a new S1P3 receptor antagonist. Mol Pharmacol. 2010;77:704‐713. [DOI] [PubMed] [Google Scholar]
- 8. Salomone S, Potts EM, Tyndall S, et al. Analysis of sphingosine 1‐phosphate receptors involved in constriction of isolated cerebral arteries with receptor null mice and pharmacological tools. Br J Pharmacol. 2008;153:140‐147. [DOI] [PMC free article] [PubMed] [Google Scholar]
- 9. Sobel K, Monnier L, Menyhart K, et al. FTY720 Phosphate Activates Sphingosine‐1‐Phosphate Receptor 2 and Selectively Couples to Galpha12/13/Rho/ROCK to Induce Myofibroblast Contraction. Mol Pharmacol. 2015;87:916‐927. [DOI] [PubMed] [Google Scholar]
- 10. NDA 02257 . FDA Approved Labeling Text for Gilenya (fingolimod) capsules. 2010. http://www.accessdata.fda.gov/drugsatfda_docs/label/2010/022527s000lbl.pdf (accessed September 2012)
- 11. Chiba Y, Takeuchi H, Sakai H, Misawa M. Sphingosine‐1‐phosphate augments agonist‐mediated contraction in the bronchial smooth muscles of mice. Pharmacol Rep. 2011;63:544‐547. [DOI] [PubMed] [Google Scholar]
- 12. Roviezzo F, Di Lorenzo A, Bucci M, et al. Sphingosine‐1‐phosphate/sphingosine kinase pathway is involved in mouse airway hyperresponsiveness. Am J Respir Cell Mol Biol. 2007;36:757‐762. [DOI] [PubMed] [Google Scholar]
- 13. Ammit AJ, Hastie AT, Edsall LC, et al. Sphingosine 1‐phosphate modulates human airway smooth muscle cell functions that promote inflammation and airway remodeling in asthma. FASEB J. 2001;15:1212‐1214. [DOI] [PubMed] [Google Scholar]
- 14. Rosenfeldt HM, Amrani Y, Watterson KR, Murthy KS, Panettieri RA Jr, Spiegel S. Sphingosine‐1‐phosphate stimulates contraction of human airway smooth muscle cells. FASEB J. 2003;17:1789‐1799. [DOI] [PubMed] [Google Scholar]
- 15. Sobel K, Menyhart K, Killer N, et al. Sphingosine 1‐phosphate (S1P) receptor agonists mediate pro‐fibrotic responses in normal human lung fibroblasts via S1P2 and S1P3 receptors and Smad‐independent signaling. J Biol Chem. 2013;288:14839‐14851. [DOI] [PMC free article] [PubMed] [Google Scholar]
- 16. Schmidt G, Bolli MH, Lescop C, Abele S. Practical Synthesis of a S1P Receptor 1 Agonist via a Guareschi–Thorpe Reaction. Org Process Res Dev. 2016;20:1637‐1646. [Google Scholar]
- 17. Bolli MH, Abele S, Binkert C, et al. 2‐imino‐thiazolidin‐4‐one derivatives as potent, orally active S1P1 receptor agonists. J Med Chem. 2010;53:4198‐4211. [DOI] [PubMed] [Google Scholar]
- 18. Morrison K, Ernst R, Hess P, Studer R, Clozel M. Selexipag: a selective prostacyclin receptor agonist that does not affect rat gastric function. J Pharmacol Exp Ther. 2010;335:249‐255. [DOI] [PubMed] [Google Scholar]
- 19. Spond J, Billah MM, Chapman RW, et al. The role of neutrophils in LPS‐induced changes in pulmonary function in conscious rats. Pulm Pharmacol Ther. 2004;17:133‐140. [DOI] [PubMed] [Google Scholar]
- 20. Lee MJ, Van Brocklyn JR, Thangada S, et al. Sphingosine‐1‐phosphate as a ligand for the G protein‐coupled receptor EDG‐1. Science. 1998;279:1552‐1555. [DOI] [PubMed] [Google Scholar]
- 21. Brinkmann V, Davis MD, Heise CE, et al. The immune modulator FTY720 targets sphingosine 1‐phosphate receptors. J Biol Chem. 2002;277:21453‐21457. [DOI] [PubMed] [Google Scholar]
- 22. Hla T, Maciag T. An abundant transcript induced in differentiating human endothelial cells encodes a polypeptide with structural similarities to G‐protein‐coupled receptors. J Biol Chem. 1990;265:9308‐9313. [PubMed] [Google Scholar]
- 23. Sugahara K, Maeda Y, Shimano K, et al. Amiselimod, a novel sphingosine 1‐phosphate receptor‐1 modulator, has potent therapeutic efficacy for autoimmune diseases, with low bradycardia risk. Br J Pharmacol. 2017;174:15‐27. [DOI] [PMC free article] [PubMed] [Google Scholar]
- 24. Pan S, Gray NS, Gao W, et al. Discovery of BAF312 (Siponimod), a Potent and Selective S1P Receptor Modulator. ACS Med Chem Lett. 2013;4:333‐337. [DOI] [PMC free article] [PubMed] [Google Scholar]
- 25. Fujii Y, Hirayama T, Ohtake H, et al. Amelioration of collagen‐induced arthritis by a novel S1P1 antagonist with immunomodulatory activities. J Immunol. 2012;188:206‐215. [DOI] [PubMed] [Google Scholar]
- 26. Trifilieff A, Fozard JR. Sphingosine‐1‐phosphate‐induced airway hyper‐reactivity in rodents is mediated by the sphingosine‐1‐phosphate type 3 receptor. J Pharmacol Exp Ther. 2012;342:399‐406. [DOI] [PubMed] [Google Scholar]
- 27. Gold R, Linington C, Lassmann H. Understanding pathogenesis and therapy of multiple sclerosis via animal models: 70 years of merits and culprits in experimental autoimmune encephalomyelitis research. Brain. 2006;129:1953‐1971. [DOI] [PubMed] [Google Scholar]
- 28. An S, Goetzl EJ, Lee H. Signaling mechanisms and molecular characteristics of G protein‐coupled receptors for lysophosphatidic acid and sphingosine 1‐phosphate. J Cell Biochem Suppl. 1998;30–31:147‐157. [PubMed] [Google Scholar]
- 29. Bolli MH, Lescop C, Birker M, et al. Novel S1P1 receptor agonists ‐ Part 5: from amino‐ to alkoxy‐pyridines. Eur J Med Chem. 2016; 115:326‐341. [DOI] [PubMed] [Google Scholar]
- 30. Scott FL, Clemons B, Brooks J, et al. Ozanimod (RPC1063) is a potent sphingosine‐1‐phosphate receptor‐1 (S1P1) and receptor‐5 (S1P5) agonist with autoimmune disease‐modifying activity. Br J Pharmacol. 2016;173:1778‐1792. [DOI] [PMC free article] [PubMed] [Google Scholar]
- 31. Smedlund K, Bah M, Vazquez G. On the role of endothelial TRPC3 channels in endothelial dysfunction and cardiovascular disease. Cardiovasc Hematol Agents Med Chem. 2012;10:265‐274. [DOI] [PMC free article] [PubMed] [Google Scholar]
- 32. Taylor MS, Francis M, Qian X, Solodushko V. Dynamic Ca(2 + ) signal modalities in the vascular endothelium. Microcirculation. 2012;19:423‐429. [DOI] [PMC free article] [PubMed] [Google Scholar]
- 33. Keul P, van Borren MM, Ghanem A, et al. Sphingosine‐1‐Phosphate Receptor 1 Regulates Cardiac Function by Modulating Ca2 + Sensitivity and Na+/H+ Exchange and Mediates Protection by Ischemic Preconditioning. J Am Heart Assoc. 2016;5(5): e003393. [DOI] [PMC free article] [PubMed] [Google Scholar]
- 34. Lee MH, Appleton KM, El‐Shewy HM, et al. S1P in HDL promotes interaction between SR‐BI and S1PR1 and activates S1PR1‐mediated biological functions: calcium flux and S1PR1 internalization. J Lipid Res. 2017;58:325‐338. [DOI] [PMC free article] [PubMed] [Google Scholar]
- 35. Butler J, Lana D, Round O, LaMontagne K. Functional characterization of sphingosine 1‐phosphate receptor agonist in human endothelial cells. Prostaglandins Other Lipid Mediat. 2004;73:29‐45. [DOI] [PubMed] [Google Scholar]
- 36. Kahan BD. FTY720: from bench to bedside. Transplant Proc. 2004;36:531S‐543S. [DOI] [PubMed] [Google Scholar]
- 37. Li Z, Chen W, Hale JJ, et al. Discovery of potent 3,5‐diphenyl‐1,2,4‐oxadiazole sphingosine‐1‐phosphate‐1 (S1P1) receptor agonists with exceptional selectivity against S1P2 and S1P3. J Med Chem. 2005;48:6169‐6173. [DOI] [PubMed] [Google Scholar]
Associated Data
This section collects any data citations, data availability statements, or supplementary materials included in this article.
Supplementary Materials