Abstract
Psoraleae Fructus is the dry and mature fruit of leguminous plant Psoralea corylifolia L., with the activity of warming kidney and enhancing yang, warming spleen, and other effects. However, large doses can cause liver and kidney toxicity. Therefore, it is necessary to evaluate the toxicity of Psoraleae Fructus systematically. Although traditional biochemical indicators and pathological tests have been used to evaluate the safety of drug, these methods lack sensitivity and specificity, so a fast and sensitive analytical method is urgently needed. In this study, an ultraperformance liquid chromatography coupled with quadrupole time-of-flight mass spectrometry (UPLC-Q-TOF/MS) method was used to analyze the metabolic profiles of rat plasma. The changes of metabolites in plasma samples were detected by partial least squares-discriminant analysis (PLS-DA). Compared with the control group, after 7 days of administration, the pathological sections showed liver and kidney toxicity, and the metabolic trend was changed. Finally, 13 potential biomarkers related to the toxicity of Psoraleae Fructus were screened. The metabolic pathways involved were glycerol phospholipids metabolism, amino acid metabolism, energy metabolism, and so forth. The discovery of these biomarkers laid a foundation for better explaining the hepatotoxicity and nephrotoxicity of Psoraleae Fructus and provided a guarantee for its safety evaluation.
1. Introduction
Psoraleae Fructus is the dry and mature fruit of the leguminous plant Psoralea corylifolia L., with pungent flavor, slightly bitter, and attribution to kidney and spleen meridian [1]. It has antitumor [2], antioxidant [3], and other effects and has been clinically used as a tonic to treat osteoporosis [4], vitiligo [5], and so forth. Regardless of its therapeutic effects, high doses of Psoraleae Fructus have been reported to cause liver damage in clinic [6], and animal studies have shown that Psoraleae Fructus decoction following oral administration to rats caused hepatotoxicity and nephrotoxicity [7–9]. Thus concerns have risen about the safe medication of Psoraleae Fructus and the toxicity induced has attracted increasing attention. Traditional toxicity assessment method using biochemistry and histopathology lacks sensitivity and accuracy [8]. Therefore, it is urgent to establish a rapid and effective method to investigate toxicity induced by Psoraleae Fructus.
Metabonomics is a new research technique developed following genomics, transcriptome, and proteomics. It has become an important part of systematic biology [10]. It reflects the overall changes of the body through the metabolic changes of plasma, urine, and so on [11]. With the continuous progress of the discipline, untargeted metabonomics has been widely used in drug safety assessment and toxicity prediction and provided valuable information for drug-induced cardiotoxicity, hepatotoxicity, and nephrotoxicity [12–14].
In this study, toxicity induced by Psoraleae Fructus was assessed by using nontargeted metabonomic approach based on UPLC-Q-TOF/MS after intragastric administration of aqueous extract of Psoraleae Fructus to rats. Potential biomarkers of hepatotoxicity and nephrotoxicity of Psoraleae Fructus were screened by including multivariate statistical analysis. The sensitivity and specificity of biomarkers were evaluated with a receiver operating characteristic (ROC) curve. Finally, through metabolomic pathway analysis (MetPA), we screened the metabolic pathways regarding the toxicity of Psoraleae Fructus to explain the biological significance.
2. Materials and Methods
2.1. Reagents and Chemicals
Psoraleae Fructus was purchased from Beijing Heyanling Drug Herb Co, Ltd. (Beijing, China), and authenticated by the corresponding authors. HPLC-grade acetonitrile and formic acid were purchased from Oceanpak (Gothenburg, Sweden) and ROE (USA), respectively. Purified water was purchased from Wahaha Company (Hangzhou, China). Normal saline was provided by Qidu Pharmaceutical Co, Ltd. (Shandong, China).
2.2. Preparation of Psoraleae Fructus Aqueous Extract
50 g, 150 g, and 250 g crushed Psoraleae Fructus powders were weighted, respectively, and were extracted with 10 times the amount of purified water for the first time by reflux for 1 hour, followed by extraction with 8 times the amount of purified water for the second time by reflux for another 1 hour. After filtration, the filtrates were merged and concentrated to a concentration of 1.0 g/mL, 3.0 g/mL, and 5.0 g/mL (equivalent to the crude drug), respectively. The aqueous extracts were stored under 4°C before administration.
2.3. Animal Experiment
Twenty-four male Wistar rats weighing 190–210 g were provided by the Institute of Hygienic Environmental Medicine, Chinese Academy of Military Medical Sciences [SCXK (jing) 2012-0001], and were fed in the Animal Center of Tianjin Institute of Radiology (Tianjin, China). Rats were housed in SPF grade animal room at the ambient temperature of 23 ± 2°C and humidity 35 ± 5% with a 12 h dark-light cycle. After one week of adaptive feeding, the rats were randomly divided into four groups: normal control group (NS group), low dose of Psoraleae Fructus group (PLD group), medium dose of Psoraleae Fructus group (PMD group), and high dose of Psoraleae Fructus group (PHD group). Rats were orally administered with Psoraleae Fructus extract once daily at the dosage of 5 g/kg, 15 g/kg, and 25 g/kg for seven consecutive days for PLD group, PMD group, and PHD group, respectively. Rats for NS group were given normal saline. This experiment was approved by the Animal Ethics Committee of Tianjin University of Traditional Chinese Medicine. All experimental procedures were conducted in accordance with Chinese national legislation and local guidelines.
2.4. Sample Collection
Before the samples were collected, all animals were fasted for 12 hours but allowed to drink water to avoid the effects of food on the final outcome. After administration of 7 days (Day 8, morning), blood from both control group and different dosage groups was sampled via abdominal aorta, of which 5 mL was collected into heparinized test tube, and centrifuged at 3000 rpm for 15 min at 4°C to separate the supernatant, then the supernatant was centrifuged at 3500 rpm for 8 min at 4°C, and the supernatant obtained at the end served as a plasma sample. The plasma samples were collected and stored at −80°C for the metabonomic analysis; another 5 mL of the whole blood was placed in ordinary test tube, centrifuging in accordance with the above conditions to obtain the serum sample for biochemical detection. After blood sampling, all animals were sacrificed and the heart, liver, and kidney of each administration group were quickly removed and soaked in 10% formaldehyde solution for hematoxylin and eosin (H&E) staining.
2.5. Biochemical Detection and Histopathological Evaluation
The levels of serum creatine kinase (CK), creatine kinase-MB (CK-MB), alanine aminotransferase (ALT), aspartate aminotransferase (AST), creatinine (Cr), and blood urea nitrogen (BUN) were measured by automatic biochemical analyzer (Hitachi, Japan). Heart, liver, and kidney tissues were subjected to H&E staining, and paraffin sections were dewaxed by xylene, hydrated, and stained with hematoxylin for 10 minutes. After differentiation, eosin staining, dehydration, being cleaned in xylene, and neutral resin mounting, histopathological evaluation was performed under optical microscope by 200 times magnification. The pathological changes of rat tissues were observed.
2.6. Metabonomic Studies
2.6.1. Sample Pretreatment
Plasma samples stored at −80°C were taken and melted at room temperature. To 100 μL of plasma, 300 μL of acetonitrile was added, vortexed to mix for 1 min, and followed by ice-water bath ultrasonication for 10 min. The mixture was centrifuged at 13000 rpm for 15 min, and the supernatant was injected for UPLC-Q-TOF/MS analysis. 10 μL of plasma was obtained from different dosage groups and mixed as QC samples. The preparation of QC samples followed the same procedure with that of the plasma samples.
2.6.2. Method Validation
Before plasma samples analysis, QC samples were analyzed for method validation. Twenty chromatographic peaks were selected randomly as common peaks from chromatograms of QC samples, and RSDs of peak area and retention time were calculated to test the system precision, method repeatability, and sample stability. One QC sample was injected six times to monitor the system precision of UPLC-Q-TOF/MS. Six QC samples were then parallel processed and injected to evaluate the method repeatability. In addition, a QC sample was analyzed after being stored at 4°C for 0, 2, 6, 12, and 24 h, respectively, to ensure that the plasma samples were stable.
2.6.3. Chromatographic and Mass Spectrometric Conditions
The data acquisition was performed on an UPLC-Q-TOF/MS system (Waters, USA). An aliquot of 5 μL of processed plasma sample was injected and separated with an ACQUITY UPLC HSS C18 column (2.1 mm × 100 mm, 1.7 μm, Waters). The column temperature was 40°C and the flow rate was 0.3 mL/min. The mobile phase was water (A, containing 0.1% formic acid) and acetonitrile (B, containing 0.1% formic acid) using gradient elution. The elution conditions were as follows: 0 min–0.5 min, 99% A; 0.5 min–2 min, 99% A–50% A; 2 min–9 min, 50% A–1% A; 9 min-10 min, 1% A; 10 min–10.5 min, 1% A–99% A; 10.5 min–12 min, 99% A.
Mass spectrometry was operated in the positive ion mode using electrospray ionization (ESI) source. High-purity N2 was used as the auxiliary spray ionization and desolvation gas with temperature set at 350°C. The gas flow rate was 10 mL/min for drying gas, 600 L/h for desolvation gas, and 50 L/h for cone gas. The nebulizing gas pressure was 310 kPa and the capillary ionization voltage was 2.1 kV. The reference ion ([M + H]+ = 556.2771) was used to ensure accuracy in the spectral acquisition and the quadrupole scan range was m/z 50–1000 Da.
2.6.4. Data Processing and Statistical Analysis
The original data obtained by UPLC-Q-TOF/MS analysis was collected by Masslynx (Waters, USA) software, and the ion selection, peak alignment, peak matching, and filtering were carried out by the data processing system. After normalization, data were exported to SIMCA-P+12.0 software (Umetrics AB, Umea, Sweden) for partial least squares discriminant analysis (PLS-DA). Metabolite with variable importance plot (VIP) > 1 was screened as a potential biomarker related to toxicity of Psoraleae Fructus. An independent sample t-test was then performed using SPSS 17.0 software to determine the statistical significance of metabolites. By comparison with authentic standards, MS/MS fragmentation, and HMDB (http://www.hmdb.ca/), the significantly varied biomarkers were identified. Then, the biomarkers were optimized using the receiver operating characteristic (ROC) curve by SPSS. Finally MetPA (http://metpa.metabolomics.ca./MetPA/faces/Home.jsp) was utilized to describe the involved metabolic pathways of the biomarkers.
3. Results and Discussion
3.1. Serum Biochemical Assessment and Histopathological Examination
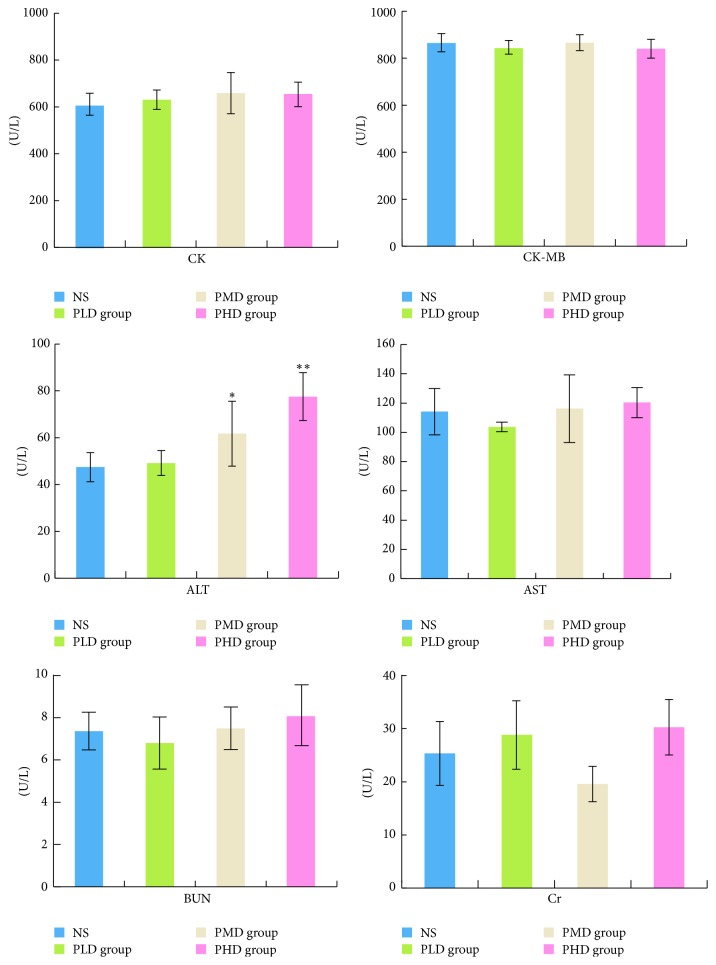
Serum levels of CK, CK-MB, ALT, AST, BUN, and Cr in the administration group and NS group were compared, as shown in Figure 1. Compared to NS group, the levels of CK, CK-MB, AST, BUN, and Cr in the PLD, PMD, and PHD group were not significantly changed, while ALT concentrations of the PMD and PHD group were significantly increased, indicating liver injury.
Figure 1.
CK, CK-MB, ALT, AST, BUN, and Cr levels in serum samples (∗P < 0.05 and ∗∗P < 0.01, compared with the NS group).
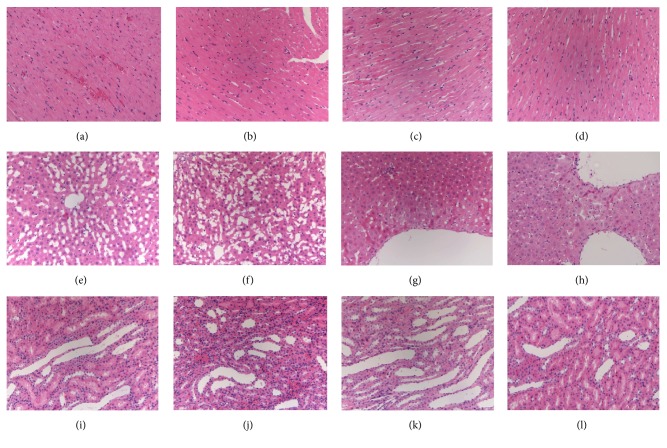
Histopathological results are shown in Figure 2. No abnormality was observed for tissue sections of NS group. Compared with NS group, there was no obvious cardiac damage for PLD, PMD, and PHD group, as well as rare hepatic or renal damage for PLD group. But abnormal symptoms were observed for liver and kidney sections of PMD and PHD group. Hepatocellular cloudy swelling and degeneration and varying degrees of renal looser stroma and edema along with inflammatory cell infiltration and mild pyelectasis demonstrated that PMD and PHD group caused hepatic and renal injuries to rats.
Figure 2.
Histopathological examination of the heart, liver, and kidney by H&E staining (200x magnifications). (a) NS heart group, (b) PLD heart group, (c) PMD heart group, (d) PHD heart group; (e) NS liver group, (f) PLD liver group, (g) PMD liver group, (h) PHD liver group, (i) NS kidney group, (j) PLD kidney group, (k) PMD kidney group, and (l) PHD liver group.
3.2. Method Validation
System precision test showed that RSDs were lower than 12% and 1% for peak area and retention time, indicating good precision of the UPLC-Q-TOF/MS apparatus for metabolomic analysis. Method repeatability test showed RSDs within 14% and 1%, demonstrating precise sample preparation. Additionally, RSDs for peak area and retention time of plasma samples under storage conditions were less than 10% and 1%, revealing that processed samples were kept stable for 24 h during analysis. The results of method validation proved system precision, method repeatability, and sample stability all in line with the requirements of metabonomic studies.
3.3. Metabolic Profiling
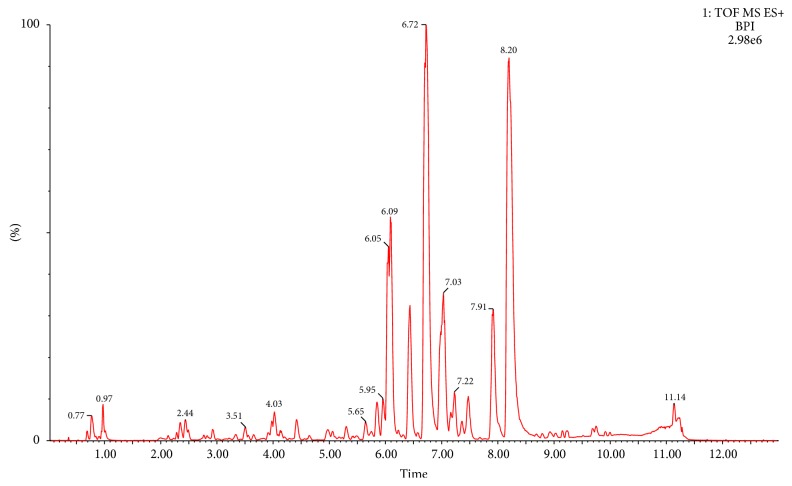
UPLC-Q-TOF/MS technique was used to analyze the plasma samples of different dosage groups. The BPI of a plasma QC sample was shown in Figure 3.
Figure 3.
BPI chromatogram of a plasma QC sample.
The original data were analyzed by multivariate statistical analysis, using PLS-DA to determine the differential metabolites. It can be observed from the PLS-DA score plot (Figure 4) that administration groups were obviously separated from the control group, indicating that the drug administration caused changes of the endogenous metabolites. Generally speaking, in the PLS-DA model, the larger R2 and Q2, the more stable the model. For the PLS-DA model established in the present experiment, R2 and Q2 met the requirements, indicating that the established model was stable and reliable and could be used for further data analysis.
Figure 4.
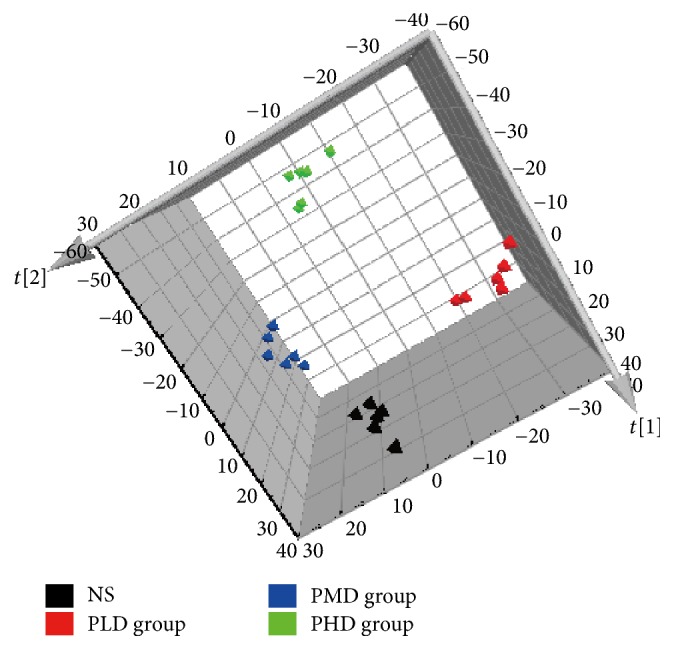
PLS-DA score plot for NS group and different dosage groups of Psoraleae Fructus extract.
3.4. Identification of Biomarkers
Serum biochemical assessment and histopathological examination showed hepatic and renal injuries induced by PMD and PHD group in rats, but no abnormality was observed for PLD group. In order to find out potential biomarkers related to hepatotoxicity and nephrotoxicity, PLS-DA was performed. Based on the PLS-DA model, the small molecular metabolites with significant changes were screened, and the variables of VIP > 1 were considered as potential biomarkers. After T-test, significantly varied (P < 0.05) biomarkers were selected as hepatotoxic and nephrotoxic biomarkers, and finally 13 different metabolites were identified by comparison with authentic standards and MS/MS fragments and searching through HMDB, as shown in Table 1.
Table 1.
Potential toxic biomarkers of Psoraleae Fructus.
| Number | t R (min) | Obsd m/z | Calcd m/z | ppm | Metabolite | Formula | Change trenda | MS/MS |
|---|---|---|---|---|---|---|---|---|
| (1) | 0.80 | 241.0309 | 241.0317 | −3.32 | Cystine | C6H12N2O4S2 | ↑ | 241.0 [M + H]+ 121.9 [M + H − C3H5NO4]+ 119.9 [M + H − C3H7NO4]+ |
|
| ||||||||
| (2) | 0.82 | 162.1134 | 162.1130 | 2.47 | Carnitine | C7H15NO3 | ↑ | 162.1 [M + H]+ 103.0 [M + H − C3H9N]+ |
|
| ||||||||
| (3) | 0.85 | 90.0553 | 90.0549 | 4.44 | Alanine | C3H7NO2 | ↓ | 90.0 [M + H]+ 72.0 [M + H − H2O]+ |
|
| ||||||||
| (4) | 1.00 | 169.0360 | 169.0362 | −1.18 | Uric acid | C5H4N4O3 | ↓ | 169.0 [M + H]+ 152.0 [M + H − NH3]+ 126.0 [M + H − CHNO]+ 96.0 [M + H − C2H3NO2]+ |
|
| ||||||||
| (5) | 1.01 | 182.0819 | 182.0817 | 1.10 | Tyrosine | C9H11NO3 | ↓ | 182.0 [M + H]+ 164.1 [M + H − H2O]+ 136.1 [M + H − C2H6O]+ |
|
| ||||||||
| (6) | 5.63 | 494.3248 | 494.3247 | 0.20 | LPC (16 : 1) | C24H48NO7P | ↑ | 494.3 [M + H]+ 476.3 [M + H − H2O]+ 184.1 [M + H − C19H34O3]+ 104.1 [M + H − C19H35O6P]+ |
|
| ||||||||
| (7) | 5.80 | 590.3224 | 590.3223 | 0.17 | LPC (22 : 6) | C30H50NO7P | ↑ | 590.3 [M + Na]+ 568.3 [M + H]+ 184.0 [M + H − C25H36O3]+ 104.1 [M + H − C25H37O6P]+ |
|
| ||||||||
| (8) | 5.85 | 478.2952 | 478.2934 | 3.76 | LPE (18 : 2) | C23H44NO7P | ↑ | 478.3 [M + H]+ 337.3 [M + H − C2H8NO4P]+ |
|
| ||||||||
| (9) | 6.22 | 496.3413 | 496.3403 | 2.01 | LPC (16 : 0) | C24H50NO7P | ↑ | 496.3 [M + H]+ 184.0 [M + H − C19H36O3]+ 104.1 [M + H − C19H37O6P]+ |
|
| ||||||||
| (10) | 6.38 | 546.3564 | 546.3560 | 0.73 | LPC (20 : 3) | C28H52NO7P | ↑ | 546.4 [M + H]+ 528.4 [M + H − H2O]+ 184.1 [M + H − C23H38O3]+ 104.1 [M + H − C23H39O6P]+ |
|
| ||||||||
| (11) | 6.46 | 400.3430 | 400.3427 | 0.75 | Palmitoyl carnitine | C23H45NO4 | ↓ | 400.3 [M + H]+ 341.2 [M + H − C3H9N]+ 144.1 [M + H − C16H32O2]+ 85.0 [M + H − C19H41NO2]+ |
|
| ||||||||
| (12) | 6.64 | 303.2322 | 303.2300 | 7.26 | Linoleic acid | C18H32O2 | ↑ | 303.2 [M + Na]+ 281.2 [M + H]+ 124.0 [M + H − C9H16O2]+ |
|
| ||||||||
| (13) | 7.12 | 548.3718 | 548.3716 | 0.36 | LPC (20 : 2) | C28H54NO7P | ↑ | 548.3 [M + H]+ 184.0 [M + H − C23H40O3]+ 104.1 [M + H − C23H41O6P]+ |
a↑: content increased; ↓: content decreased.
3.5. ROC Curve Analysis
The ROC curve combines sensitivity and specificity by way of illustration and it is a comprehensive indicator of sensitive and specific continuous variables. The diagnostic efficiency of ROC curve is usually evaluated by the area under the curve (AUC). If AUC is greater than 0.7, the closer the AUC to 1, the better the diagnostic effect. ROC results (Figure 5) showed AUCs of the above-mentioned 13 biomarkers to be all within 0.7–1; thus the 13 biomarkers were determined to be sensitive and specific hepatotoxic and nephrotoxic biomarkers of Psoraleae Fructus. Interestingly, PLD group showed the same change trend of these biomarkers with PMD and PHD groups in comparison to NS group, demonstrating that the untargeted metabonomic method developed in the present study was more sensitive than traditional biochemistry and histopathology.
Figure 5.
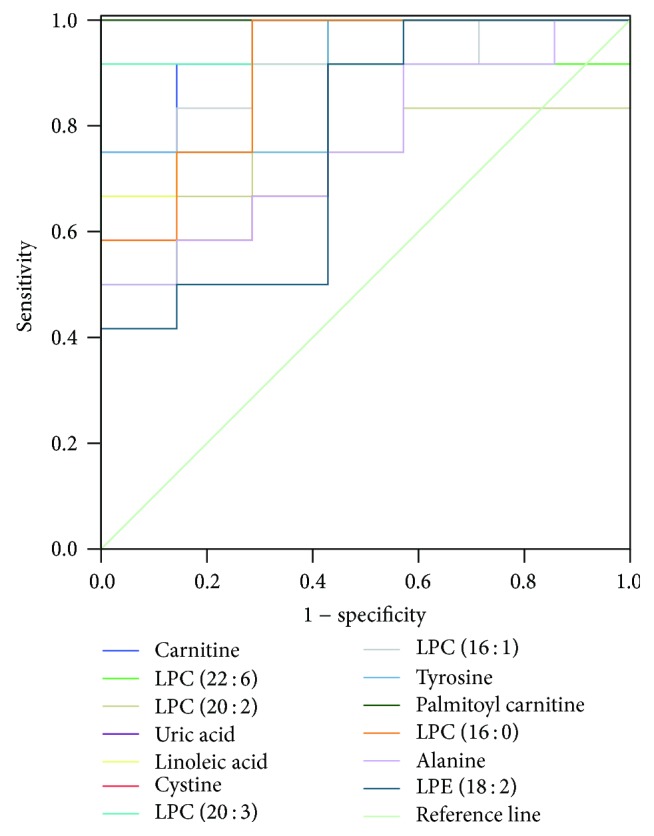
ROC curve of 13 toxic biomarkers.
3.6. Metabolomic Pathway Analysis
Metabolomic pathway analysis (MetPA) was performed to find out the metabolic pathways the biomarkers are involved in based on KEGG metabolic pathways. As shown in Figure 6, 13 biomarkers were known to be involved in four metabolic pathways associated with hepatotoxicity and nephrotoxicity of Psoraleae Fructus, which were dysfunctions of glycerophospholipid metabolism, amino acid metabolism, energy metabolism, and purine metabolism.
Figure 6.
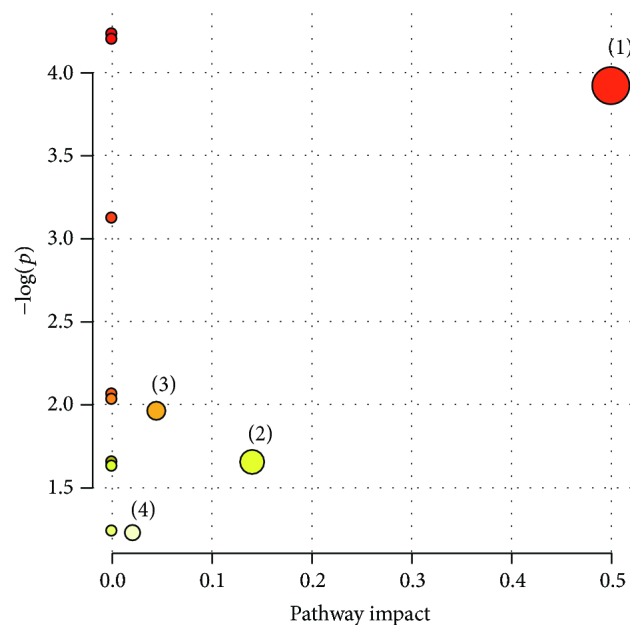
Summary of pathway analysis with MetPA. The interrupted metabolic pathways in Psoraleae Fructus group. (1) Glycerophospholipid metabolism; (2) amino acid metabolism; (3) energy metabolism; (4) purine metabolism.
3.7. The Biological Significance of Biomarkers
The occurrence of toxicity of Psoraleae Fructus aqueous extract involved complex in vivo metabolic process. Lysophosphatidylcholines (LPCs) are a class of substances from phospholipid, also known as hemolytic lecithin. The synthesis and catabolism of LPCs mainly occur in liver, expressed as the fluctuation of LPCs levels in plasma, so LPCs are of some significance in the diagnosis, prevention, and treatment of liver diseases. PCs are the main components of cell membrane and are produced by LPC catalysis through lecithin cholesterol acyltransferase. When cell membrane undergoes changes, PC content changes to increase the LPC content [15–17].
Meanwhile, it has been reported that plasma LPC levels might be associated with drug-induced nephrotoxicity. Oxidative stress was known to be one of the mechanisms of drug-induced kidney damage [18, 19]. When rats were given nephrotoxic drugs leading to kidney injury, generation of the reactive oxygen species (ROS) and reactive nitrogen species (RNS) was activated, resulting in in vivo changes of the oxidative stress levels and out of balance of the body oxidation and antioxidative stress system; consequently varying degrees of nephrocyte damage occurred. PCs can remove excess ROS and RNS in the body, so the body may need to consume a large number of PCs to consume peroxides to achieve normal oxidative stress levels in the case of kidney damage, and the glycerophospholipid metabolism was affected.
Liver acts as the center of amino acid metabolism, which might be disrupted by any liver damage. In our experiment, alanine content was decreased, probably due to the fact that protein synthesis was affected by administration of Psoraleae Fructus to rats [20]. Additionally, as important substances for organic life movement, amino acids are involved in various energy and material metabolism activities. Metabolic dysfunction of amino acids especially branched-chain amino acids will inevitably affect the protein synthesis [21]. In this study, the content of tyrosine was decreased and cystine was increased, which was consistent with the change trends for those reported in nephrotic syndrome [22]. Therefore, it was deduced that content changes of the two amino acids were associated with kidney toxicity caused by Psoraleae Fructus.
Carnitines have been identified as reliable biomarkers to determine abnormality of energy metabolism [23]. Carnitines are relevant to fatty acid metabolism in animals. The main function of carnitines is to transport long chain fatty acids from the outer mitochondrial membrane to the inner membrane as a carrier to promote β oxidation of fatty acids and to promote the conversion of lipometabolism into energy [24]. Drug-induced liver damage can lead to abnormal energy metabolism, destroy intracellular mitochondria, increase the β oxidation of fatty acid, and elevate the consumption of carnitines, so the plasma palmitoyl carnitine content in the present study decreased.
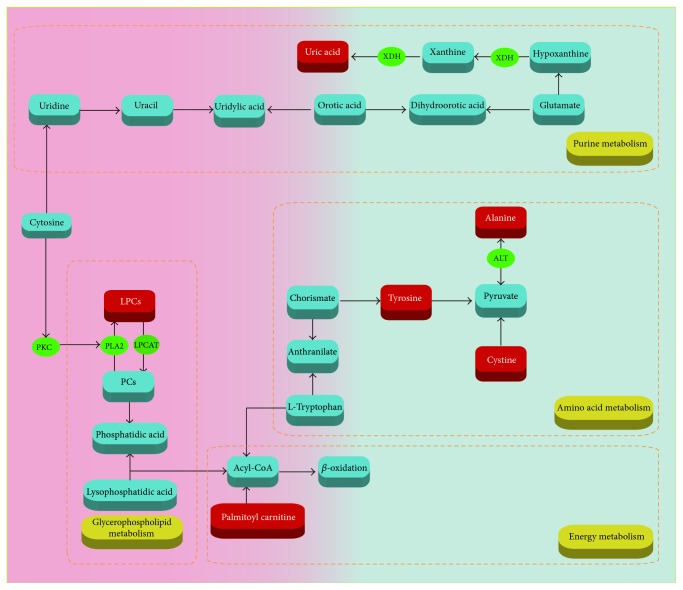
Uric acid has a variety of physiological functions in renal injury, including inhibiting nitric oxide bioavailability, reducing renal blood flow, activating renin-angiotensin system, and directly acting on endothelial cells and vascular smooth muscle. Hyperuricemia has been proved to accelerate renal injury and cause irreversible damage to the renal tubules. Increased uric acid levels could induce low density lipoprotein cholesterol oxidation and lipid peroxidation [25]. Uric acid identified as biomarkers in our experiment was changed, indicating that uric acid was related to the renal toxicity of Psoraleae Fructus. Related mechanisms are shown in Figure 7.
Figure 7.
Related metabolic pathways in the Psoraleae Fructus-administrated rats.
4. Conclusion
In the present study, toxicity of Psoraleae Fructus in rats was investigated after oral administration of aqueous extract of Psoraleae Fructus at different dosages for consecutive seven days. Untargeted metabonomic method based on UPLC-Q-TOF/MS was applied to evaluate the toxicity of Psoraleae Fructus. The biochemical and histopathological results showed that the medium and high doses of Psoraleae Fructus caused obvious liver and kidney injuries in rats. Metabonomic data were analyzed by multivariate statistical analysis and finally 13 potential biomarkers were identified that might be related to hepatotoxicity and nephrotoxicity induced by Psoraleae Fructus. Through metabolic pathway analysis, it could be concluded that the toxicity of Psoraleae Fructus was attributed to the disruption of glycerophospholipid, amino acid, energy, and purine metabolism. Our results enable people to truly recognize the toxic effects of Psoraleae Fructus and provide scientific guidance for clinical safety assessment of drugs. In addition, the early detection of toxic biomarkers mainly related to glycerophospholipids, amino acid, energy metabolism, and so forth, suggesting that the common mechanism of liver and kidney toxicity may be related to these pathways, and provide theoretical support for the mechanism of toxicity.
Acknowledgments
This project was supported by the Research Programs of Application of Basic and Frontier Technology in Tianjin (15JCYBJC29400), the National Natural Science Foundation of China (no. 81573825), and the National Key Technology R&D Program (no. 2011BAI07B08). This project was also supported by Program for Changjiang Scholars and Innovative Research Team in University (IRT_14R41).
Contributor Information
Yubo Li, Email: yaowufenxi001@sina.com.
Yanjun Zhang, Email: tianjin_tcm001@sina.com.
Conflicts of Interest
The authors declare no conflicts of interest.
References
- 1.Chinese Pharmacopoeia Commission. Pharmacopoeia of the People’s Republic of China. Beijing, China: China Medical Science Press; 2015. [Google Scholar]
- 2.Wang X., Cheng K., Han Y., et al. Effects of Psoralen as an Anti-tumor Agent in Human Breast Cancer MCF-7/ADR Cells. Biological & Pharmaceutical Bulletin. 2016;39(5):815–822. doi: 10.1248/bpb.b15-00957. [DOI] [PubMed] [Google Scholar]
- 3.Jiangning G., Xinchu W., Hou W., Qinghua L., Kaishun B. Antioxidants from a Chinese medicinal herb—Psoralea corylifolia L. Food Chemistry. 2005;91(2):287–292. doi: 10.1016/j.foodchem.2004.04.029. [DOI] [Google Scholar]
- 4.Li W. D., Yan C. P., Wu Y., et al. Osteoblasts proliferation and differentiation stimulating activities of the main components of Fructus Psoraleae corylifoliae. Phytomedicine. 2014;21(4):400–405. doi: 10.1016/j.phymed.2013.09.015. [DOI] [PubMed] [Google Scholar]
- 5.Bansal S., Sahoo B., Garg V. Psoralen-narrowband UVB phototherapy for the treatment of vitiligo in comparison to narrowband UVB alone. Photodermatology, Photoimmunology & Photomedicine. 2013;29(6):311–317. doi: 10.1111/phpp.12072. [DOI] [PubMed] [Google Scholar]
- 6.Cheung W. I., Tse M. L., Ngan T., et al. Liver injury associated with the use of Fructus Psoraleae (Bol-gol-zhee or Bu-gu-zhi) and its related proprietary medicine. Clinical Toxicology. 2009;47(7):683–685. doi: 10.1080/15563650903059136. [DOI] [PubMed] [Google Scholar]
- 7.Wang J., Jiang Z., Ji J., et al. Evaluation of hepatotoxicity and cholestasis in rats treated with EtOH extract of Fructus Psoraleae. Journal of Ethnopharmacology. 2012;144(1):73–81. doi: 10.1016/j.jep.2012.08.028. [DOI] [PubMed] [Google Scholar]
- 8.Zhou K., Dai Z., Liu Z. B. Aqueous Extract of psoralea corylifolia induced liver injury in rats. Journal of Tianjin University of Traditional Chinese Medicine. 2013;32(4):221–224. [Google Scholar]
- 9.Zhao Z. J., Gong Z., Shi S. Z., Yang J. I., Ma N. N., Wang Q. Toxicokinetics of bakuchiol, hepatic and renal toxicity in rats after single oral administration of Psoraleae Fructus and combination with Glycyrrhizae Radix et Rhizoma. Zhongguo Zhongyao Zazhi. 2015;40(11):2221–2226. doi: 10.4268/cjcmm20151129. [DOI] [PubMed] [Google Scholar]
- 10.Dettmer K., Hammock B. D. Metabolomics - A new exciting field within the "omics" sciences. Environmental Health Perspectives. 2004;112(7):A396–A397. doi: 10.1289/ehp.112-1241997. [DOI] [PMC free article] [PubMed] [Google Scholar]
- 11.Fiehn O. Functional Genomics. Springer; 2002. Metabolomicsthe link between genotypes and phenotypes; pp. 155–171. [Google Scholar]
- 12.Li Y., Deng H., Ju L., et al. Screening and validation for plasma biomarkers of nephrotoxicity based on metabolomics in male rats. Toxicology Research. 2016;5(1):259–267. doi: 10.1039/C5TX00171D. [DOI] [PMC free article] [PubMed] [Google Scholar]
- 13.Li Y. B., Ju L., Hou Z. G., et al. Screening, verification, and optimization of biomarkers for early prediction of cardiotoxicity based on metabolomics. Journal of Proteome Research. 2015;14(6):2437–2445. doi: 10.1021/pr501116c. [DOI] [PubMed] [Google Scholar]
- 14.Li Y., Wang L., Ju L., et al. A Systematic Strategy for Screening and Application of Specific Biomarkers in Hepatotoxicity Using Metabolomics Combined With ROC Curves and SVMs. Toxicological Sciences. 2016;150(2):390–399. doi: 10.1093/toxsci/kfw001.kfw001 [DOI] [PubMed] [Google Scholar]
- 15.Rousset X., Vaisman B., Amar M., Sethi A. A., Remaley A. T. Lecithin: Cholesterol acyltransferase - From biochemistry to role in cardiovascular disease. Current Opinion in Endocrinology, Diabetes and Obesity. 2009;16(2):163–171. doi: 10.1097/MED.0b013e328329233b. [DOI] [PMC free article] [PubMed] [Google Scholar]
- 16.Cao H., Ma J., Yang J., et al. A metabonomics study of Chinese miniature pigs with acute liver failure treated with transplantation of placental mesenchymal stem cells. Metabolomics. 2014;10(4):651–662. doi: 10.1007/s11306-013-0603-0. [DOI] [Google Scholar]
- 17.Burke J. E., Dennis E. A. Phospholipase A2 structure/function, mechanism, and signaling. Journal of Lipid Research. 2009;50:S237–S242. doi: 10.1194/jlr.R800033-JLR200. [DOI] [PMC free article] [PubMed] [Google Scholar]
- 18.Yang F., Ren L., Zhuo L., Ananda S., Liu L. Involvement of oxidative stress in the mechanism of triptolide-induced acute nephrotoxicity in rats. Experimental and Toxicologic Pathology. 2012;64(7-8):905–911. doi: 10.1016/j.etp.2011.03.013. [DOI] [PubMed] [Google Scholar]
- 19.Zhang X., Li Y., Zhou H., et al. Plasma metabolic profiling analysis of nephrotoxicity induced by acyclovir using metabonomics coupled with multivariate data analysis. Journal of Pharmaceutical and Biomedical Analysis C. 2014;97:151–156. doi: 10.1016/j.jpba.2014.04.036. [DOI] [PubMed] [Google Scholar]
- 20.Sun J., Slavov S., Schnackenberg L. K., et al. Identification of a metabolic biomarker panel in rats for prediction of acute and idiosyncratic hepatotoxicity. Computational and Structural Biotechnology Journal. 2014;10(17):78–89. doi: 10.1016/j.csbj.2014.08.001. [DOI] [PMC free article] [PubMed] [Google Scholar]
- 21.Li Y., Zhang X., Zhou H., et al. Metabonomics study on nephrotoxicity induced by intraperitoneal and intravenous cisplatin administration using rapid resolution liquid chromatography coupled with quadrupole-time-of-flight mass spectrometry (RRLC-Q-TOF-MS) RSC Advances. 2014;4(16):8260–8270. doi: 10.1039/c3ra46920d. [DOI] [Google Scholar]
- 22.Wu H., Xu Z. W., Tang Z. Y. Clinical observation of amino acid metabolism in patients with nephrotic syndrome. Clinical Focus. 2003;18(10):5631–5634. [Google Scholar]
- 23.Fujieda Y., Manno A., Hayashi Y., et al. Inflammation and Resolution Are Associated with Upregulation of Fatty Acid β-Oxidation in Zymosan-Induced Peritonitis. PLoS ONE. 2013;8(6) doi: 10.1371/journal.pone.0066270.e66270 [DOI] [PMC free article] [PubMed] [Google Scholar]
- 24.Indiveri C., Iacobazzi V., Tonazzi A., et al. The mitochondrial carnitine/acylcarnitine carrier: Function, structure and physiopathology. Molecular Aspects of Medicine. 2011;32(4-6):223–233. doi: 10.1016/j.mam.2011.10.008. [DOI] [PubMed] [Google Scholar]
- 25.Huang S. H., Lian X. Y. Progress in hyperuricemia and renal injury. Journal of Medical Postgraduates. 2010;23(11):1217–1221. [Google Scholar]


