Abstract
Adiponectin is a hormone secreted from white adipocytes and takes part in the regulation of several metabolic processes. Although the pathophysiological importance of adiponectin has been thoroughly investigated, the mechanisms controlling its release are only partly understood. We have recently shown that adiponectin is secreted via regulated exocytosis of adiponectin-containing vesicles, that adiponectin exocytosis is stimulated by cAMP-dependent mechanisms, and that Ca2+ and ATP augment the cAMP-triggered secretion. However, much remains to be discovered regarding the molecular and cellular regulation of adiponectin release. Here, we have used mathematical modeling to extract detailed information contained within our previously obtained high-resolution patch-clamp time-resolved capacitance recordings to produce the first model of adiponectin exocytosis/secretion that combines all mechanistic knowledge deduced from electrophysiological experimental series. This model demonstrates that our previous understanding of the role of intracellular ATP in the control of adiponectin exocytosis needs to be revised to include an additional ATP-dependent step. Validation of the model by introduction of data of secreted adiponectin yielded a very close resemblance between the simulations and experimental results. Moreover, we could show that Ca2+-dependent adiponectin endocytosis contributes to the measured capacitance signal, and we were able to predict the contribution of endocytosis to the measured exocytotic rate under different experimental conditions. In conclusion, using mathematical modeling of published and newly generated data, we have obtained estimates of adiponectin exo- and endocytosis rates, and we have predicted adiponectin secretion. We believe that our model should have multiple applications in the study of metabolic processes and hormonal control thereof.
Keywords: adipocyte, adipokine, adiponectin, electrophysiology, endocytosis, exocytosis, mathematical modeling
Introduction
Adiponectin is a hormone exclusively secreted from white adipocytes with roles in regulation of glucose and lipid levels. Obesity and type 2 diabetes are associated with reduced circulating levels of adiponectin. Moreover, high adiponectin levels protect against development of type 2 diabetes (1). Although the pathophysiological relevance of adiponectin is clear, the molecular regulation of its release is inadequately studied. Similarly to other hormones (2), adiponectin has been proposed to be released via regulated exocytosis (3–5). However, the molecular mechanisms controlling adiponectin vesicle release are not fully resolved. Our previous work has demonstrated that adiponectin is released from an intracellular pool of adiponectin-containing vesicles (6, 7). However, unlike most peptide/protein hormones (2), exocytosis of adiponectin is triggered by cAMP, and a combination of intracellular Ca2+ and ATP potently augments the cAMP-stimulated secretion (6, 7). Thus, the regulation of adiponectin secretion shows similarities with how hormone release is controlled in other endocrine cell types, although there are some fundamental differences (i.e. endocrine cell exocytosis is typically triggered by Ca2+, whereas cAMP has an amplifying effect on secretion) (2). Our results have clearly provided significant insight into the regulation of adiponectin exocytosis. However, the data contain information on mechanistic details that can only be fully retrieved using a mathematical modeling approach (8, 9).
Several available mathematical models describe the regulation of Ca2+-triggered exocytosis in traditional endocrine cell types, such as insulin-secreting beta cells (10–12) and catecholamine-releasing chromaffin cells (13–15). Additional models have defined disease mechanisms related to white adipocyte insulin resistance (16–19). Clearly, a mathematical model specifically defining adiponectin exocytosis mechanisms is required to completely understand the mechanistic regulation of adiponectin release.
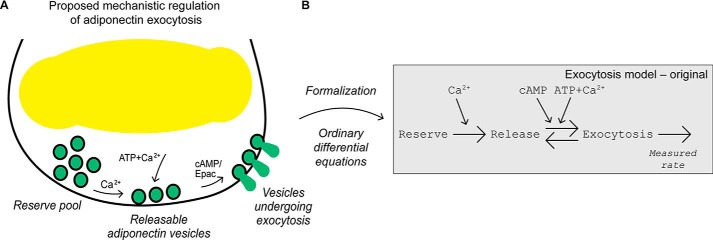
Here, we use modeling as a tool to qualitatively and quantitatively evaluate and revise our current cell physiological understanding of how adiponectin exocytosis is regulated. Our prevailing concept of regulatory mechanisms (Fig. 1A, adapted from Ref. 6) is updated in several steps resulting in a more detailed understanding of the adiponectin exocytosis process. Using the model to analyze data, we first show that ATP dependence of the functionally divided intracellular adiponectin vesicle pools needs to be formalized in a new way. We further show that endocytosis contributes to the measured capacitance signal, and we are able to quantify the endocytosis contribution. By refinement of the model in several steps, we finally provide a revised and validated model of the molecular and cellular regulation of white adipocyte adiponectin release.
Figure 1.
Biological insights formally tested using mathematical modeling. A, biological insights adapted from Ref. 6. In brief, adiponectin vesicle exocytosis is triggered by cAMP alone but is augmented by the combined presence of ATP and Ca2+. Moreover, Ca2+-dependent mechanisms recruit vesicles to a functional pool from where they can be released (vesicles become release competent). B, developed original mathematical model with 11 free parameters. Large arrows represent transitions between the different vesicle states and smaller arrows indicate model inputs. The rate of exocytosis in the model is compared with the experimentally measured rate of capacitance change.
Results
Formal testing of hypotheses of adiponectin exocytosis regulatory mechanisms
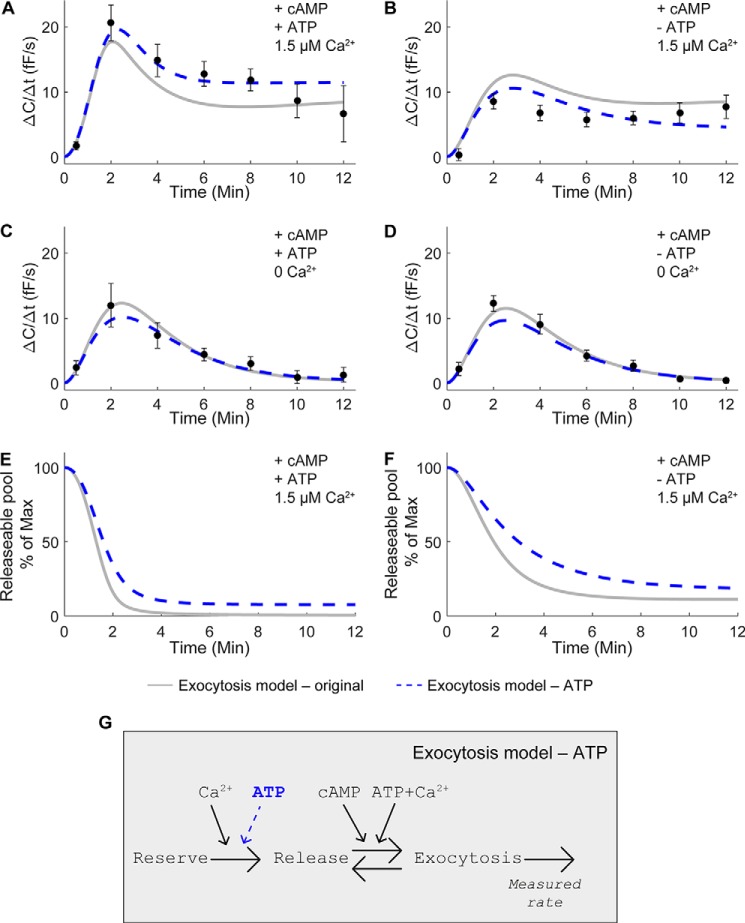
To investigate the molecular and cellular mechanisms controlling adiponectin secretion, we have previously examined the role of the three intracellular mediators cAMP, Ca2+, and ATP in 3T3-L1 adipocyte adiponectin exocytosis (6). Those mediators are known to have important roles in regulation of (neuro)endocrine cell secretion (2). In Komai et al. (6), we performed whole-cell electrophysiological recordings of exocytosis by measuring the change in membrane capacitance, which corresponds to alterations of the cell-surface area (increases with exocytosis and decreases with endocytosis). Our key findings, confirmed in primary human subcutaneous adipocytes, were as follows: (i) adiponectin exocytosis is triggered by cAMP, and (ii) a combination of Ca2+ and ATP potently augments the cAMP-stimulated adiponectin vesicle release (Fig. 1A). To formally test our previous interpretations of experimental data, we have here directly translated this hypothesis (Fig. 1A) into a system of ordinary differential equations (ODEs).6 During the model development, all interactions were explicitly included, resulting in a model with three states corresponding to functionally diverse adiponectin vesicle pools (Fig. 1B): a reserve pool (Reserve), a releasable pool (Release), and a pool corresponding to vesicles undergoing exocytosis (Exocytosis). The original model contains 11 parameters that control the rate of the reactions between the states (see under “Experimental procedures”). These parameters are not possible to determine experimentally. We therefore used the time-series data in Ref. 6 with rates of exocytosis resulting from different inputs (i.e. perfusion of the interior of the patched cells with pipette solution containing or lacking cAMP, Ca2+, or ATP) to estimate parameter values. The pipette solutions contained the following: 1) a combination of cAMP, Ca2+, and ATP; 2) cAMP together with Ca2+; 3) cAMP together with ATP; and 4) cAMP alone (Fig. 2, A–D). Despite extensive searches through the parameter space, we were unable to find agreement between the simulation of the original model (Fig. 2, A–D, solid gray lines) and experimental data (Fig. 2, A–D, black symbols ± S.E.) that passed a χ2 test. The model structure was therefore rejected (Exocytosis model - original, Table 1), and we concluded that the original model lacks important mechanisms and must be refined.
Figure 2.
Vesicle recruitment to the releasable pool must be ATP-dependent. Exocytotic rates (ΔC/Δt) were measured at indicated time points, as described in Ref. 6. Simulations of the original model are shown as gray lines, and the refined model with ATP dependence is indicated by dashed blue lines. A–D, model simulations and capacitance recordings from Ref. 6 (black circles ± S.E.) in fully differentiated 3T3-L1 adipocytes infused with pipette solutions containing or lacking 0.1 mm cAMP, 3 mm ATP, or 1.5 μm Ca2+, as indicated. C and D, absolute intracellular Ca2+-free conditions were ascertained by inclusion of 10 mm of the Ca2+ chelator BAPTA in the pipette solution. E and F, model simulations of the remaining vesicles in the releasable pool after addition of cAMP, Ca2+, and ATP (E) or cAMP and Ca2+ without ATP (F). G, structure of the refined model with ATP dependence (dashed blue arrow), including 12 free parameters.
Table 1.
Summary of all model evaluations
The threshold for the χ2 error for 95% significance is calculated using the number of data points (28 in the original data and 39 in the extended data) minus 1 normalization parameter minus the number of parameters in the model.
| Agreement with original data (χ2 error; threshold) | Conclusion from original data agreement | Agreement with extended data (original data + >10 μm free Ca2+ + 0 cAMP) (χ2 error; threshold) | Final conclusion | |
|---|---|---|---|---|
| Exocytosis model, original (11 parameters) | 62 (>26) | Rejected | Rejercted | |
| Exocytosis model, ATP (12 parameters) | 31 (>25) | Rejected | Rejected | |
| Exocytosis model, ATP/endocytosis (15 parameters) | 11 (<21) | Not rejected | 20 (<35) | Agreement with all data |
Refinement of the original hypothesis to include ATP-dependent replenishment of releasable vesicles
Analysis of the model simulations for the original hypothesis revealed that the dynamics of the cAMP, Ca2+, and ATP input data, with a high peak and slow decrease in exocytotic rate (ΔC/Δt; Fig. 2A, gray line), were not possible to fit concurrently with the lower peak in the cAMP and Ca2+ data set with ATP absent (Fig. 2B, gray line). This lack of agreement is due to that the refilling of the releasable vesicle pool in the original model depends on Ca2+ alone, without a role for ATP (Fig. 1, A and B). As a consequence, releasable vesicles would be expected to be depleted at a faster rate after the high exocytosis peak attained in the presence of ATP. Fig. 2, E and F, shows model simulations of the remaining vesicles under the two conditions, as indicated. The observation that the releasable pool is rapidly depleted in the presence of ATP (Fig. 2E, gray lines) together with the lack of agreement in Fig. 2, A and B, indicates that ATP is involved in vesicle replenishment. The original hypothesis was therefore modified to contain an ATP-dependent term affecting the transition of vesicles from the reserve pool to the releasable pool (Fig. 2G, indicated in blue). This adjustment of the model is not in conflict with our original observations in Ref. 6, but it merely represents another way to formalize the experimental findings. Inclusion of the ATP dependence resulted in improved agreement between model simulations and experimental data (Fig. 2, A–D, dashed blue lines). However, the model was still rejected by a χ2 test (Exocytosis model - ATP, Table 1).
To quantify the improvement resulting from the addition of the ATP dependence, a likelihood ratio test was used to test the null-hypothesis that the models are equally good at describing the data. The extra parameter for the ATP dependence decreased the χ2 error by 31 (from 62 to 31, Table 1). This should be compared with the threshold of four for 95% confidence and 1 degree of freedom (1 extra parameter added to the model), i.e. the agreement with data improved more than the threshold value, and the null-hypothesis was rejected. Thus, the added ATP dependence step significantly improved the fit between the model and recorded data.
Inclusion of the contribution of endocytosis to the measured signal significantly improves the model
A remaining qualitative shortcoming is the inability of the model to capture the experimentally attained 25% lower peak of exocytotic rate in response to a combination of cAMP and Ca2+ (black symbols in Fig. 2B) compared with when exocytosis is triggered by cAMP alone (black symbols in Fig. 2D). This lower peak rate cannot be captured by a model structure, including exclusively positive effects of Ca2+ on the measured signal. The membrane capacitance recordings denote the net result of cell exo- and endocytosis, and Ca2+ has been shown to trigger both exo- and endocytosis in several peptide-secreting cell types (20–24). A very high intracellular free concentration of Ca2+ (≥10 μm) triggers endocytosis (i.e. it affects capacitance measurements negatively) in a variety of (neuro)endocrine cell types (23, 24).
In Ref. 6, we showed that a non-stimulatory (cAMP-lacking) pipette solution containing 1.5 μm free Ca2+ and ATP did not induce significant endocytosis even in experiments lasting as long as 20 min. With a few example traces, we further demonstrated that infusion of adipocytes with a pipette solution containing ≥10 μm free Ca2+ (20 mm CaCl2 in combination with 10 mm of the Ca2+ chelator BAPTA) together with cAMP and ATP resulted in a lower exocytotic rate, interpreted as contribution of Ca2+-dependent endocytosis (6). Those findings suggest that, in white adipocytes, cAMP stimulation of adiponectin exocytosis is required in order for Ca2+-dependent endocytosis to occur.
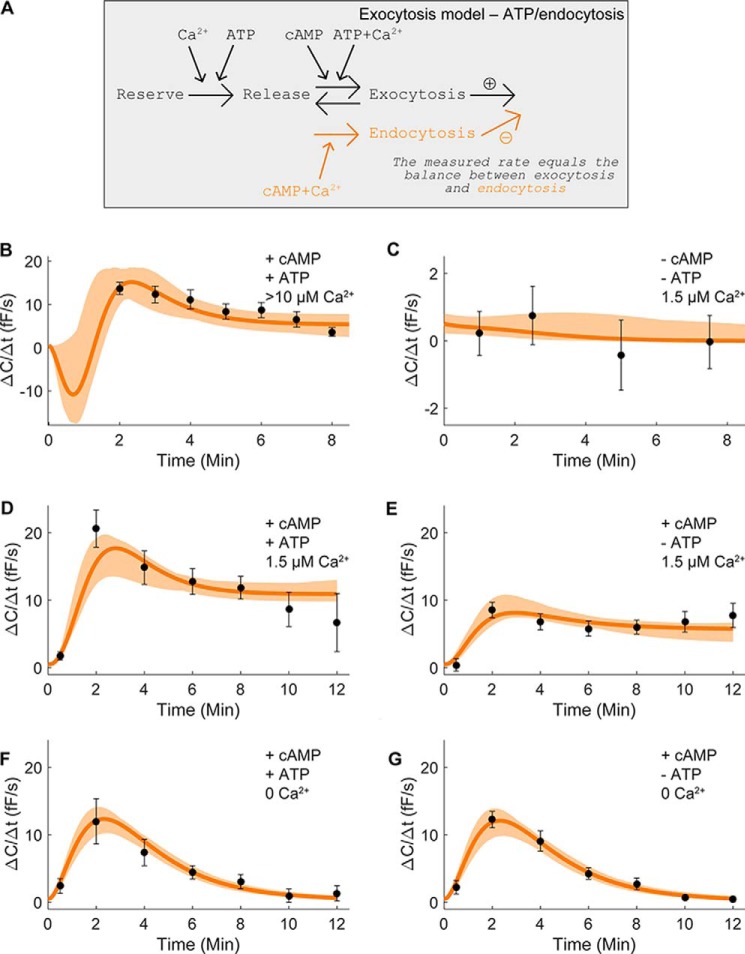
Based on the above premises, we included a Ca2+-dependent negative effect of Ca2+ on exocytosis in the form of endocytosis in the model (Fig. 3A). To experimentally quantify the effect of high Ca2+ on white adipocyte exo- and endocytosis, we infused 3T3-L1 adipocytes with the cAMP- and ATP-containing pipette solution supplemented with ≥10 μm free Ca2+. Exocytosis was stimulated at a peak rate of ΔC/Δt = 14 ± 1 fF/s (measured at 2 min; Fig. 3B), thus at a significantly lower rate than triggered by the same solution containing 1.5 μm free Ca2+ (ΔC/Δt = 21 ± 7 fF/s; p < 0.01; Fig. 2A). Our results indicate that an unphysiologically high intracellular Ca2+ concentration induces excessive endocytosis, manifested as a reduced measured exocytotic rate.
Figure 3.
Contribution of Ca2+-dependent endocytosis to the capacitance measurements improves the model. A, structure of the endocytosis model with 15 free parameters. The difference between the rate of exocytosis and endocytosis in the model is compared with the experimentally measured rate of capacitance change. B, ΔC/Δt in cells infused with a solution containing ≥10 μm free Ca2+ together with 3 mm ATP and 0.1 mm cAMP. The average exocytotic rate (ΔC/Δt) was quantified at the indicated time points. Results are an average from 11 recordings. C, data from Ref. 6 with a pipette solution lacking cAMP (1.5 μm Ca2+ and 3 mm ATP included). The average ΔC/Δt was quantified at the designated time points. D–G, data from Ref. 6; see Fig. 2, A–D, for details.
The positive effect of the increase from 1.5 to ≥10 μm Ca2+ does not display a linear relationship between Ca2+ concentration and exocytotic response (Fig. 3B), and thus it needs to be saturated. Saturation was included in the model using a half-maximal saturation constant (Km) as shown.

Note that saturation was not required for comparison of the original data sets (Fig. 2, A–D) with a single free Ca2+ concentration.
Testing of the endocytosis hypothesis confirmed agreement with data with high Ca2+ (Fig. 3B, black symbols ± S.E.) as well as data with 1.5 μm Ca2+ alone (Fig. 3C, black symbols ± S.E.). The developed model was also conformable with previous data sets (Fig. 2, A–D), and we therefore gathered all parameters that passed a χ2 test (Fig. 3, B–G, orange areas).
Validation of the Exocytosis model - ATP/endocytosis
To evaluate the model in Fig. 3A further, we used a new kind of experimental data consisting of accumulated adiponectin released into the media (measured by ELISA (6)). Intact 3T3-L1 adipocytes were incubated with a solution containing the cAMP-increasing agent forskolin in combination with the phosphodiesterase inhibitor IBMX (FSK/IBMX) under different intracellular Ca2+ conditions (6). To ensure the agreement between the extracellular cAMP-elevating agents and infusion of cAMP via the patch pipette, we measured the effect of FSK/IBMX on membrane capacitance. FSK/IBMX potently stimulated exocytosis, and the maximal ΔC/Δt averaged ∼20 fF/s (Fig. 4). This rate is very similar to the exocytotic rate achieved upon infusion of cells with cAMP and 1.5 μm free Ca2+ (cf. Fig. 2A) thus justifying the usage of the secretion data for model validation.
Figure 4.
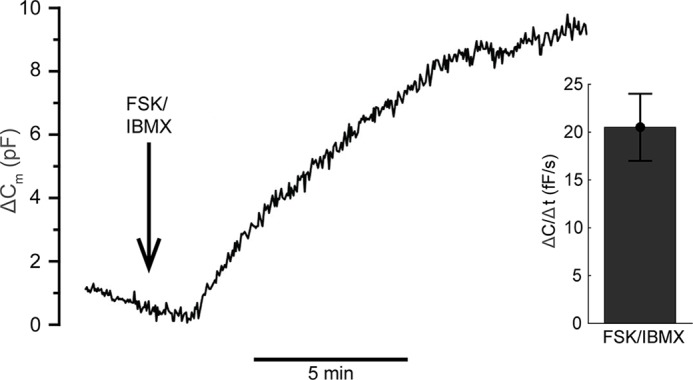
Exocytosis induced by extracellular forskolin together with IBMX resembles that stimulated by intracellular cAMP. Representative trace displaying the effect of 10 μm forskolin together with 200 μm IBMX (FSK/IBMX; added as indicated by the arrow) on 3T3-L1 adipocyte membrane capacitance as well as histogram showing the average exocytotic rate (ΔC/Δt). The trace is representative of eight individual experiments.
The secretion data were attained using intact cells. Thus, cytoplasmic levels of intracellular mediators were, in contrast to the clamped conditions in the capacitance recordings, allowed to fluctuate. Consequently, the implementation of the secretion data in the adiponectin release model required an estimation of the intracellular levels of cAMP, ATP, and Ca2+ under the new experimental conditions.
By use of values in Refs. 6 and 7, we determined the basal intracellular Ca2+ concentrations ([Ca2+]i). Analysis gave a [Ca2+]i interval of 35–230 nm (in agreement with reports from others (25)). In Komai et al. (6), we found Ca2+ to increase 1.5-fold in the presence of FSK/IBMX. This combined information allowed us to limit the range of Ca2+ concentrations in the model simulations.
The basal cAMP levels in adipocytes are low due to spontaneous release of adenosine (26). Absolute concentrations of adipocyte intracellular cAMP have never been described, but Zu et al. (27) reports basal cAMP in primary rat adipocytes to be ∼6 pmol/mg protein. However, it is difficult to estimate how this value translates into actual cytoplasmic concentration, as that depends on the volume of the fat-free mass and the protein content per cell. We therefore calculated the basal cAMP concentration in 3T3-L1 adipocytes from values reported in Ref. 6 and related those to the fat-free mass (measured by coherent anti-Stokes Raman scattering and multiphoton excitation fluorescence; Table 2). The average basal cAMP concentration was calculated to be 55 μm. The lowest measured value was 2 μm (Table 2), in the same range as concentrations reported in cardiomyocytes (1.2–1.3 μm) (28, 29). Our capacitance measurements show that 100 μm cAMP stimulates adiponectin exocytosis (6). Thus, the basal intracellular cAMP concentration was allowed to range between 2 and 100 μm when predicting the secretion experiments.
Table 2.
Calculation of 3T3-L1 adipocyte intracellular cAMP concentration
Values of cAMP were taken from Ref. 6. 3T3-L1 cells were seeded and differentiated as described under “Experimental procedures.” Number of cells, cell volume, and lipid volume was calculated using a nuclear stain (DAPI), MPEF, and CARS.
| cAMP/well (ng) | Cell no./well | Cell volume/cell (pl) | Lipid volume/cell (pl) | Lipid-free volume/cell (pl) | Resulting cAMP |
|---|---|---|---|---|---|
| 47.3 ± 6.4 | 72,263.7 ± 2233.7 | 49.0 ± 4.4 | 9.0 ± 0.77 | 40.0 ± 3.9 | 55 μm (range 1.98–175 μm) |
| Mean of 44 wells | Mean of 12 wells | Mean of 60 cells | Mean of 60 cells | Mean of 60 cells |
We have previously shown that FSK/IBMX increases 3T3-L1 adipocyte intracellular cAMP levels ∼6.5-fold (unaffected by BAPTA treatment (6)); we implemented this constraint in the model.
The intracellular ATP levels in fully differentiated 3T3-L1 adipocytes exposed to a physiological glucose concentration are unknown. Hresko et al. (30) have reported an ATP concentration of ∼5 mm in 3T3-L1 adipocytes. However, this value was measured in cells exposed to high glucose (25 mm, likely resulting in enhanced ATP production) and is therefore difficult to compare with our experiments carried out at a basal (5 mm) glucose concentration. Due to lack of experimental constraints, and to avoid underestimation of the uncertainty of the prediction, we allowed for a wide variety of ATP levels in the model simulations (1 μm to 1 mm) regardless of treatment conditions. The basal cytosolic ATP concentration has been reported to be 1 mm in clonal beta cells (31), thus in agreement with our range of cytosolic ATP.
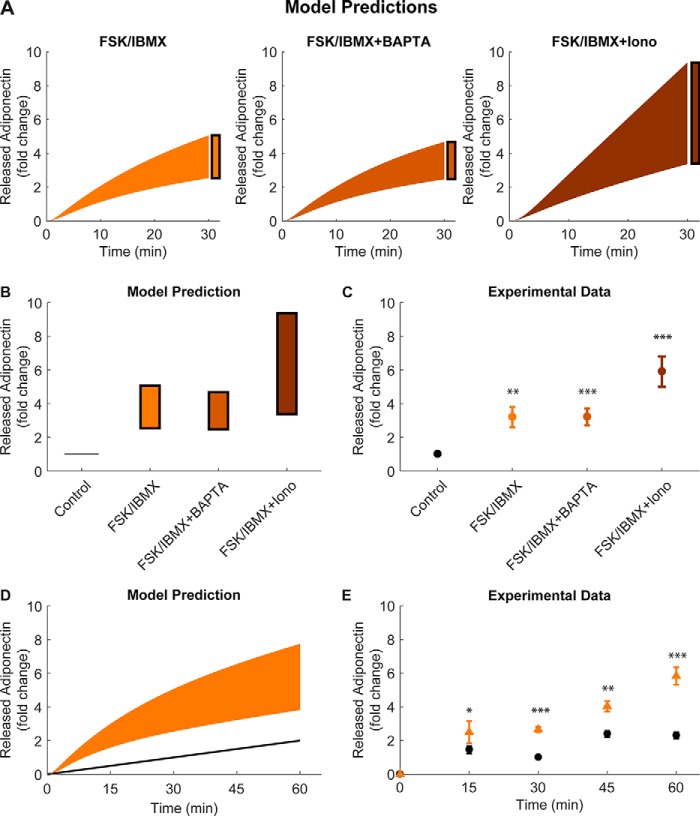
We used the determined intervals of intracellular Ca2+, cAMP, and ATP, and an approximation of all found acceptable parameters to simulate the adiponectin accumulation after stimulation with FSK/IBMX alone, FSK/IBMX after pre-treatment with the Ca2+ chelator BAPTA, and FSK/IBMX together with the Ca2+ ionophore ionomycin (Fig. 5A, filled area). We compared the simulated 30-min time point (Fig. 5, A, black boxes, summarized in B) with real adiponectin secretion (Fig. 5C), measured as accumulated adiponectin in the media under the same experimental conditions (6). The simulations were found to closely resemble the data (cf. Fig. 5, B and C). To simulate the effect of ionomycin, we allowed the Ca2+ concentration to increase at least 1.5 times with ionomycin, and maximally 10 times above basal levels with FSK/IBMX in combination with ionomycin.
Figure 5.
Developed model can predict adiponectin release levels at different time points. A, time-resolved predictions with uncertainties from simulations of the final model structure and the found acceptable parameters. In the simulated predictions, levels of cAMP, ATP, and Ca2+ were varied to reflect the experimentally added FSK/IBMX (left), FSK/IBMX in cells pre-treated with BAPTA (middle), and a combination of FSK/IBMX and ionomycin (Iono) (right). B, summary of the predicted adiponectin release intervals at time point 30 min in A. C, experimental data from Ref. 6 showing adiponectin release under the same conditions as simulated in B. D, time-resolved predicted adiponectin release after FSK/IBMX addition. E, experimental adiponectin release at the indicated time points (cf. simulations in D). Included concentrations were: 10 μm forskolin, 200 μm IBMX, and 1 μm ionomycin. Ca2+-chelated cells were pre-treated with 50 μm BAPTA during 30 min. *, p < 0.05; **, p < 0.01; ***, p < 0.001.
To further validate the model, in a dynamic setting, we studied the time-resolved prediction of FSK/IBMX-stimulated adiponectin secretion at 15, 30, 45, and 60 min. The predictions with corresponding uncertainties show a clear no-linear behavior with saturation (Fig. 5D). We performed the corresponding experiments of FSK/IBMX-stimulated adiponectin secretion, measured at the simulated time points. As shown in Fig. 5E, there was a distinct resemblance between simulated and real data. It is noteworthy that although the model was developed using capacitance recordings restricted to a time period of 12 min, it is capable of simulating the dynamic adiponectin secretion at severalfold later time points.
Quantification of the contribution of Ca2+-dependent endocytosis to the exocytosis measurements
Using the validated model, we predicted the contribution of endocytosis to the measured signal under different experimental conditions (Fig. 6A). To determine the interval of possible contribution using the uncertainty of data, we used two global optimization algorithms (“Experimental procedures”) to collect different parameter sets (all yielding simulations in agreement with data within a 95% confidence interval) (8). The contribution of endocytosis to the measured signal was found to be as follows: (i) 21 ± 12% with cAMP, 1.5 μm Ca2+, and ATP; (ii) 29 ± 13% with cAMP and 1.5 μm Ca2+ (ATP excluded); and (iii) 42 ± 5% in experiments with ≥10 μm Ca2+ added together with cAMP and ATP (Fig. 6). As expected, the contribution of endocytosis to the capacitance measurements is most pronounced at exceedingly elevated Ca2+ concentrations.
Figure 6.
Ca2+-dependent endocytosis contributes to the capacitance measurements. A, illustrative figure and equation showing how intervals of the endocytosis contribution to the measured capacitance signal were calculated. B, calculated endocytosis contribution under indicated different intracellular conditions (cAMP and ATP present at 100 μm and 3 mm, respectively).
Discussion
Here, we use a combined experimental and mathematical modeling approach to investigate the mechanisms regulating white adipocyte adiponectin secretion. We present the first mathematical model of adiponectin exocytosis. By taking advantage of both previously published and newly generated data, we draw quantitative conclusions that would have been impossible to assess without modeling.
Ca2+-dependent endocytosis ensues simultaneously with exocytosis
The final model equations can be translated back to a biological interaction graph that summarizes our findings (Fig. 7). We conclude that (i) the redistribution of vesicles from the Reserve pool to the Releasable pool includes an ATP-dependent component, and (ii) a negative effect of Ca2+, in the form of endocytosis, is needed to explain the capacitance measurements. The ability to quantify the contribution of endocytosis to recorded capacitance increases is essential for the interpretation of our adiponectin exocytosis studies. Importantly, the model presented here shows that we may underestimate the magnitude of adiponectin exocytosis in the presence of a physiologically relevant intracellular Ca2+ concentration and that the potentiating effect of Ca2+ on cAMP-stimulated adiponectin secretion is larger than displayed in our electrophysiological recordings (6). The finding that Ca2+-dependent endocytosis depends on the simultaneous presence of cAMP does not signify that endocytosis as such requires the presence of the cyclic nucleotide per se, but rather designates that endocytosis (plasma membrane retrieval) needs to be preceded by exocytosis (plasma membrane enlargement). The observation that the contribution of endocytosis is pronounced in the presence of ≥10 μm free Ca2+ (Fig. 6A) emphasizes the importance of performing the capacitance measurements under physiologically relevant conditions (thus in the intracellular presence of appropriate levels of mediators known to affect exocytosis). We found that the membrane retrieval was unaffected by intracellular ATP. This is in agreement with results in other peptide-secreting cell types such as rat corticotrophs (32) and mouse beta cells (33) where endocytosis has likewise been shown to proceed uniformly in the absence or presence of the nucleotide. Moreover, the lack of ATP dependence suggests that the endocytosis following cAMP-stimulated adiponectin secretion does not depend on protein phosphorylation. The magnitude of Ca2+-dependent endocytosis may appear rather large also under physiologically relevant conditions (≥20% Fig. 6B). However, the percentage of the measured signal corresponding to endocytosis predicted using our model is low compared with the calculated ratio of endocytosis/exocytosis after stimulated exocytosis in rat corticotrophs (32).
Figure 7.
Final model including endocytosis and back-translation to interaction graph. The developed model with ATP/endocytosis included and back-translation to an interaction graph, including the cell physiological insights from this work. In agreement with the original model (Fig. 1A), adiponectin exocytosis is triggered by cAMP alone and augmented by the combination of ATP and Ca2+. As revealed by this study, ATP is also required in combination with Ca2+ in order for adiponectin-containing vesicles to attain release competence (in our model, to be transferred from the reserve pool to the releasable pool). In addition to stimulating exocytosis, Ca2+ also induces membrane retrieval (endocytosis). The Ca2+-triggered endocytosis needs to be preceded by cAMP-triggered exocytosis (cf. Fig. 3C). The contribution of Ca2+-dependent endocytosis to the measured signal is substantial at unphysiologically high intracellular Ca2+ concentrations (see text for more details).
The developed model can predict adiponectin secretion/exocytosis
In the validation of the final model structure, we used all acceptable parameters that were justified for the new experimental conditions (see under “Results”) to include the uncertainty of the data in model predictions. This approach is important, because the optimal parameters and other acceptable parameters might give different but still plausible predictions for new data. We find that the developed model is able to predict adiponectin secretion under several different stimulatory conditions and at protracted time points in dynamic experiments (Fig. 5, D and E). This suggests that in the future the model can be used to predict whole-cell membrane capacitance responses at late time points that are methodologically challenging to measure experimentally, even though such analyses require further validation. Moreover, the finding that simulations of adiponectin secretion so accurately predict experimental results strengthens our proposal that adipocyte membrane capacitance increases in response to cAMP, with or without Ca2+, signify adiponectin vesicle fusion with the plasma membrane (6, 7).
We want to emphasize that although the model is in agreement with both estimations and validation data, there could be other models able to explain the data equally well. The developed model is, however, useful because it is (i) a minimal model based on current biological knowledge, (ii) reached after several rejections of simpler models, and (iii) currently the only existing model of adiponectin secretion. We encourage that our model be further advanced, by us or by others, when more data become available.
Using models to understand the pathophysiology of adiponectin exocytosis in metabolic disease
Recent work from our group has enhanced our understanding of adiponectin exocytosis in health and in metabolic disease. Using subcutaneous white adipocytes isolated from lean or obese/diabetic mice, we have shown that adiponectin exocytosis is stimulated by catecholamines (elevates cytoplasmic cAMP) and that the stimulation mainly involves activation of β3-adrenergic receptors. Moreover, adipocytes isolated from obese/diabetic mice display blunted catecholamine-stimulated adiponectin secretion in a state we define as “catecholamine resistance.” The blunted release is due to a secretory defect and does not result from reduced intracellular adiponectin content (34). To improve our understanding of the mechanistic details involved in adrenergically stimulated adiponectin exocytosis under pathophysiological conditions, it is necessary to further analyze the experimental data by use of a modeling approach.
The adiponectin secretion model presented in Fig. 7 can in the future be combined with models describing other cellular processes and functions in white adipocytes, e.g. the detailed insulin signaling and glucose uptake model in Ref. 17. Moreover, our adiponectin secretion model can be extended and included in a state-of-the-art multilevel model where interactions are studied on cellular, organic, and systemic levels. Such a convoluted model, where metabolic signaling pathways are continuously added, has already been developed for the glucose and insulin system (16, 35). Complex models of the regulation of whole body physiology, with ensuing additions of more regulators and sub-systems, are essential to enhance our understanding of pathophysiological metabolic conditions.
Experimental procedures
Mathematical modeling
All mathematical analyses, i.e. simulations and optimizations, were carried out in MATLAB R2016a using IQM tools (a continuation of the SBtoolbox2 package (36, 37)) and the MATLAB Global Optimization toolbox. A combination of the Global Optimization toolbox algorithms, particleswarm, fmincon, and simulannealbnd, were used to estimate the parameters. Models were based on ODE, and reactions were assumed to mainly follow mass action kinetics (see exceptions below). Rate constants are referred to as parameters, i.e. values that change the model output. Evaluation of parameters was done by simulating the model using IQM tools and then calculating the χ2 error according to Equation 1,
| (Eq. 1) |
Here, y denotes the measured data; ŷ denotes the model simulation to compare with data; S.E. denotes the standard error of the mean; t denotes the measured time points, and p denotes the model parameters. The sum is over all measured time points for all datasets. The calculated sum follows a χ2 distribution. Therefore, χ2 tests were used to determine model rejections (38). We used a significance level of 0.05, and the number of degrees of freedom equals the number of data points minus one parameter for normalization and minus the number of parameters in the model. For the time-series data (Fig. 2, A–D) with n = 7·4 = 28 data points, the border of rejections for the original model with 11 parameters is given by the inverse cumulative χ2 (28 − 1 − 11, 0.05) = 26.
All model files and code to simulate the models are available at github.com/elinnyman/adiponectin-secretion.7
Detailed description of the developed model
We aimed to develop a mathematical model that describes all our data for adiponectin secretion in adipocytes in an acceptable manner. We limited the scope and the size of the model to the available data to keep the estimation of parameters as simple as possible. The developed ODE model consists of two parts: the input equations and the actual adiponectin secretion model. The input equations describe the intracellular dynamics of Ca2+, ATP, and cAMP after infusion via the pipette solution. These equations all have the same format.
The states of the model are marked in bold. All input equations have the same format. As an example, the details of the Ca equation are as follows. In the steady-state simulation, kattach is set to 0, and when the pipette is attached to the cell, kattach changes from 0 to 1. The state Ca corresponds to the intracellular concentration of Ca. basalCa is the desired concentration of Ca in steady state (before attachment of the pipette), and targetCa is the desired final concentration after attachment of the pipette.
The parameters for these equations were allowed to vary within certain limits during the parameter estimation, to give some flexibility in the input dynamics. kCa was limited to 0.0035–0.7, to give a half-maximal response time roughly between 1 and 200 s. kATP and kcAMP were allowed to vary 10% from kCa. basalCa was allowed to vary between 35 and 230 nm, basalATP between 1 μm and 1 m, and basalcAMP between 1 nm and 0.1 m. The target values (targetCa, targetATP, and targetcAMP) were changed to match the experimental protocol.
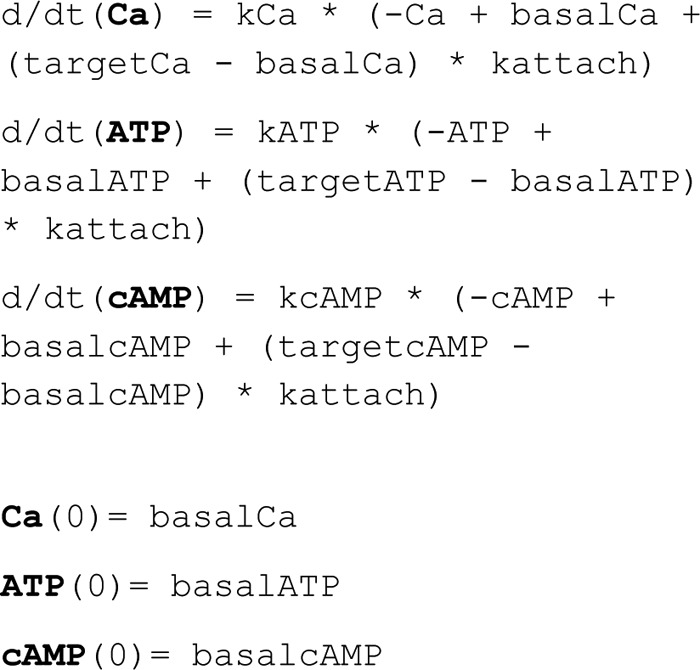
The adiponectin secretion model consists of three states.
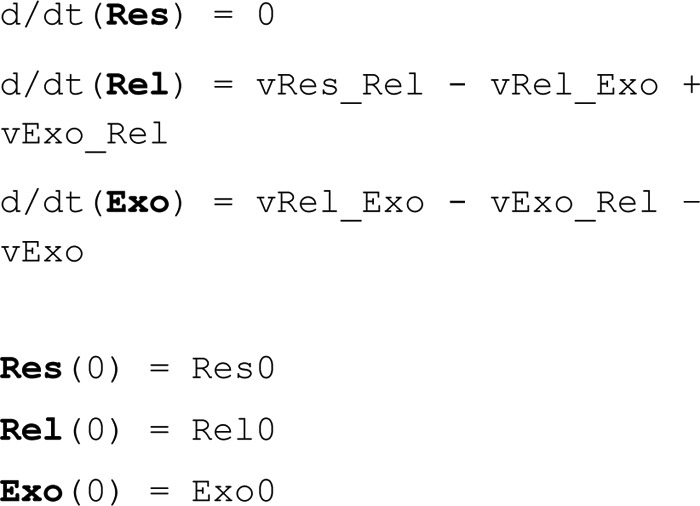
where Res is the Reserve Pool of vesicles, assumed to be in high abundance compared with the other pools of vesicles and thus assumed not to change over time. Rel is the Releasable Pool of vesicles, and Exo is the state of vesicles undergoing exocytosis. Res0 was chosen to be an arbitrary number, and the equations for Rel0 and Exo0 were derived by setting the ODEs to zero (i.e. force steady state) and then solving the system of equations. This gives the following.
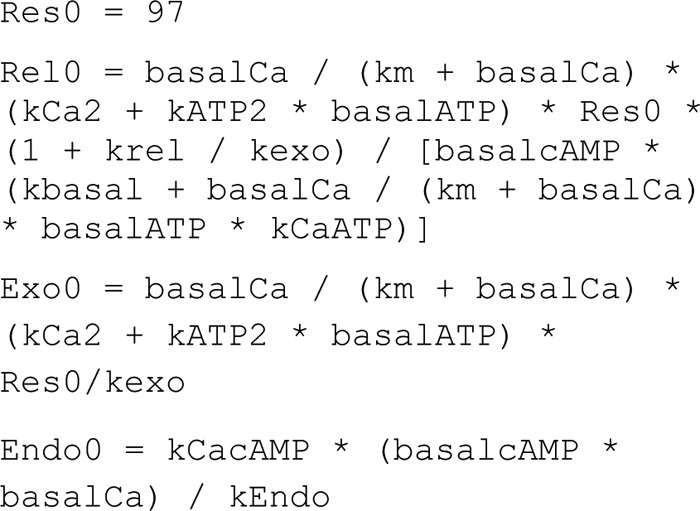
The reaction rates for the original model are as shown.
The reaction rate from the state Exo (vExo) corresponds to the measured rate of change compared with the capacitance measurements. A scaling parameter was used for transition to the unit-less model to the unit in the measurements (fF/s).
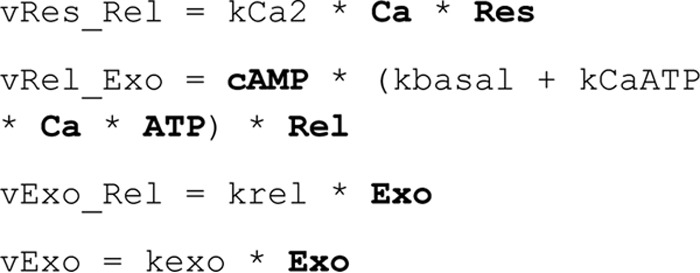

In the Exocytosis model–ATP, we modified the original model to include an extra ATP dependence with an ATP dependence of the reaction from Reserve pool to Releasable pool.

In the Exocytosis model–ATP/endocytosis model, the dynamics of the endocytotic vesicles are described:

The corresponding reaction rates are as shown:

The difference between the reaction rates (vExo–vEndo) was used to compare as the measured rate of change in the capacitance measurements in the endocytosis model. With a scaling parameter, the model output thus converts to

To be able to fit the data with high concentration of Ca2+, a saturation effect was added to the positive Ca2+ effects:
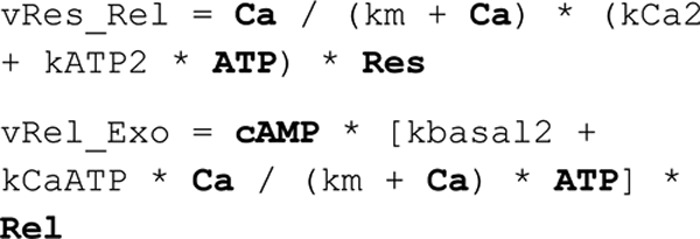
Model validation
In the model validation, we used the model to predict experimental data not used in the parameter estimation (measurements of accumulated released adiponectin). The model output that we compare with data is

We simulated the final model using all acceptable parameters, i.e. all found parameters that gave model simulations that passed a χ2 test. Instead of the previously used input equations for Ca2+, ATP, and cAMP, we used a wide range of values to simulate the predictions (see under “Results” for motivation of the intervals). We also added 25% uncertainty to the intervals.
For basal intervals

For FSK/IBMX simulation

For FSK/IBMX + BAPTA simulation

For FSK/IBMX + ionomycin simulation

To simulate the model predictions, we sampled from all acceptable parameters and used the maximum and the minimum values of the above intervals in all possible combinations to explore the entire interval of predictions.
Prediction of endocytosis contribution
In the evaluation of the contribution of endocytosis to the measured signal, the calculated ratio between the rate of endocytosis and the sum of endocytosis and exocytosis were multiplied times 100 to get the contribution in %.

To calculate the intervals of the contribution (Fig. 6, A and B), we performed parameter searches in the direction of this specific prediction (7). χ2 error for each value of the prediction is shown in the figures (Fig. 6B).
Experimental methods
All experimental data, with the exception of that presented in Figs. 3, A and B, and 5E and Table 2, are adapted from Ref. 6. The data in Ref. 6 consist of whole-cell patch-clamp recordings and ELISA measurements of secreted adiponectin. 3T3-L1 adipocytes were differentiated as described previously (6, 7).
Electrophysiology
3T3-L1 adipocytes, grown in plastic (Nunc, Denmark) Petri culture dishes, were continuously superfused during the recordings with an extracellular solution (EC) containing (in mm): 140 NaCl, 3.6 KCl, 2 NaHCO3, 0.5 NaH2PO4, 0.5 MgSO4, 5 Hepes (pH 7.4 with NaOH), 2.6 CaCl2 supplemented with 5 mm glucose. 3T3-L1 adipocyte exocytosis was measured as increase in membrane capacitance using an EPC-9 patch-clamp amplifier (HEKA Electronics, Lambrecht/Pfalz, Germany) and PatchMaster software. A fire-polished borosilicate glass pipette was attached to cells by gentle suction and electrical access attained by rupture of the plasma membrane within the patch. Consequently, the pipette filling solution (containing indicated concentrations of cAMP, ATP, and/or Ca2+) equilibrates with the cytosol. Cells were voltage-clamped at −70 mV. The pipette-filling solutions contained (in mm): 125 potassium glutamate, 10 KCl, 10 NaCl, 1 MgCl2, 5 Hepes (pH 7.15 with KOH) and were supplemented with cAMP, ATP, and Ca2+ as indicated. Exocytotic rates (ΔC/Δt) were measured by applying a linear fit to the capacitance trace at different time points and calculating the slope of the fitted line. For more details, see Ref. 6.
Measurements of released adiponectin
Secreted total adiponectin was measured using 3T3-L1 adipocytes grown on 12-well plates (Sarstedt) stimulated with EC containing indicated secretagogues during 15–60-min incubations at 32 °C, as described previously (6). EC aliquots and cell homogenates were stored at −80 °C. Secreted adiponectin (measured with mouse ELISA DuoSets; R&D Systems) was analyzed in relation to total protein content (Bradford protein assay).
CARS and MPEF microscopy
Live differentiated cells were stained with 2 μm CellTrackerTM Red CMTPX Dye (Molecular ProbesTM, Thermo Fisher Scientific) in serum-free medium for 30 min at 37 °C. The lipid content of the living cells was determined (Fig. 8) with combined CARS and MPEF microscopy on a custom-built setup (39). The 2845 cm−1 C–H stretching vibrations of triglycerides were driven with a spatially and temporal overlap of 2-ps pulsed laser beams (816.9 and 1064 nm, 7 ps, 76 MHz, Nd:vanadate, HighQ, pumped Levante Emerald OPO, APE Berlin, Germany) in the focal plane of an inverted microscope (Eclipse TE2000-E with a C2 confocal microscope scanning head, Nikon) using an oil immersion objective (Nikon Plan Fluor, ×40 NA 1.30). The cytosolic fluorescence probe was simultaneously excited with the 816.9 nm beam. Single photon-counting detectors (Becker & Hickl Gmbh) coupled with dichroic mirrors and bandpass filters (Semrock) were used to detect CARS signals in the forward direction (BP 661/20 nm) and MPEF signals in the epi-direction (609/57 nm). Five images with 5.04-μs pixel dwell time were summed for each acquisition. Individual cells were identified from the combined MPEF and CARS images, and their size was measured. The lipid signal per cell was separated, thresholded (RenyEnthropie algorithm) using ImageJ (National Institutes of Health), and also measured in size. Assuming a spherical shape, the cell and lipid volume can be estimated from the area (20 cells ×3 technical repeats; Fig. 8).
Figure 8.
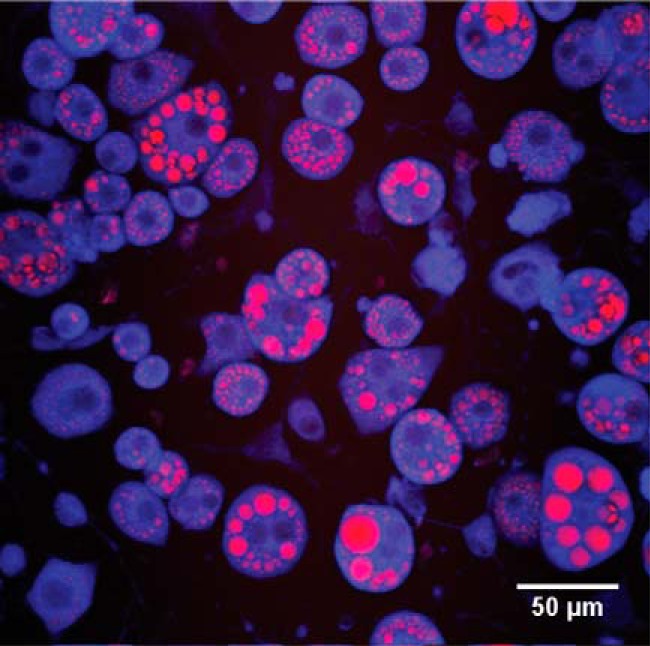
CARS and MPEF microscopy. Fully differentiated 3T3-L1 adipocytes imaged using CARS and MPEF. CARS signal is in red, and CellTrackerTM Red is shown in blue.
Confocal microscopy
Fully differentiated 3T3-L1 cells were fixed in 4% paraformaldehyde, stained with Hoechst (34580, Molecular Probes), and imaged using a Nikon Ti-E microscope. The images were analyzed (nuclear count) using Fiji/ImageJ.
Author contributions
C. B. planned the study, performed the experiments, analyzed models and data, and wrote the paper. W. L. performed modeling and contributed to the writing of the manuscript. A. P. performed the experiments, analyzed the data, and contributed to the writing of the manuscript. A. M. K., M. F. E. H., and S. M. performed the experiments and analyzed the data. T. A. performed modeling. E. N. planned the study, performed modeling, analyzed the models, and wrote the manuscript. C. S. O. planned the experiments, analyzed the data, wrote the manuscript, and contributed reagents and material. All authors have read, edited, and approved the final version of the manuscript.
Acknowledgments
We thank Dr. Gunnar Cedersund for valuable advice on early versions of this manuscript. We also thank undergraduate students Dennis Lilja and Rasmus Magnusson for contributing to the initial model development as part of bachelor projects.
This work was supported by Swedish Diabetes Foundation Grant DIA2015-062, the Goljes Memory Fund, Swedish Medical Research Council Grants 2010-2656 and 2013-7107, and AstraZeneca. AstraZeneca provided support in the form of salary for author E. N.
Please note that the JBC is not responsible for the long-term archiving and maintenance of this site or any other third party hosted site.
- ODE
- ordinary differential equation
- BAPTA
- 1,2-bis(2-aminophenoxy)ethane-N,N,N′,N′-tetraacetic
- fF
- femtofarad
- IBMX
- 3-isobutyl-1-methylxanthine
- CARS
- coherent anti-Stokes Raman scattering
- MPEF
- multiphoton excitation fluorescence
- FSK
- forskolin.
References
- 1. Li S., Shin H. J., Ding E. L., and van Dam R. M. (2009) Adiponectin levels and risk of type 2 diabetes: a systematic review and meta-analysis. JAMA 302, 179–188 [DOI] [PubMed] [Google Scholar]
- 2. Burgoyne R. D., and Morgan A. (2003) Secretory granule exocytosis. Physiol. Rev. 83, 581–632 [DOI] [PubMed] [Google Scholar]
- 3. Bogan J. S., and Lodish H. F. (1999) Two compartments for insulin-stimulated exocytosis in 3t3-L1 adipocytes defined by endogenous Acrp30 and Glut4. J. Cell Biol. 146, 609–620 [DOI] [PMC free article] [PubMed] [Google Scholar]
- 4. Xie L., O'Reilly C. P., Chapes S. K., and Mora S. (2008) Adiponectin and leptin are secreted through distinct trafficking pathways in adipocytes. Biochim. Biophys. Acta 1782, 99–108 [DOI] [PMC free article] [PubMed] [Google Scholar]
- 5. Bose A., Guilherme A., Huang S., Hubbard A. C., Lane C. R., Soriano N. A., and Czech M. P. (2005) The v-SNARE Vti1a regulates insulin-stimulated glucose transport and Acrp30 secretion in 3T3-L1 adipocytes. J. Biol. Chem. 280, 36946–36951 [DOI] [PubMed] [Google Scholar]
- 6. Komai A. M., Brännmark C., Musovic S., and Olofsson C. S. (2014) PKA-independent cAMP stimulation of white adipocyte exocytosis and adipokine secretion: modulations by Ca2+ and ATP. J. Physiol. 592, 5169–5186 [DOI] [PMC free article] [PubMed] [Google Scholar]
- 7. El Hachmane M. F., Komai A. M., and Olofsson C. S. (2015) Cooling reduces cAMP-stimulated exocytosis and adiponectin secretion at a Ca2+-dependent step in 3T3-L1 adipocytes. PLoS ONE 10, e0119530. [DOI] [PMC free article] [PubMed] [Google Scholar]
- 8. Cedersund G. (2012) Conclusions via unique predictions obtained despite unidentifiability–new definitions and a general method. FEBS J. 279, 3513–3527 [DOI] [PubMed] [Google Scholar]
- 9. Nyman E., Lindgren I., Lövfors W., Lundengård K., Cervin I., Sjöström T. A., Altimiras J., and Cedersund G. (2015) Mathematical modeling improves EC50 estimations from classical dose-response curves. FEBS J. 282, 951–962 [DOI] [PubMed] [Google Scholar]
- 10. Galvanovskis J., Braun M., and Rorsman P. (2011) Exocytosis from pancreatic β-cells: mathematical modelling of the exit of low-molecular-weight granule content. Interface Focus 1, 143–152 [DOI] [PMC free article] [PubMed] [Google Scholar]
- 11. Goforth P. B., Bertram R., Khan F. A., Zhang M., Sherman A., and Satin L. S. (2002) Calcium-activated K+ channels of mouse β-cells are controlled by both store and cytoplasmic Ca2+: experimental and theoretical studies. J. Gen. Physiol. 120, 307–322 [DOI] [PMC free article] [PubMed] [Google Scholar]
- 12. Keizer J., and Magnus G. (1989) ATP-sensitive potassium channel and bursting in the pancreatic beta cell. A theoretical study. Biophys. J. 56, 229–242 [DOI] [PMC free article] [PubMed] [Google Scholar]
- 13. Amatore C., Bouret Y., Travis E. R., and Wightman R. M. (2000) Interplay between membrane dynamics, diffusion and swelling pressure governs individual vesicular exocytotic events during release of adrenaline by chromaffin cells. Biochimie 82, 481–496 [DOI] [PubMed] [Google Scholar]
- 14. Jarukanont D., Bonifas Arredondo I., Femat R., and Garcia M. E. (2015) Vesicle motion during sustained exocytosis in chromaffin cells: numerical model based on amperometric measurements. PLoS ONE 10, e0144045. [DOI] [PMC free article] [PubMed] [Google Scholar]
- 15. Sun L., Xiong Y., Zeng X., Wu Y., Pan N., Lingle C. J., Qu A., and Ding J. (2009) Differential regulation of action potentials by inactivating and noninactivating BK channels in rat adrenal chromaffin cells. Biophys. J. 97, 1832–1842 [DOI] [PMC free article] [PubMed] [Google Scholar]
- 16. Brännmark C., Nyman E., Fagerholm S., Bergenholm L., Ekstrand E. M., Cedersund G., and Strålfors P. (2013) Insulin signaling in type 2 diabetes: experimental and modeling analyses reveal mechanisms of insulin resistance in human adipocytes. J. Biol. Chem. 288, 9867–9880 [DOI] [PMC free article] [PubMed] [Google Scholar]
- 17. Nyman E., Rajan M. R., Fagerholm S., Brännmark C., Cedersund G., and Strålfors P. (2014) A single mechanism can explain network-wide insulin resistance in adipocytes from obese patients with type 2 diabetes. J. Biol. Chem. 289, 33215–33230 [DOI] [PMC free article] [PubMed] [Google Scholar]
- 18. Sips F. L., Nyman E., Adiels M., Hilbers P. A., Strålfors P., van Riel N. A., and Cedersund G. (2015) Model-based quantification of the systemic interplay between glucose and fatty acids in the postprandial state. PLoS ONE 10, e0135665. [DOI] [PMC free article] [PubMed] [Google Scholar]
- 19. Rajan M. R., Nyman E., Kjølhede P., Cedersund G., and Strålfors P. (2016) Systems-wide experimental and modeling analysis of insulin signaling through Forkhead box protein O1 (FOXO1) in human adipocytes, normally and in Type 2 diabetes. J. Biol. Chem. 291, 15806–15819 [DOI] [PMC free article] [PubMed] [Google Scholar]
- 20. Artalejo C. R., Henley J. R., McNiven M. A., and Palfrey H. C. (1995) Rapid endocytosis coupled to exocytosis in adrenal chromaffin cells involves Ca2+, GTP, and dynamin but not clathrin. Proc. Natl. Acad. Sci. U.S.A. 92, 8328–8332 [DOI] [PMC free article] [PubMed] [Google Scholar]
- 21. Engisch K. L., and Nowycky M. C. (1998) Compensatory and excess retrieval: two types of endocytosis following single step depolarizations in bovine adrenal chromaffin cells. J. Physiol. 506, 591–608 [DOI] [PMC free article] [PubMed] [Google Scholar]
- 22. Hosoi N., Holt M., and Sakaba T. (2009) Calcium dependence of exo- and endocytotic coupling at a glutamatergic synapse. Neuron 63, 216–229 [DOI] [PubMed] [Google Scholar]
- 23. Sun T., Wu X. S., Xu J., McNeil B. D., Pang Z. P., Yang W., Bai L., Qadri S., Molkentin J. D., Yue D. T., and Wu L. G. (2010) The role of calcium/calmodulin-activated calcineurin in rapid and slow endocytosis at central synapses. J. Neurosci. 30, 11838–11847 [DOI] [PMC free article] [PubMed] [Google Scholar]
- 24. He Z., Fan J., Kang L., Lu J., Xue Y., Xu P., Xu T., and Chen L. (2008) Ca2+ triggers a novel clathrin-independent but actin-dependent fast endocytosis in pancreatic beta cells. Traffic 9, 910–923 [DOI] [PubMed] [Google Scholar]
- 25. Klip A., and Ramlal T. (1987) Cytoplasmic Ca2+ during differentiation of 3T3-L1 adipocytes. Effect of insulin and relation to glucose transport. J. Biol. Chem. 262, 9141–9146 [PubMed] [Google Scholar]
- 26. Schwabe U., Ebert R., and Erbler H. C. (1973) Adenosine release from isolated fat cells and its significance for the effects of hormones on cyclic 3′,5′-AMP levels and lipolysis. Naunyn Schmiedebergs Arch. Pharmacol. 276, 133–148 [DOI] [PubMed] [Google Scholar]
- 27. Zu L., Jiang H., He J., Xu C., Pu S., Liu M., and Xu G. (2008) Salicylate blocks lipolytic actions of tumor necrosis factor-α in primary rat adipocytes. Mol. Pharmacol. 73, 215–223 [DOI] [PubMed] [Google Scholar]
- 28. Börner S., Schwede F., Schlipp A., Berisha F., Calebiro D., Lohse M. J., and Nikolaev V. O. (2011) FRET measurements of intracellular cAMP concentrations and cAMP analog permeability in intact cells. Nat. Protoc. 6, 427–438 [DOI] [PubMed] [Google Scholar]
- 29. Iancu R. V., Ramamurthy G., Warrier S., Nikolaev V. O., Lohse M. J., Jones S. W., and Harvey R. D. (2008) Cytoplasmic cAMP concentrations in intact cardiac myocytes. Am. J. Physiol. Cell Physiol. 295, C414–C422 [DOI] [PMC free article] [PubMed] [Google Scholar]
- 30. Hresko R. C., Heimberg H., Chi M. M., and Mueckler M. (1998) Glucosamine-induced insulin resistance in 3T3-L1 adipocytes is caused by depletion of intracellular ATP. J. Biol. Chem. 273, 20658–20668 [DOI] [PubMed] [Google Scholar]
- 31. Kennedy H. J., Pouli A. E., Ainscow E. K., Jouaville L. S., Rizzuto R., and Rutter G. A. (1999) Glucose generates sub-plasma membrane ATP microdomains in single islet beta cells. Potential role for strategically located mitochondria. J. Biol. Chem. 274, 13281–13291 [DOI] [PubMed] [Google Scholar]
- 32. Lee A. K., and Tse A. (2001) Endocytosis in identified rat corticotrophs. J. Physiol. 533, 389–405 [DOI] [PMC free article] [PubMed] [Google Scholar]
- 33. Eliasson L., Proks P., Ammälä C., Ashcroft F. M., Bokvist K., Renström E., Rorsman P., and Smith P. A. (1996) Endocytosis of secretory granules in mouse pancreatic beta cells evoked by transient elevation of cytosolic calcium. J. Physiol. 493, 755–767 [DOI] [PMC free article] [PubMed] [Google Scholar]
- 34. Komai A. M., Musovic S., Peris E., Alrifaiy A., El Hachmane M. F., Johansson M., Wernstedt Asterholm I., and Olofsson C. S. (2016) White adipocyte adiponectin exocytosis is stimulated via β3 adrenergic signaling and activation of Epac1: catecholamine resistance in obesity and type 2 diabetes. Diabetes 65, 3301–3313 [DOI] [PubMed] [Google Scholar]
- 35. Nyman E., Brännmark C., Palmér R., Brugård J., Nyström F. H., Strålfors P., and Cedersund G. (2011) A hierarchical whole-body modeling approach elucidates the link between in vitro insulin signaling and in vivo glucose homeostasis. J. Biol. Chem. 286, 26028–26041 [DOI] [PMC free article] [PubMed] [Google Scholar]
- 36. Schmidt H., and Jirstrand M. (2006) Systems biology toolbox forMATLAB: a computational platform for research in systems biology. Bioinformatics 22, 514–515 [DOI] [PubMed] [Google Scholar]
- 37. Schmidt H. (2007) SBaddon: high performance simulation for the systems biology toolbox for MATLAB. Bioinformatics 23, 646–647 [DOI] [PubMed] [Google Scholar]
- 38. Cedersund G., Roll J., Ulfhielm E., Danielsson A., Tidefelt H., and Strålfors P. (2008) Model-based hypothesis testing of key mechanisms in initial phase of insulin signaling. PLoS Comput. Biol. 4, e1000096. [DOI] [PMC free article] [PubMed] [Google Scholar]
- 39. Brackmann C., Gabrielsson B., Svedberg F., Holmaang A., Sandberg A. S., and Enejder A. (2010) Nonlinear microscopy of lipid storage and fibrosis in muscle and liver tissues of mice fed high-fat diets. J. Biomed. Opt. 15, 066008 [DOI] [PubMed] [Google Scholar]


