

Abstract
Our objective was to characterize the distribution, diversity and patterns of hepatitis C virus (HCV) genotypes in the Middle East and North Africa (MENA). Source of data was a database of HCV genotype studies in MENA populated using a series of systematic literature searches. Pooled mean proportions were estimated for each genotype and by country using DerSimonian‐Laird random‐effects meta‐analyses. Genotype diversity within countries was assessed using Shannon Diversity Index. Number of chronic infections by genotype and country was calculated using the pooled proportions and country‐specific numbers of chronic infection. Analyses were conducted on 338 genotype studies including 82 257 genotyped individuals. Genotype 1 was dominant (≥50%) in Algeria, Iran, Morocco, Oman, Tunisia, and UAE, and was overall ubiquitous across the region. Genotype 2 was common (10‐50%) in Algeria, Bahrain, Libya, and Morocco. Genotype 3 was dominant in Afghanistan and Pakistan. Genotype 4 was dominant in Egypt, Iraq, Jordan, Palestine, Qatar, Saudi Arabia, and Syria. Genotypes 5, 6, and 7 had limited or no presence across countries. Genotype diversity varied immensely throughout MENA. Weighted by population size, MENA's chronic infections were highest among genotype 3, followed by genotype 4, genotype 1, genotype 2, genotype 5, and genotype 6. Despite ubiquitous presence of genotype 1, the vast majority of chronic infections were of genotypes 3 or 4, because of the sizable epidemics in Pakistan and Egypt. Three sub‐regional patterns were identified: genotype 3 pattern centered in Pakistan, genotype 4 pattern centered in Egypt, and genotype 1 pattern ubiquitous in most MENA countries.
Keywords: epidemiology, genotype, Hepatitis C virus, meta‐analysis, Middle East and North Africa, transmission
1. INTRODUCTION
Hepatitis C virus (HCV) is a blood‐borne pathogen, with the majority of chronically infected individuals showing clinical manifestations 20‐30 years after the onset of infection.1 Chronic HCV infection causes several morbidities, such as liver cirrhosis and liver cancer, and is a main indication for liver transplantation.2, 3, 4 HCV related morbidity and mortality place a burden on healthcare systems worldwide, as an estimated 62‐79 million people are chronically infected, globally.5 The Middle East and North Africa (MENA) region is the most affected by HCV infection, with over 15 million chronically infected individuals.5, 6
HCV demonstrates substantial genetic diversity and can be classified into seven main genotypes, numbered from one to seven, and 67 subtypes.7 HCV genotype distribution varies across the globe.7, 8 Genotypes 1 and three are prevalent genotypes worldwide, while genotype two is common in West Africa and South America, and genotypes 4 and 6 are common in Central/North Africa and East/Southern Asia, respectively.7, 8
Knowledge of HCV genotype distribution, diversity, and patterns contribute to effective control of HCV infection.9 Genotype distribution can reveal inferences about the modes of transmission and sources of infection.7, 10 Importantly, HCV genotype is a predictor of response to direct‐acting antiviral (DAA) treatment, and is therefore integral in selection and duration of interferon‐free DAA regimens.11 As such, this study aims to characterize the distribution, diversity, and patterns of HCV genotypes in MENA by (1) estimating the country‐specific pooled mean proportions of HCV genotypes; (2) assessing the country‐specific genotype diversity; and (3) estimating the country‐specific number of chronically infected individuals by genotype. This study was conducted under the umbrella of the MENA HCV Epidemiology Synthesis Project, an on‐going effort to characterize HCV epidemiology and inform key public health research, policy and programming priorities in MENA.12, 13, 14, 15, 16, 17, 18, 19, 20
2. MATERIALS AND METHODS
2.1. Data sources
The source of data for our study was the MENA HCV Epidemiology Synthesis Project database, a comprehensive database of HCV epidemiological measures.12, 13, 14, 15, 16, 17, 18, 19, 20 The database consists of several sub‐databases such as an HCV genotype frequency sub‐database comprised of 338 HCV genotype studies among 82 257 participants, an HCV antibody prevalence sub‐database comprised of 2543 antibody prevalence studies among 51 598 736 participants, and an HCV RNA prevalence (among antibody positive persons) database comprised of 178 RNA prevalence studies among 19 593 HCV antibody positive participants. The MENA HCV Epidemiology Synthesis Project database was populated through a series of systematic reviews for HCV infection across MENA.12, 13, 14, 15, 16, 17, 18, 19, 20 The reviews were informed by Cochrane Collaboration handbook21 and reported their findings using the Preferred Reporting Items for Systematic reviews and Meta‐analyses (PRISMA) guidelines.22
Data sources for these reviews included peer‐reviewed publications identified through international scientific databases (PubMed and Embase), regional and country‐level scientific databases (World Health Organization [WHO] Index Medicus for the Eastern Mediterranean Region, the Iraqi Academic Scientific Journals’ database, Iran's Scientific Information Database, among others), MENA HIV/AIDS Epidemiology Synthesis Project database,23, 24 abstract archives of non‐indexed international conferences, and gray literature comprised of public health reports and routine data reporting. Broad search criteria were used combining medical index terms exploded to cover all subheadings and free text terms for HCV and country names, to ensure inclusiveness. No language restrictions were used as non‐English articles were extracted by native speakers. Screening of articles was restricted to those published after 1989, the year in which HCV was first identified.25, 26
Our definition of MENA included 24 countries: Afghanistan, Algeria, Bahrain, Djibouti, Egypt, Iran, Iraq, Jordan, Kuwait, Lebanon, Libya, Mauritania, Morocco, Oman, Pakistan, Palestine, Qatar, Saudi Arabia, Somalia, Sudan, Syria, Tunisia, the United Arab Emirates (UAE), and Yemen. Genotype information for all articles retrieved during these systematic literatures searches were extracted and subsequently used to populate the HCV genotype sub‐database. Individuals with untypeable HCV genotypes were removed from the overall sample size in each study. Individuals with mixed HCV genotypes and subtype contributed separately to the quantification of each genotype and subtype.
2.2. Meta‐analyses of genotype proportions
DerSimonian‐Laird random‐effects meta‐analyses with inverse variance weighting27 were performed to estimate the country‐specific pooled mean proportion for each HCV genotype and the corresponding 95% confidence interval (CI). The variance was stabilized using the Freeman‐Tukey type arcsine square‐root transformation.28 Cochran's Q test was conducted to assess heterogeneity in effect size; a P‐value <0.1 was considered significant.27, 29 The I2 was calculated to assess the proportion of between‐study variation in effect size that is due to true differences between studies rather than chance27. The meta‐analyses were performed when at least three measures were available for each pooled category. The mean of reported proportions was calculated whenever only two measures were available. A genotype was considered dominant if the mean proportion was ≥50%, common if the mean proportion was between 10% and 50%, and limited if the mean proportion was <10%. Statistical analyses were performed on R version 3.1.2,30 and geographical mapping was conducted on Tableau 10.1.31
2.3. Analyses of genotype diversity
The diversity of HCV genotypes was assessed by calculating the Shannon Diversity Index, with higher scores indicating more diversity.32 Assuming equal distribution of the seven HCV genotypes (that is highest diversity possible),7 the highest Shannon Diversity Index score attainable is 1.95.32
2.4. Estimation of number of HCV chronically infected individuals with each genotype
The country‐specific number of chronically infected individuals with each genotype was calculated by multiplying the country‐specific pooled mean proportion for each genotype by the number of individuals with chronic HCV infection in each country as estimated by Chemaitelly et al33 The latter was calculated based on mathematical modeling and meta‐analyses using the HCV antibody prevalence and HCV RNA prevalence sub‐databases of the MENA HCV Epidemiology Synthesis Project database.12, 13, 14, 15, 16, 17, 18, 19, 20 The country‐specific pooled mean proportion for each genotype was adjusted so that the sum of all genotype proportions totaled 100%. Demographics for each country was obtained from the United Nations 2015 World Population Prospects database.34
3. RESULTS
3.1. Scope of the evidence
Supplementary Table S1 lists the details of the 338 identified HCV genotype studies in MENA including 82 257 genotyped individuals. Genotype information was available for 20 of the 24 included countries, 15 of which had sufficient number of studies to conduct meta‐analyses (Table 1). There were too few studies from Bahrain, Kuwait, Oman, Qatar, and Sudan to perform meta‐analyses. Additionally, the study from Sudan had an insignificant sample size (n = 4; all of which were genotype 4), and therefore was excluded from further analyses. No studies were identified from Djibouti, Mauritania, Somalia, and Yemen; these countries were also excluded from further analysis. Pakistan had the largest number of studies (n = 92) and the largest sample size of genotyped individuals (N = 36 111). Iran was second with 66 studies including 23 134 genotyped individuals. Each of the remaining countries had less than 10 000 genotyped individuals (Table 1).
Table 1.
Country‐specific pooled mean proportion for each hepatitis C virus (HCV) genotype across the Middle East and North Africa (MENA)
| Studies | Samples | Proportion (actual studies) | Proportion (meta‐analysis) | Heterogeneity measures | |||
|---|---|---|---|---|---|---|---|
| Country | Total N | Total n | Range (%) | Mean (%) | 95%CI a | Q (P‐value) b | I 2 (confidence limits) c |
| Genotype 1 | |||||||
| Afghanistan | 3 | 71 | 0.0‐47.8 | 34.6 | 20.8‐49.5 | 1.7 (P = 0.440) | |
| Algeria | 7 | 3806 | 55.6‐88.8 | 78.0 | 70.2‐85.0 | 110.7 (P < 0.001) | 94.6 (91.1‐96.7) |
| Bahrain | 2 | 107 | 47.9‐55.6 | 48.6 | 39.3‐58.0 | ||
| Egypt | 47 | 5031 | 0.0‐25.0 | 2.5 | 1.3‐4.1 | 177.6 (P < 0.001) | 74.1 (65.5‐80.5) |
| Iran | 66 | 23 134 | 13.5‐100 | 56.3 | 52.9‐59.6 | 1022.4 (P < 0.001) | 93.6 (92.5‐94.6) |
| Iraq | 19 | 681 | 0.0‐71.4 | 34.7 | 22.6‐47.7 | 143.1 (P < 0.001) | 87.4 (81.8‐91.3) |
| Jordan | 4 | 71 | 0.0‐73.3 | 22.8 | 0.0‐66.8 | 31.8 (P < 0.001) | 90.6 (78.9‐95.8) |
| Kuwait | 1 | 108 | 27.8 | 20.2‐36.9 | |||
| Lebanon | 20 | 543 | 0.0‐100 | 38.9 | 30.4‐47.7 | 51.7 (P < 0.001) | 63.3 (40.6‐77.3) |
| Libya | 6 | 4236 | 28.6‐35.8 | 32.8 | 31.0‐34.7 | 8.5 (P = 0.132) | 41.0 (0.0‐76.6) |
| Morocco | 13 | 2636 | 35.6‐100 | 69.4 | 53.7‐83.2 | 386.4 (p < 0.001) | 96.9 (95.8‐97.7) |
| Oman | 1 | 33 | 54.5 | 38.0‐70.2 | |||
| Pakistan | 92 | 36 111 | 0.0‐64.1 | 9.1 | 7.4‐11.0 | 1962.9 (P < 0.001) | 95.4 (94.8‐95.9) |
| Palestine | 4 | 152 | 8.7‐50.0 | 19.9 | 7.4‐35.6 | 5.7 (P = 0.129) | 47.0 (0.0‐82.4) |
| Qatar | 1 | 400 | 19.8 | 16.1‐23.9 | |||
| Saudi Arabia | 23 | 2652 | 0.0‐75.0 | 34.4 | 27.5‐41.6 | 213.2 (P < 0.001) | 89.7 (85.8‐92.5) |
| Syria | 3 | 674 | 10.0‐60.7 | 33.5 | 12.1‐58.9 | 13.4 (P < 0.001) | 85.0 (55.8‐94.9) |
| Tunisia | 22 | 1578 | 50.0‐100 | 85.9 | 78.0‐92.5 | 196.2 (P < 0.001) | 89.3 (85.2‐92.3) |
| UAE | 4 | 233 | 26.9‐75.0 | 52.4 | 30.8‐73.7 | 23.5 (P < 0.001) | 87.2 (69.4‐94.7) |
| MENA | 338 | 82 257 | 0.0‐100 | 30.2 | 26.8‐33.8 | 31841 (P < 0.001) | 98.9 (98.9‐99.0) |
| Genotype 2 | |||||||
| Afghanistan | 3 | 71 | 0.0‐0.0 | 0.0 | 0.6 (P = 0.732) | ||
| Algeria | 7 | 3806 | 8.6‐37.0 | 15.3 | 9.6‐22.0 | 98.8 (P < 0.001) | 93.9 (89.9‐96.4) |
| Bahrain | 2 | 107 | 9.2‐33.3 | 11.2 | 6.5‐18.6 | ||
| Egypt | 47 | 5031 | 0.0‐55.6 | 0.2 | 0.0‐1.1 | 230.2 (P < 0.001) | 80.0 (74.0‐84.7) |
| Iran | 66 | 23 134 | 0.0‐38.0 | 0.4 | 0.0‐1.0 | 575.1 (P < 0.001) | 88.7 (86.3‐90.6) |
| Iraq | 19 | 681 | 0.0‐6.0 | 0.0 | 0.0‐0.0 | 12.2 (P = 0.838) | 0.0 (0.0‐24.5) |
| Jordan | 4 | 71 | 0.0‐0.0 | 0.0 | 0.0‐1.1 | 0.4 (P = 0.933) | |
| Kuwait | 1 | 108 | 0.0 | 0.0‐3.4 | |||
| Lebanon | 20 | 543 | 0.0‐80.0 | 7.4 | 1.1‐16.8 | 127.6 (P < 0.001) | 85.1 (78.3‐89.8) |
| Libya | 6 | 4236 | 13.9‐21.2 | 17.7 | 15.3‐20.0 | 21.7 (P < 0.001) | 76.9 (48.5‐89.7) |
| Morocco | 13 | 2636 | 0.0‐63.2 | 16.7 | 4.3‐34.4 | 614.8 (P < 0.001) | 98.0 (97.5‐98.5) |
| Oman | 1 | 33 | 9.1 | 3.1‐23.6 | |||
| Pakistan | 92 | 36 111 | 0.0‐50.8 | 4.1 | 2.6‐5.8 | 3041.6 (P < 0.001) | 97.0 (96.7‐97.3) |
| Palestine | 4 | 152 | 0.0‐4.4 | 0.0 | 0.0‐1.8 | 3.9 (P = 0.271) | 23.3 (0.0‐88.3) |
| Qatar | 1 | 400 | 0.5 | 0.1‐1.8 | |||
| Saudi Arabia | 23 | 2652 | 0.0‐7.4 | 1.4 | 0.4‐2.8 | 49.3 (P < 0.001) | 55.3 (28.6‐72.1) |
| Syria | 3 | 674 | 0.0‐0.8 | 0.0 | 0.0‐0.2 | 0.1 (P = 0.928) | |
| Tunisia | 22 | 1578 | 0.0‐37.5 | 5.1 | 1.5‐9.9 | 128.7 (P < 0.001) | 83.7 (76.4‐88.7) |
| UAE | 4 | 233 | 0.0‐33.3 | 1.2 | 0.0‐6.5 | 7.1 (P = 0.067) | 58.0 (0.0‐86.0) |
| MENA | 338 | 82 257 | 0.0‐63.2 | 2.5 | 1.6‐3.5 | 11940.7 (P < 0.001) | 97.2 (97.0‐97.3) |
| Genotype 3 | |||||||
| Afghanistan | 3 | 71 | 52.2‐100 | 65.4 | 50.5‐79.2 | 1.7 (P = 0.437) | 0.0 (0.0‐87.5) |
| Algeria | 7 | 3806 | 0.0‐10.4 | 3.0 | 1.6‐4.9 | 25 (P < 0.001) | 76.0 (49.3‐88.6) |
| Bahrain | 2 | 107 | 0.0‐20.4 | 18.7 | 12.4‐27.1 | ||
| Egypt | 47 | 5031 | 0.0‐33.3 | 0.0 | 0.0‐0.5 | 164.4 (P < 0.001) | 72.0 (62.6‐79.1) |
| Iran | 66 | 23 134 | 0.0‐65.7 | 38.8 | 35.7‐41.9 | 878.9 (P < 0.001) | 92.6 (91.3‐93.7) |
| Iraq | 19 | 681 | 0.0‐21.7 | 0.2 | 0.0‐3.3 | 68.8 (P < 0.001) | 73.8 (58.9‐83.3) |
| Jordan | 4 | 71 | 0.0‐0.0 | 0.0 | 0.0‐1.1 | 0.4 (P = 0.933) | 0.0 (0.0‐0.0) |
| Kuwait | 1 | 108 | 25.0 | 17.8‐33.9 | |||
| Lebanon | 20 | 543 | 0.0‐58.6 | 7.8 | 2.3‐15.3 | 78.6 (P < 0.001) | 75.8 (62.8‐84.3) |
| Libya | 6 | 4236 | 6.0‐21.0 | 13.7 | 9.1‐19.1 | 112.7 (P < 0.001) | 95.6 (92.6‐97.3) |
| Morocco | 13 | 2636 | 0.0‐50.0 | 3.2 | 0.4‐7.9 | 124.6 (P < 0.001) | 90.4 (85.4‐93.7) |
| Oman | 1 | 33 | 9.1 | 3.1‐23.6 | |||
| Pakistan | 92 | 36 111 | 0.0‐100 | 81.4 | 77.9‐84.8 | 4410.5 (P < 0.001) | 97.9 (97.7‐98.1) |
| Palestine | 4 | 152 | 0.0‐8.7 | 0.0 | 0.0‐7.7 | 6.7 (P = 0.081) | 55.5 (0.0‐85.3) |
| Qatar | 1 | 400 | 15.8 | 12.5‐19.6 | |||
| Saudi Arabia | 23 | 2652 | 0.0‐33.3 | 0.8 | 0.0‐2.3 | 75.2 (P < 0.001) | 70.7 (55.4‐80.8) |
| Syria | 3 | 674 | 0.0‐1.7 | 0.3 | 0.0‐1.2 | 0.2 (P = 0.903) | 0.0 (0.0‐0.0) |
| Tunisia | 22 | 1578 | 0.0‐25.0 | 0.7 | 0.0‐3.4 | 100.3 (P < 0.001) | 79.1 (68.9‐85.9) |
| UAE | 4 | 233 | 0.0‐33.6 | 11.8 | 0.1‐33.1 | 32 (P < 0.001) | 90.6 (79.0‐95.8) |
| MENA | 338 | 82 257 | 0.0‐100 | 26.8 | 22.4‐31.5 | 60629.7 (P < 0.001) | 99.4 (99.4‐99.5) |
| Genotype 4 | |||||||
| Afghanistan | 3 | 71 | 0.0‐0.0 | 0.0 | 0.0‐0.0 | 0.6 (P = 0.732) | 0.0 (0.0‐66.6) |
| Algeria | 7 | 3806 | 0.0‐7.4 | 1.4 | 0.6‐2.4 | 14.1 (P = 0.028) | 57.5 (1.5‐81.6) |
| Bahrain | 2 | 107 | 11.1‐22.4 | 21.5 | 14.8‐30.2 | ||
| Egypt | 47 | 5031 | 22.2‐100 | 93.1 | 89.8‐95.9 | 432.6 (P < 0.001) | 89.4 (86.7‐91.5) |
| Iran | 66 | 23 134 | 0.0‐25.0 | 0.0 | 0.0‐0.1 | 238.1 (P < 0.001) | 72.7 (65.2‐78.6) |
| Iraq | 19 | 681 | 21.4‐100 | 60.0 | 46.3‐73.1 | 157.9 (P < 0.001) | 88.6 (83.7‐92.0) |
| Jordan | 4 | 71 | 26.7‐100 | 77.2 | 33.2‐100 | 31.8 (P < 0.001) | 90.6 (78.9‐95.8) |
| Kuwait | 1 | 108 | 47.2 | 38.1‐56.6 | |||
| Lebanon | 20 | 543 | 0.0‐100 | 31.5 | 20.6‐43.4 | 102.6 (P > 0.001) | 81.5 (72.4‐87.6) |
| Libya | 6 | 4236 | 27.6‐45.3 | 35.3 | 30.2‐40.6 | 63.96 (P < 0.001) | 92.2 (85.7‐95.7) |
| Morocco | 13 | 2636 | 0.0‐18.8 | 0.9 | 0.0‐2.8 | 44.4 (P < 0.001) | 72.9 (52.9‐84.5) |
| Oman | 1 | 33 | 27.3 | 15.1‐44.2 | |||
| Pakistan | 92 | 36 111 | 0.0‐17.1 | 0.1 | 0.0‐0.6 | 1188.6 (P < 0.001) | 92.3 (91.2‐93.4) |
| Palestine | 4 | 152 | 50.0‐85.7 | 75.0 | 66.9‐82.3 | 1.6 (P = 0.652) | 0.0 (0.0‐71.8) |
| Qatar | 1 | 400 | 64.0 | 59.2‐68.6 | |||
| Saudi Arabia | 23 | 2653 | 9.4‐90.9 | 56.6 | 49.0‐64.0 | 225.9 (P < 0.001) | 90.3 (86.7‐92.9) |
| Syria | 3 | 674 | 39.3‐60.0 | 53.8 | 40.3‐67.1 | 4.1 (P = 0.127) | 51.5 (0.0‐86.0) |
| Tunisia | 22 | 1578 | 0.0‐19.4 | 1.7 | 0.0‐5.3 | 128 (P < 0.001) | 83.6 (76.3‐88.7) |
| UAE | 4 | 233 | 0.0‐46.3 | 21.3 | 5.4‐42.8 | 25.6 (P < 0.001) | 88.3 (72.5‐95.0) |
| MENA | 338 | 82 257 | 0.0‐100 | 17.3 | 14.1‐20.6 | 43318.8 (P < 0.001) | 99.2 (99.2‐99.3) |
| Genotype 5 | |||||||
| Afghanistan | 3 | 71 | 0.0‐0.0 | 0.0 | 0.0‐0.0 | 0.6 (P = 0.732) | 0.0(0.0‐66.6) |
| Algeria | 7 | 3806 | 0.0‐0.9 | 0.0 | 0.0‐0.0 | 6.3 (P = 0.389) | 5.0 (0.0‐72.3) |
| Bahrain | 2 | 107 | 0.0‐0.0 | 0.0 | 0.0‐3.5 | ||
| Egypt | 47 | 5031 | 0.0‐31.6 | 0.0 | 0.0‐0.0 | 45.2 (P = 0.507) | 0.0 (0.0‐32.6) |
| Iran | 66 | 23 134 | 0.0‐3.5 | 0.0 | 0.0‐0.0 | 89.7 (P = 0.023) | 27.5 (1.2‐46.8) |
| Iraq | 19 | 681 | 0.0‐0.0 | 0.0 | 0.0‐0.0 | 3.9 (P = 0.100) | 0.0 (0.0‐0.0) |
| Jordan | 4 | 71 | 0.0‐0.0 | 0.0 | 0.0‐1.1 | 0.4 (P = 0.933) | 0.0 (0.0‐0.0) |
| Kuwait | 1 | 108 | 0.0 | 0.0‐3.4 | |||
| Lebanon | 20 | 543 | 0.0‐3.0 | 0.0 | 0.0‐0.3 | 4.8 (P = 0.100) | 0.0 (0.0‐0.0) |
| Libya | 6 | 4236 | 0.0‐0.1 | 0.0 | 0.0‐0.1 | 1.0 (P = 0.959) | 0.0 (0.0‐0.0) |
| Morocco | 13 | 2636 | 0.0‐0.1 | 0.0 | 0.0‐0.0 | 3.7 (P = 0.988) | 0.0 (0.0‐0.0) |
| Oman | 1 | 33 | 0.0 | 0.0‐10.4 | |||
| Pakistan | 92 | 36 111 | 0.0‐4.1 | 0.0 | 0.0‐0.0 | 192.6 (P < 0.001) | 52.7 (40.0‐62.8) |
| Palestine | 4 | 152 | 0.0‐0.0 | 0.0 | 0.0‐0.0 | 1.2 (P < 0.751) | 0.0 (0.0‐62) |
| Qatar | 1 | 400 | 0.0 | 0.0‐1.0 | |||
| Saudi Arabia | 23 | 2652 | 0.0‐5.1 | 0.0 | 0.0‐0.0 | 31.1 (P < 0.094) | 29.3 (0.0‐57.6) |
| Syria | 3 | 674 | 0.0‐30.0 | 7.6 | 0.0‐23.0 | 9.1 (P < 0.010) | 78.1 (29.4‐93.2) |
| Tunisia | 22 | 1578 | 0.0‐0.0 | 0.0 | 0.0‐0.0 | 7.9 (P < 0.996) | 0.0 (0.0‐0.0) |
| UAE | 4 | 233 | 0.0‐0.0 | 0.0 | 0.0‐0.0 | 0.7 (P < 0.875) | 0.0 (0.0‐33.7) |
| MENA | 338 | 82 257 | 0.0‐31.6 | 0.0 | 0.0‐0.0 | 706.8 (P < 0.001) | 52.3 (45.9‐57.8) |
| Genotype 6 | |||||||
| Afghanistan | 3 | 71 | 0.0‐0.0 | 0.0 | 0.0‐0.0 | 0.6 (P = 0.732) | 0.0 (0.0‐66.6) |
| Algeria | 7 | 3806 | 0.0‐0.0 | 0.0 | 0.0‐0.0 | 2.4 (P = 0.882) | 0.0 (0.0‐26.2) |
| Bahrain | 2 | 107 | 0.0‐0.0 | 0.0 | 0.0‐3.5 | ||
| Egypt | 47 | 5031 | 0.0‐0.0 | 0.0 | 0.0‐0.0 | 20.3 (P = 0.100) | 0.0 (0.0‐0.0) |
| Iran | 66 | 23 134 | 0.0‐0.7 | 0.0 | 0.0‐0.0 | 38.8 (P = 0.100) | 0.0 (0.0‐0.0) |
| Iraq | 19 | 681 | 0.0‐0.0 | 0.0 | 0.0‐0.0 | 3.9 (P = 0.100) | 0.0 (0.0‐0.0) |
| Jordan | 4 | 71 | 0.0‐0.0 | 0.0 | 0.0‐1.1 | 0.4 (P = 0.933) | 0.0 (0.0‐0.0) |
| Kuwait | 1 | 108 | 0.0 | 0.0‐3.4 | |||
| Lebanon | 20 | 543 | 0.0‐0.0 | 0.0 | 0.0‐0.0 | 5.0 (P = 0.999) | 0.0 (0.0‐0.0) |
| Libya | 6 | 4236 | 0.0‐0.1 | 0.0 | 0.0‐0.1 | 0.3 (P = 0.100) | 0.0 (0.0‐0.0) |
| Morocco | 13 | 2636 | 0.0‐0.0 | 0.0 | 0.0‐0.0 | 6.5 (P = 0.888) | 0.0 (0.0‐20.1) |
| Oman | 1 | 33 | 0.0 | 0.0‐10.4 | |||
| Pakistan | 92 | 36 111 | 0.0‐3.4 | 0.0 | 0.0‐0.0 | 161 (P < 0.001) | 43.5 (27.5‐55.9) |
| Palestine | 4 | 152 | 0.0‐0.0 | 0.0 | 0.0‐0.0 | 1.2 (P < 0.751) | 0.0 (0.0‐62.0) |
| Qatar | 1 | 400 | 0.0 | 0.0‐1.0 | |||
| Saudi Arabia | 23 | 2652 | 0.0‐0.9 | 0.0 | 0.0‐0.0 | 8.2 (P < 0.997) | 0.0 (0.0‐0.0) |
| Syria | 3 | 674 | 0.0‐0.0 | 0.0 | 0.0‐0.0 | 1.3 (P < 0.524) | 0.0 (0.0‐83.9) |
| Tunisia | 22 | 1578 | 0.0‐0.0 | 0.0 | 0.0‐0.0 | 7.9 (P < 0.996) | 0.0 (0.0‐0.0) |
| UAE | 4 | 233 | 0.0‐0.0 | 0.0 | 0.0‐0.0 | 0.7 (P < 0.875) | 0.0 (0.0‐33.7) |
| MENA | 338 | 82 257 | 0.0‐3.4 | 0.0 | 0.0‐0.0 | 317.3 (P < 0.001) | 0.0 (0.0‐7.4) |
Djibouti, Mauritania, Somalia, Sudan, and Yemen excluded due to either no studies available or small sample size.
CI: Confidence interval.
Q: The Cochran Q statistic is a measure assessing the existence of heterogeneity in effect size (proportion of each genotype).
I2: A measure assessing the magnitude of between‐study variation that is due to differences in effect size (proportion of each genotype) across studies rather than chance.
The genotyped populations varied across these studies but often included clinical populations at high‐risk of exposure to HCV such as thalassemia, hemophilia, and hemodialysis patients (Supplementary Table S1). Other genotyped populations included chronic liver disease patients, people who inject drugs (PWID), blood donors, pregnant women, and healthcare workers, among others.
3.2. Meta‐analyses of the distribution of HCV genotypes
Table 1 lists the estimated pooled mean proportion for each HCV genotype by country. Figure 1 displays the distribution of genotypes by country. Figure 2 maps the dominant genotype by country.
Figure 1.
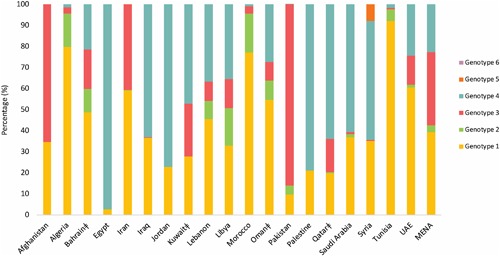
The country‐specific distribution of hepatitis C virus (HCV) genotypes across the Middle East and North Africa (MENA) region. Legend: ‡ Countries in which less than three studies were available. Djibouti, Mauritania, Somalia, Sudan, and Yemen were excluded either due to no studies available or small sample size
Figure 2.
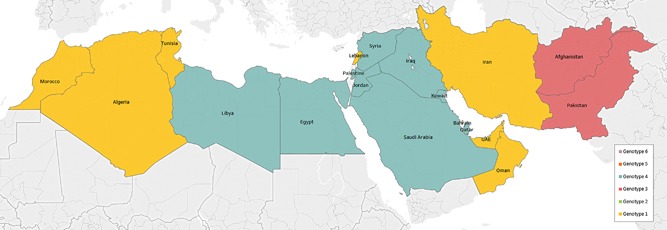
Map of the dominant hepatitis C virus (HCV) genotype across countries of the Middle East and North Africa (MENA) region. Legend: Djibouti, Mauritania, Somalia, Sudan, and Yemen were excluded either due to no studies available or small sample size
3.2.1. Genotype 1
Genotype 1 was dominant (≥50%) in Algeria, Iran, Lebanon, Morocco, Oman, Tunisia, and UAE, with the highest level observed in Tunisia at 85.9% (95%CI: 78.0‐92.5). Genotype 1 was common (10‐50%) in Afghanistan, Bahrain, Iraq, Jordan, Kuwait, Lebanon, Libya, Palestine, Qatar, Saudi Arabia, and Syria. Genotype 1 was limited (≤10%) in Pakistan and Egypt. For the whole MENA sample, the pooled mean proportion for genotype 1 was 30.2% (95%CI: 26.7‐33.7).
3.2.2. Genotype 2
Genotype 2 was not dominant in any MENA country, but was common in Algeria, Bahrain, Morocco, and Libya, with the highest level observed in Libya at 17.7% (95%CI: 15.3‐20.0). Genotype 2 was limited in remaining countries, with little to no cases observed in each of Afghanistan, Iraq, Jordan, Kuwait, Palestine, and Syria. For the whole MENA sample, the pooled mean proportion for Genotype 2 was 2.5% (95%CI: 1.6‐3.4).
3.2.3. Genotype 3
Genotype 3 was dominant in Afghanistan and Pakistan, with the highest level observed in Pakistan at 81.4% (95%CI: 77.9‐84.8). Genotype 3 was common in Bahrain, Iran, Kuwait, Libya, Qatar, and UAE. Genotype 3 was limited in Algeria, Iraq, Lebanon, Morocco, Oman, Saudi Arabia, Syria, and Tunisia. Little to no cases were observed in each of Egypt, Jordan, and Palestine. For the whole MENA sample, the pooled mean proportion for Genotype 3 was 26.7% (95%CI: 22.3‐31.4).
3.2.4. Genotype 4
Genotype 4 was dominant in Egypt, Iraq, Jordan, Kuwait, Libya, Qatar, Saudi Arabia, and Syria, with the highest level observed in Egypt at 93.1% (95%CI: 89.8‐95.9). Genotype 4 was common in Bahrain, Kuwait, Lebanon, Libya, Oman, and UAE. Genotype 4 was limited in Algeria, Iran, Morocco, Pakistan, and Tunisia. No cases were observed in Afghanistan. For the whole MENA sample, the pooled mean proportion for Genotype 4 was 17.5% (95%CI: 14.2‐21.0).
3.2.5. Genotypes 5, 6, and 7
Genotype 5 was neither dominant nor common in any MENA country. It was limited in Syria at 7.6% (95%CI: 0.0‐23.0), but otherwise was not observed, or was observed at extremely low levels, in the remaining MENA countries. For the whole MENA sample, the pooled mean proportion for Genotype 5 was 0.0% (95%CI: 0.0‐0.0).
Genotype 6 was not observed or was observed at extremely low levels in all countries, leading to a pooled mean proportion of 0.0% (95%CI: 0.0‐0.0) for the whole MENA sample. Genotype 7 was not observed in any country.
3.3. Genotype diversity
Supplementary Table S2 lists the estimated genotype diversity by country as assessed using Shannon Diversity Index (H). Figure 3 maps genotype diversity across MENA. Lebanon had the highest genotype diversity (H = 1.27 out of 1.95; 68.2%), followed by Bahrain (H = 1.24 out of 1.95; 63.7%) and UAE (H = 1.14 out of 1.95; 58.8%). Egypt had the lowest diversity (H = 0.27 out of 1.95; 14.4%), right behind Pakistan (0.61 out of 1.95; 33.1%) and Afghanistan (0.66 out of 1.95; 34.1%).
Figure 3.
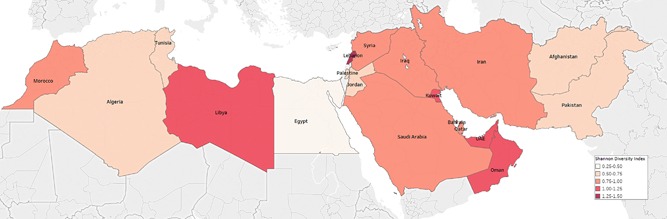
Map showing the genotype diversity across countries of the Middle East and North Africa (MENA) region, quantified by Shannon Diversity Index. Legend: Djibouti, Mauritania, Somalia, Sudan, and Yemen were excluded either due to no studies available or small sample size
3.4. Number of HCV chronically infected individuals by genotype
Table 2 lists the estimated number of HCV chronically infected individuals by genotype across MENA countries. Overall for the region, the largest number of chronically infected individuals was that for genotype 3 at 6.0 million, followed by genotype 4 at 5.9 million, genotype 1 at 2.0 million, and genotype 2 at 0.4 million. Genotype 5 contributed a mere 10 500 infections with virtually no contribution for genotype 6. The vast majority of genotype 3 chronically infected individuals were in Pakistan (5.7 out of 6.0 million), and the vast majority of genotype 4 infected individuals were in Egypt (5.0 out of 5.9 million).
Table 2.
Number of hepatitis C virus (HCV) chronically infected individuals by genotype across countries of the Middle East and North Africa (MENA)
| Number of HCV chronically infected individuals by genotype (95% confidence interval) | ||||||||
|---|---|---|---|---|---|---|---|---|
| Country | Total population35 | Estimated number of individuals chronically infected with HCV34 | Genotype 1 | Genotype 2 | Genotype 3 | Genotype 4 | Genotype 5 | Genotype 6 |
| Afghanistan | 32 527 000 | 178 875 | 61 891 (37 206‐88 543) | 0 (0‐0) | 116 984 (90 332‐141 669) | 0 (0‐0) | 0 (0‐0) | 0 (0‐0) |
| Algeria | 39 667 000 | 191 828 | 153 148 (137 833‐166 892) | 30 041 (18 849‐43 196) | 5890 (3 142‐9 621) | 2749 (1178‐4712) | 0 (0‐0) | 0 (0‐0) |
| Bahrain | 1 377 000 | 5033 | 2 446 (1 980‐2 917) | 564 (329‐935) | 941 (626‐1364) | 1082 (744–1520) | 0 (0‐175) | 0 (0‐175) |
| Egypt | 91 508 000 | 5 127 729 | 133 813 (69 583‐219 454) | 10 705 (0‐58 878) | 0 (0‐26 763) | 4 983 210 (4 806 577‐5 133 081) | 0 (0‐0) | 0 (0‐0) |
| Iran | 79 109 000 | 504 631 | 297 495 (279 529‐314 932) | 2114 (0‐5 284) | 205 023 (188 642‐221 404) | 0 (0‐528) | 0 (0‐0) | 0 (0‐0) |
| Iraq | 36 423 000 | 123 046 | 44 992 (29 303‐61 847) | 0 (0‐0) | 259 (0‐4279) | 77 795 (60 032‐94 780) | 0 (0‐1426) | 0 (0‐0) |
| Jordan | 7 595 000 | 38 264 | 8724 (0‐25 560) | 0 (0‐421) | 0 (0‐421) | 29 539 (12 703‐38 264) | 0 (0‐0) | 0 (0‐421) |
| Kuwait | 3 892 000 | 56 207 | 15 626 (11 359‐20 729) | 0 (0‐1928) | 14 052 (9 999‐19 071) | 26 530 (21 392‐31 796) | 0 (0‐1928) | 0 (0‐1928) |
| Lebanon | 5 851 000 | 15 405 | 6993 (7590‐11 910) | 1334 (275‐4195) | 1406 (574‐3820) | 5672 (5143‐10 836) | 0 (0‐75) | 0 (0‐0) |
| Libya | 6 278 000 | 52 916 | 17 444 (16 486‐18 454) | 9413 (8137‐10 636) | 7286 (4840‐10 158) | 18 773 (16 061‐21 592) | 0 (0‐53) | 0 (0‐53) |
| Morocco | 34 378 000 | 344 116 | 264 763 (204 867‐317 410) | 63 711 (16 405‐131 237) | 12 208 (1526‐30 139) | 3434 (0‐10 682) | 0 (0‐0) | 0 (0‐0) |
| Oman | 4 491 000 | 22 481 | 12 252 (8541‐15 773) | 2046 (706‐5299) | 2046 (706‐5299) | 6137 (3388‐9939) | 0 (0‐2345) | 0 (0‐2345) |
| Pakistan | 188 925 000 | 6 575 046 | 631 815 (513 784‐763 733) | 284 664 (180 519‐402 696) | 5 651 623 (5 408 618‐5 887 686) | 6943 (0‐41 658) | 0 (0‐0) | 0 (0‐0) |
| Palestine | 4 668 000 | 25 057 | 5254 (1954‐9336) | 0 (0‐475) | 0 (0–2033) | 19 803 (17 664‐21 730) | 0 (0‐0) | 0 (0‐0) |
| Qatar | 2 235 000 | 24 775 | 4901 (3995‐5923) | 124 (35‐446) | 3911 (3096‐4861) | 15 840 (14 647‐16 966) | 0 (0‐235) | 0 (0‐235) |
| Saudi Arabia | 31 540 000 | 496 894 | 183 403 (146 616‐221 790) | 7464 (2133‐14 928) | 4265 (0‐12 262) | 301 762 (261 242‐341 215) | 0 (0‐0) | 0 (0‐0) |
| Syria | 18 502 000 | 131 860 | 46 400 (16 760‐81 582) | 0 (0‐277) | 416 (0‐1662) | 74 518 (55 819‐92 939) | 10 527 (0‐31 857) | 0 (0‐0) |
| Tunisia | 11 254 000 | 93 360 | 85 863 (77 966‐92 460) | 5098 (1499‐9896) | 700 (0‐3399) | 1699 (0‐5298) | 0 (0‐0) | 0 (0‐0) |
| UAE | 9 157 000 | 119 817 | 72 415 (42 565‐101 851) | 1658 (0‐8983) | 16 307 (138‐45 743) | 29 436 (29 436‐59 148) | 0 (0‐0) | 0 (0‐0) |
| MENA | 609 377 000 | 14 127 340 | 2 049 638 (1 607 916‐2 541 096) | 418 935 (228 885‐699 708) | 6 043 317 (5 712 239‐6 431 653) | 5 604 923 (5 306 028‐5 936 686) | 10 527 (0‐38 094) | 0 (0‐5157) |
| Genotype distribution in MENA weighted by population size (%) | 14.5 (11.4‐18.0) | 3.0 (1.6‐5.0) | 42.8 (40.4‐45.5) | 39.7 (37.6‐42.0) | 0.1 (0.0‐0.3) | 0.0 (0.0‐0.0) | ||
Djibouti, Mauritania, Somalia, Sudan, and Yemen were excluded either due to no studies available or small sample size.
Weighted by population size in each country, the highest proportion of chronically infected individuals was that of genotype 3 (41.9%), followed by genotype 4 (41.0%), genotype 1 (14.2%), genotype 2 (2.9%), genotype 5 (0.1%), and genotype 6 (0.0%).
4. DISCUSSION
We presented a comprehensive characterization of HCV genotype distribution, diversity, and patterns in MENA. We found that the distribution varied from one country to another, with evidence for sub‐regionalization patterns for specific genotypes. Most chronically infected individuals were infected with genotypes 3 or 4, with nearly equal contributions for each at just over 40%. However, these large contributions merely reflected the dominance of these genotypes in Pakistan (genotype 3) and Egypt (genotype 4), by far the largest two HCV epidemics in MENA. Over 75% of MENA's chronically infected individuals are found in these two countries.33
While genotype 1 was present throughout the region, and was dominant or common in most countries, it had limited presence in both Egypt and Pakistan, and hence its contribution did not exceed 15%. Genotypes 2, 5, 6, and 7 did not have significant presence in MENA. While there was considerable genotype diversity in most countries, there was limited diversity in both Egypt and Pakistan. These findings inform the current expansion of DAA treatment programs in MENA, and provide insights about the transmission pathways of this infection.
The distribution of HCV genotypes in MENA appears to reflect three sub‐regional patterns (Figure 2). The first is that of dominance of genotype 3, a pattern found in Pakistan and Afghanistan, and to some extent in Iran (Figures 1 and 2). This pattern is possibly explained by the fact that these are neighboring countries with mass cross‐border population movements and porous borders.35, 36
The second pattern is that of dominance, or large presence, of genotype 4 which is found in Egypt, its neighboring countries, and/or in countries that host or have hosted large migrant labor populations from Egypt15, 18, 37 (Figures 1 and 2). This pattern is possibly explained by the unique nature of the Egyptian epidemic,12, 38 which has led to circulation of genotype 4 through population movement to countries with strong links to Egypt. Countries that have imported large Egyptian labor populations included Iraq, Jordan, Kuwait, Libya, Oman, Qatar, Saudi Arabia, and UAE.39 It bears notice, nonetheless, that the circulation of this genotype out of Egypt does not seem to have impacted significantly HCV prevalence in these countries. HCV prevalence in these countries is much lower than that in Egypt.12, 13, 15, 18, 38
The third pattern is that of dominance, or large presence, of genotype 1 which is found in the Maghreb sub‐region of MENA (Algeria, Morocco, Tunisia, and to some extent Libya), part of the Arabian Gulf sub‐region (Oman and UAE), Iran, and to some extent Lebanon (Figure 2). This pattern is similar to the most common global pattern,7, 9 and may reflect population movement links with countries outside MENA, such as the Maghreb sub‐region migration links with Western and Southern Europe.40, 41 There are also large and diverse expatriate populations in the Arabian Gulf sub‐region, and this may have contributed to this pattern.18
While these three patterns are largely distinct, some overlap is seen such as for countries that border different patterns—Iran and Libya provide two examples (Figures 1 and 2). The Arabian Gulf sub‐region also exhibits such overlap with its diverse migrant‐population composition—as reflected in the high genotype diversity for the majority of Arabian Gulf countries (Figure 3, Supplementary Table S2). Lastly, genotype 2 was mainly present in the Maghreb sub‐region, possibly because of geographic proximity and population links with West Africa where this genotype is most frequent.7, 42, 43
Genotype diversity varied across the region. The variability in genotype diversity is probably attributable to factors including, among others, specific historical events, such as the case for Egypt,12, 38, 44 how HCV was introduced to each country, such as through migrant population movements,40, 41 and importation of blood products (mostly from Western countries) before the onset of HCV blood screening,24, 45 Genotype diversity appears also to be influenced by the type of drivers of HCV transmission in each country, such as the role of PWID and association with genotype 3.46, 47
PWID may play a larger relative role in HCV transmission in the future, as exposures in the wider population are further controlled. Injecting drug use is a major challenge in MENA,48, 49 but we found a small number of genotype studies among PWID. Available data suggests that the genotypes circulating among PWID in a given country, tend to be similar to those circulating in the wider population in this country (Supplementary Table S1). We are thus unable to see whether there are associations between specific genotypes and injecting drug use, such as the genotype 3 link seen in the global literature.7, 50, 51 As suggested by recent studies, however, there seems to be a shift toward genotype 3 in Iran.46, 47 This is particularly among young patients, and is apparently linked to injecting drug use increasingly becoming the main route of HCV transmission.46, 47
Our study has several limitations. We did not find HCV genotype studies for four MENA countries, and there were too few studies to conduct meta‐analyses for another five countries. The number of studies also varied by country, and sample size of genotyped individuals was small for a number of studies. Studies may have also sampled populations from specific geographic areas within a given country, or select sub‐populations. We did not assess secular trends in genotype distribution, such as using meta‐regressions, as such analyses are challenged by the heterogeneity in available data and by the fact that genotype diversity is very low in the two countries that contribute most chronic infections in this region (namely, Egypt and Pakistan; Table 2). Accordingly, available genotype data may not have captured the diversity and true distribution of genotypes in the wider population of each country.
Key strengths of our study are the systematic and comprehensive searches that yielded our input data, and the fact that we synthesized and analyzed these data using state of the art quantitative methods. In addition to international databases, we identified a volume of data through regional and national databases, and included non‐English articles, public health reports, and routine data reporting. We have therefore identified much more data than is present in existing global or regional studies of HCV genotypes,7, 9, 52 and presented a detailed picture of HCV genotypes and their patterns and diversity in MENA.
In conclusion, genotypes 3 and 4 are the most common genotypes in MENA, with equal contributions, in large part because of the sizable HCV epidemics in Pakistan and Egypt. While genotype 1 was ubiquitous, and was dominant or common in most countries, its overall contribution was still small compared to those of genotypes 3 and 4. Three sub‐regional genotype patterns were identified, and these appeared to reflect cross‐border population movements and geographic proximity. Two patterns were centered in each of Pakistan (genotype 3 pattern) and Egypt (genotype 4 pattern), while the third (genotype 1 pattern) was similar with the most common global pattern. While genotype diversity was limited in Egypt and Pakistan, it was considerable in the other countries. Genotypes 2, 5, 6, and 7 did not have significant presence. These findings inform the DAA treatment programs that are being expanded in MENA, and provide insights into HCV transmission pathways.
Supporting information
Additional Supporting Information may be found online in the supporting information tab for this article.
Supporting Data S1.
ACKNOWLEDGMENTS
This work was supported by National Priorities Research Program (NPRP) [grant number 9‐040‐3‐008] from the Qatar National Research Fund (a member of Qatar Foundation). The findings achieved herein are solely the responsibility of the authors. The authors are also grateful for infrastructure support provided by the Biostatistics, Epidemiology, and Biomathematics Research Core at Weill Cornell Medicine‐Qatar.
AUTHORS’ CONTRIBUTIONS
SM conducted extraction, analysis and wrote the first draft of the paper. LJA‐R conceived and led the design of the study, analyses and drafting of the article. All authors contributed to the extraction of data, discussion of results, and writing of the manuscript.
CONFLICTS OF INTEREST
The authors have no conflicts of interest to disclose.
Mahmud S, Al‐Kanaani Z, Chemaitelly H, Chaabna K, Kouyoumjian SP, Abu‐Raddad LJ. Hepatitis C virus genotypes in the Middle East and North Africa: Distribution, diversity, and patterns. J Med Virol. 2018;90: 131–141. https://doi.org/10.1002/jmv.24921
REFERENCES
- 1. Martinot‐Peignoux M, Roudot‐Thoraval F, Mendel I, et al. Hepatitis C virus genotypes in France: relationship with epidemiology, pathogenicity and response to interferon therapy. J Viral Hepat. 1999; 6:435–443. [DOI] [PubMed] [Google Scholar]
- 2. Rosen HR, Martin P. Viral hepatitis in the liver transplant recipient. Infect Dis Clin. 14:761–784. [DOI] [PubMed] [Google Scholar]
- 3. Lauer GM, Walker BD. Hepatitis C virus infection. N Engl J Med. 2001; 345:41–52. [DOI] [PubMed] [Google Scholar]
- 4. Bouvard V, Baan R, Straif K, et al. A review of human carcinogens—Part B: biological agents. Elsevier. 2009; 10:321–322. [DOI] [PubMed] [Google Scholar]
- 5.WHO. Global Hepatitis Report, 2017. Online: https://www.who.int/hepatitis/publications/global‐hepatitis‐report2017/en/. 2017.
- 6.WHO. The epidemiology of hepatitis C virus in the World Health Organization Eastern Mediterranean Region: Implications for strategic action. Eastern Mediterranean Hepatitis C Virus Epidemiology Synthesis Project. (in press). 2017.
- 7. Messina JP, Humphreys I, Flaxman A, et al. Global distribution and prevalence of hepatitis C virus genotypes. Hepatology. 2015; 61:77–87. [DOI] [PMC free article] [PubMed] [Google Scholar]
- 8. Collaborators TPOH. Global prevalence and genotype distribution of hepatitis C virus infection in 2015: a modelling study. Lancet Gastroenterol Hepatol. 2016; 2:161–176. [DOI] [PubMed] [Google Scholar]
- 9. Gower E, Estes C, Blach S, Razavi‐Shearer K, Razavi H. Global epidemiology and genotype distribution of the hepatitis C virus infection. J Hepatol. 2014; 61:S45–S57. [DOI] [PubMed] [Google Scholar]
- 10. Zein NN. Clinical significance of hepatitis C virus genotypes. Clin Microbiol Rev. 2000; 13:223–235. [DOI] [PMC free article] [PubMed] [Google Scholar]
- 11.EASL. EASL recommendations on treatment of hepatitis C 2016. Online: https://www.easl.eu/research/our‐contributions/clinical‐practice‐guidelines/detail/easl‐recommendations‐on‐treatment‐of‐hepatitis‐c‐2016. 2016.
- 12. Mohamoud YA, Mumtaz GR, Riome S, Miller D, Abu‐Raddad LJ. The epidemiology of hepatitis C virus in Egypt: a systematic review and data synthesis. BMC Infect Dis. 2013; 13:1. [DOI] [PMC free article] [PubMed] [Google Scholar]
- 13. Chemaitelly H, Chaabna K, Abu‐Raddad LJ. The epidemiology of hepatitis C virus in the Fertile Crescent: systematic review and meta‐analysis. PLoS ONE. 2015; 10:0135281. [DOI] [PMC free article] [PubMed] [Google Scholar]
- 14. Chemaitelly H, Mahmud S, Rahmani AM, Abu‐Raddad LJ. The epidemiology of hepatitis C virus in Afghanistan: systematic review and meta‐analysis. Int J Infect Dis. 2015; 40:54–63. [DOI] [PubMed] [Google Scholar]
- 15. Fadlalla FA, Mohamoud YA, Mumtaz GR, Abu‐Raddad LJ. The epidemiology of hepatitis C virus in the maghreb region: systematic review and meta‐analyses. PLoS ONE. 2015; 10:e0121873. [DOI] [PMC free article] [PubMed] [Google Scholar]
- 16. Chaabna K, Kouyoumjian SP, Abu‐Raddad LJ. Hepatitis C virus epidemiology in Djibouti, Somalia, Sudan, and Yemen: systematic review and meta‐analysis. PLoS ONE. 2016; 11:e0149966. [DOI] [PMC free article] [PubMed] [Google Scholar]
- 17. Al‐Kanaani Z, Kouyoumjian SP, Abu‐Raddad LJ. The epidemiology of hepatitis C virus in Pakistan: systematic review and meta‐analyses (under preparation) [DOI] [PMC free article] [PubMed]
- 18. Mohamoud YA, Riome S, Abu‐Raddad LJ. Epidemiology of hepatitis C virus in the Arabian Gulf countries: systematic review and meta‐analysis of prevalence. Int J Infect. Dis. 2016; 46:116–125. [DOI] [PubMed] [Google Scholar]
- 19. Mahmud S, Akbarzadeh V, Abu‐Raddad LJ. The epidemiology of hepatitis C virus in Iran: systematic review and meta‐analyses (under review) [DOI] [PMC free article] [PubMed]
- 20. Chaabna K, Mohamoud YA, Chemaitelly H, Mumtaz GR, Abu‐Raddad LJ. Protocol for a systematic review and meta‐analysis of hepatitis C virus (HCV) prevalence and incidence in the Horn of Africa sub‐region of the Middle East and North Africa. Syst Rev. 2014; 3:1. [DOI] [PMC free article] [PubMed] [Google Scholar]
- 21. Higgins JP, Green S. 2008. Cochrane handbook for systematic reviews of interventions. Wiley Online Library, https://handbook‐5‐1.cochrane.org/ [Google Scholar]
- 22. Moher D, Liberati A, Tetzlaff J, Altman DG. Preferred reporting items for systematic reviews and meta‐analyses: the PRISMA statement. Ann Intern Med. 2009; 151:264–269. [DOI] [PubMed] [Google Scholar]
- 23. Abu‐Raddad LJ, Hilmi N, Mumtaz G, et al. Epidemiology of HIV infection in the middle east and north africa. AIDS. 2010; 24:S5–S23. [DOI] [PubMed] [Google Scholar]
- 24. Abu‐Raddad L AF, Semini I, Reidner G, Wilson D, Tavil O. 2010. Characterizing the HIV/AIDS epidemic in the Middle East and North Africa: time for strategic action. Washington DC: The World Bank Press. [Google Scholar]
- 25. Choo Q‐L, Kuo G, Weiner AJ, Overby LR, Bradley DW, Houghton M. Isolation of a cDNA clone derived from a blood‐borne non‐A, non‐B viral hepatitis genome. Science. 1989; 244:359–362. [DOI] [PubMed] [Google Scholar]
- 26. Kuo G, Choo Q, Alter H, et al. An assay for circulating antibodies to a major etiologic virus of human non‐A, non‐B hepatitis. Science. 1989; 244:362–364. [DOI] [PubMed] [Google Scholar]
- 27. Borenstein M, Hedges LV, Higgins JPT, Rothstein HR. 2011. Introduction to meta‐analysis. Chichester, U.K: John Wiley & Sons. [Google Scholar]
- 28. Freeman MF, Tukey JW. Transformations related to the angular and the square root. Ann Math Stat. 1950:607–611. [Google Scholar]
- 29. Higgin J, Thompson S, Deeks J, Altman D. Measuring inconsistency in meta‐analysis. Br Med J. 2003; 327:557–560. [DOI] [PMC free article] [PubMed] [Google Scholar]
- 30.Team RC. R: A language and environment for statistical computing. R Foundation for Statistical Computing, Vienna, Austria. Version 3.1. 2. 2014. Online: https://wwwR‐projectorg.
- 31.Tableau 10.1 ed. Seattle, Washington 2017. p. Online: https://www.tableau.com/.
- 32. Shannon CE. A mathematical theory of communication. ACM SIGMOBILE Mobile Computing and Communications Review. 2001; 5(1):3–55. [Google Scholar]
- 33. Chemaitelly H, Mahmud S, Kouyoumjian SP, Al‐Kanaani Z, Chaabna K, Abu‐Raddad LJ. Estimation of Hepatitis C Virus Chronic Infections in Middle East and North Africa (under preperation). 2017.
- 34.Department of Economic and Social Affairs UN. World Population Prospects, the 2015 Revision. Online:https://esa.un.org/unpd/wpp/.
- 35. Rajabali A, Moin O, Ansari AS, Khanani MR, Ali SH. Communicable disease among displaced Afghans: refuge without shelter. Nat Rev Micro. 2009; 7:609–614. [DOI] [PubMed] [Google Scholar]
- 36. Kronenfeld DA. Afghan refugees in Pakistan: not all refugees, not always in Pakistan, not necessarily Afghan? J Refug Stud. 2008; 21:43–63. [Google Scholar]
- 37. Choucri N. The new migration in the Middle East: a problem for whom? Int Migr Rev. 1977;421–443. [PubMed] [Google Scholar]
- 38. Kouyoumjian SP, Chemaitelly H, Abu‐Raddad LJ. Understanding the hepatitis C virus epidemic in Egypt: systematic reviews, meta‐analyses. and meta‐regression analyses (under review). [DOI] [PMC free article] [PubMed]
- 39. Feiler G. Migration and recession: arab labor mobility in the Middle East, 1982–89. Popul Dev Rev. 1991:134–155. [Google Scholar]
- 40. Bommes M, Fassman H, Sievers W. Migration from the middle east and north africa to europe: past developments, current status and future potentials. Amsterdam: Amsterdam University Press; 2014.
- 41.International Organization for Migration. Global Migration Flows, 2015 (Available at: https://www.iom.int/world‐migration,Accessed:May,2017).
- 42. Ruggieri A, Argentini C, Kouruma F, et al. Heterogeneity of hepatitis C virus genotype 2 variants in west central africa (Guinea conakry). J Gen Virol. 1996; 77:2073–2076. [DOI] [PubMed] [Google Scholar]
- 43. Jeannel D, Fretz C, Traore Y, et al. Evidence for high genetic diversity and long‐term endemicity of hepatitis C virus genotypes 1 and 2 in West Africa. J Med Virol. 1998; 55:92–97. [PubMed] [Google Scholar]
- 44. Frank C, Mohamed MK, Strickland GT, et al. The role of parenteral antischistosomal therapy in the spread of hepatitis C virus in Egypt. Lancet 2000; 355:887–891. [DOI] [PubMed] [Google Scholar]
- 45. Mohamoud YA, Miller FD, Abu‐Raddad LJ. Potential for human immunodeficiency virus parenteral transmission in the Middle East and North Africa: an analysis using hepatitis C virus as a proxy biomarker. World J Gastroenterol. 2014; 20:12734. [DOI] [PMC free article] [PubMed] [Google Scholar]
- 46. Taherkhani R, Farshadpour F. Epidemiology of hepatitis C virus in Iran. World J Gastroenterol. 2015; 21:10790–10810. [DOI] [PMC free article] [PubMed] [Google Scholar]
- 47. Jahanbakhsh Sefidi F, Keyvani H, Monavari SH, Alavian SM, Fakhim S, Bokharaei‐Salim F. Distribution of hepatitis C virus genotypes in iranian chronic infected patients. Hepatitis Monthly. 2013; 13:e7991. [DOI] [PMC free article] [PubMed] [Google Scholar]
- 48.United Nations Office on Drugs and Crime. World Drug Report, 2016 (Available at: https://www.unodc.org/wdr2016/, Accessed: May 2017).
- 49. Mumtaz GR AS, Faizzadeh A, Weiss HA, Abu‐Raddad LJ HIV incidence among people who inject drugs in the Middle East and North Africa: mathematical modeling analysis (under review). [DOI] [PMC free article] [PubMed]
- 50. Pawlotsky J‐M, Tsakiris L, Roudot‐Thoraval F, et al. Relationship between hepatitis C virus genotypes and sources of infection in patients with chronic hepatitis C. J Infect Dis. 1995; 171:1607–1610. [DOI] [PubMed] [Google Scholar]
- 51. Ramia S, Eid‐Fares J. Distribution of hepatitis C virus genotypes in the Middle East. Int J Infect Dis. 2006; 10:272–277. [DOI] [PubMed] [Google Scholar]
- 52. Sadeghi F, Salehi‐Vaziri M, Almasi‐Hashiani A, Gholami‐Fesharaki M, Pakzad R, Alavian SM. Prevalence of hepatitis C virus genotypes among patients in countries of the eastern mediterranean regional office of WHO (EMRO): a systematic review and meta‐analysis. Hepatitis monthly 2016; 16:35558. [DOI] [PMC free article] [PubMed] [Google Scholar]
Associated Data
This section collects any data citations, data availability statements, or supplementary materials included in this article.
Supplementary Materials
Additional Supporting Information may be found online in the supporting information tab for this article.
Supporting Data S1.