Abstract
The objective of this study was to characterize magnetic resonance imaging (MRI) findings and correlate with clinical results in patients who underwent autologous chondrocyte implantation (ACI) of osteochondral lesions of the talus (OLT). Methods. Twenty-four grafts were evaluated at a mean 65.8 months after ACI for OLT. MRI was performed on a 1.5-T GE scanner using multiple sequences. Graft appearance was compared with preoperative MRI and evaluated for 6 criteria: defect fill, surface regularity, signal pattern, bone marrow edema, subchondral plate irregularity, and presence of cystic lesions. Clinical outcome was measured with the American Orthopaedic Foot and Ankle Society (AOFAS) clinical outcome score. Results. Of 24 grafts, 22 (92%) demonstrated >75% defect fill. Eighteen (75%) had a mildly irregular and 6 (25%) had a moderately irregular articular surface. The signal pattern of the repair tissue was heterogenous in 23 (96%); 14 (58%) layered and 9 (38%) mottled. Fourteen grafts (58%) showed decreased amount of bone marrow edema while 4 (17%) had no change and 5 (21%) had an increase in the amount of bone marrow edema. The subchondral bone plate was abnormal in most grafts, with focal defects seen in 10, slight depression in 7, and both in 5. Seven had an increase in cystic lesions while the others had no change, decrease or no cysts seen. Mean postoperative AOFAS score was 87.5 with mean improvement of 39.4. Conclusions. At 66-month mean follow-up, MRI appearance of the ACI grafts show imaging abnormalities but demonstrate good clinical results. While MRI is an important tool in the postoperative assessment of ACI grafts, the various variations from a normal/nonoperative ankle must be interpreted with caution.
Keywords: autologous chondrocyte, grafts, ankle, joint involved, magnetic resonance imaging, diagnostics
Introduction
Osteochondral lesions of the talus (OLTs) can present a problematic injury for the clinician as it can lead to chronic ankle pain and disability. Autologous chondrocyte implantation (ACI) is a technique that was initially shown to successfully treat focal cartilage defects in the knee and has been subsequently utilized in other parts of the body, including the ankle.1-7
ACI can be performed through initial harvesting and in vitro culture of chondrocytes followed by reimplantation of the chondrocytes under a periosteal patch sutured over the defect.1 A variation of the technique referred to as the “sandwich procedure” has been described for lesions with deep cystic defects, which involves bone grafting of the defect followed by a periosteal patch. Then, a second periosteal patch is applied with the cultured chondrocytes injected in between the 2 periosteal layers.5,7,8
Magnetic resonance imaging (MRI) is commonly performed both in the preoperative setting for surgical planning prior to the ACI surgery and in the postoperative setting for radiologic evaluation and follow-up of the ACI graft.9-14 MRI observations of cartilage repair tissue (MOCART) has been described and characterized.15,16 The original published MOCART classification system analyzed the degree of filling of the defect, the integration to the border zone, the description of the surface and structure, the signal intensity, the status of the subchondral lamina and subchondral bone, the appearance of adhesions and the presence of synovitis.15 In our study, we examine cartilage repair tissue with a similar, but slightly modified, criteria.
Most literature on MRI follow-up of ACI has been performed in the knee.9,13,17,18 Several groups have demonstrated that postoperative MRI did correlate with clinical outcome scores in the knee after ACI surgery.16,17 One recent study on long-term results of ACI in the ankle evaluated 10 patients with clinical results and MRI, focusing on T2 mapping of the talar articular cartilage after autologous chondrocyte implantation.19 Another study with long-term follow-up on 12 patients who underwent ankle ACI reported finding nearly congruent articular surfaces on MRI in the majority of cases.20
To our knowledge, however, this current study is the first that systematically describes MRI findings of ACI procedures performed in the ankle in a large series of patients.
Materials and Methods
Study Population
This study was performed with the appropriate institutional review board approval from our hospital and surgery center. Twenty-four consecutive patients (14 males and 10 females) with a mean age of 34.1 years (range 16-54 years) were included in this study. We excluded 7 patients who were not able to obtain follow up MRI studies. Indications for ACI surgery of the ankle included (1) patients aged 15 to 55 years; (2) focal, contained, unipolar lesions between 1 to 2 cm2 in size; (3) pain unresponsive to conservative treatment; (4) persistent pain after previous drilling and/or microfracture; and (5) magnetic resonance imaging evidence of a cartilage defect and subchondral irregularity. Fifteen patients underwent an ACI alone while 9 patients had a sandwich procedure performed. An MRI of the ankle joint was performed at mean follow-up time of 65.8 months (range 22-113 months) postoperatively. All patients had a preoperative MRI for comparison.
MRI Technique
MRI was performed with a 1.5-T system (GE LX, United States) utilizing a dedicated phased array coil. The following sequences were obtained postoperatively: sagittal T1 (flip angle [FA] 90°, repetition time [TR] 450 ms, echo time [TE] 13 ms, field of view [FOV] 160 mm, 512 × 512 matrix), sagittal short tau inversion recovery (STIR; FA 90°, TR 4950 ms, TE 43 ms, FOV 160 mm, 512 × 512 matrix), axial multiecho fast spin proton density (FA 90°, TR 3000 ms, TE 30 ms, FOV 150 mm, 512 × 512 matrix), axial multiecho fast spin T2 (FA 90°, TR 4133 ms, TE 85 ms, FOV 150 mm, 512 × 512 matrix), oblique coronal-axial proton density with fat saturation (FA 90°, TR 3767 ms, TE 30 ms, FOV 150 mm, 512 × 512 matrix), and oblique coronal proton-density with fat saturation (FA 90°, TR 2000 ms, TE 19 ms, FOV 120 mm, 512 × 512 matrix). Preoperative MRI was imaged similarly if they were performed at our institution.
MRI Evaluation
The MR images were evaluated pre- and postoperatively by an experienced musculoskeletal radiologist (G.R.A.). A standard PACS (picture archiving and communication system) viewing station was used and the radiologist was blinded to the clinical results.
Graft Assessment
The graft appearance was compared with preoperative MRI and was evaluated for 6 criteria: defect fill, surface regularity, signal pattern, bone marrow edema, subchondral plate irregularity, and presence of cystic lesions.
Defect fill was graded into 3 categories by evaluating the quantity of repair tissue fill. Poor fill was defined as defects with less than 50% repair tissue, moderate as 50% to 75% fill, and good as greater than 75% fill. Surface regularity was described as severe, moderate, mild, or smooth. Severely irregular was defined as complete articular disruption, moderately irregular had less than 50% articular disruption, mildly irregular had less than 25% articular disruption and smooth was free of articular disruption.
The signal pattern of the repair tissue was further graded for signal intensity based on T2-weighted imaging. The signal pattern could be homogenous or heterogenous which were further subdivided into layered or mottled appearance. Bone marrow edema was compared with preoperative MR images to determine whether edema was increased, decreased or unchanged. The subchondral plate was examined for the presence or absence of focal defects and the level was assessed relative to the adjacent subchondral plate. Cystic lesions were examined by using preoperative MR images for comparison and then graded for the presence of cysts as well as any increase or decrease in cystic lesions.
Clinical Evaluation
Clinical outcomes for the patients were assessed by questionnaire to determine the American Orthopaedic Foot and Ankle Society (AOFAS) hindfoot score (maximum score 100). The AOFAS scoring system has been partially validated and comprises both subjective and objective variables that have been shown to reliably correlate with foot and ankle quality of life issues.21,22 All 24 patients underwent both preoperative and postoperative AOFAS score assessment. There were no concomitant foot and ankle pathologies effecting the radiologic and functional outcomes.
Statistical Analysis
An independent-samples t test was performed to determine if there were statistically significant differences between the preoperative and postoperative AOFAS score and the AOFAS scores between the ACI and the sandwich procedure groups. Statistical significance was achieved at P < 0.05.
Result
Graft Appearance
All the grafts were evaluated on MRI and the findings are summarized below and in Table 1 . Of the 24 grafts evaluated, all were found to have either moderate or good fill of the defect ( Fig. 1 ). Twenty-two grafts (92%) had more than 75% of the defect filled while 2 grafts (8%) had between 50% and 75% fill. No grafts exhibited poor defect fill of less than 50%.
Table 1.
Magnetic Resonance Imaging Results of Autologous Chondrocyte Implantation Grafts.
| Defect Fill | Poor: 0 | Moderate: 2 | Good: 22 | |
|---|---|---|---|---|
| Surface regularity | Severely irregular: 0 | Moderately irregular: 6 | Mildly irregular: 18 | Smooth: 0 |
| Signal pattern | Layered: 14 | Mottled: 9 | Homogenous: 1 | |
| Marrow edema | Increased: 5 | Same: 4 | Decreased: 15 | |
| Subchondral plate | Focal defects + Slight depression: 5 | Focal defects: 10 | Slight depression: 7 | No defects: 2 |
| Cystic lesion | Increase: 7 | No change: 2 | Decrease: 7 | None: 8 |
Figure 1.
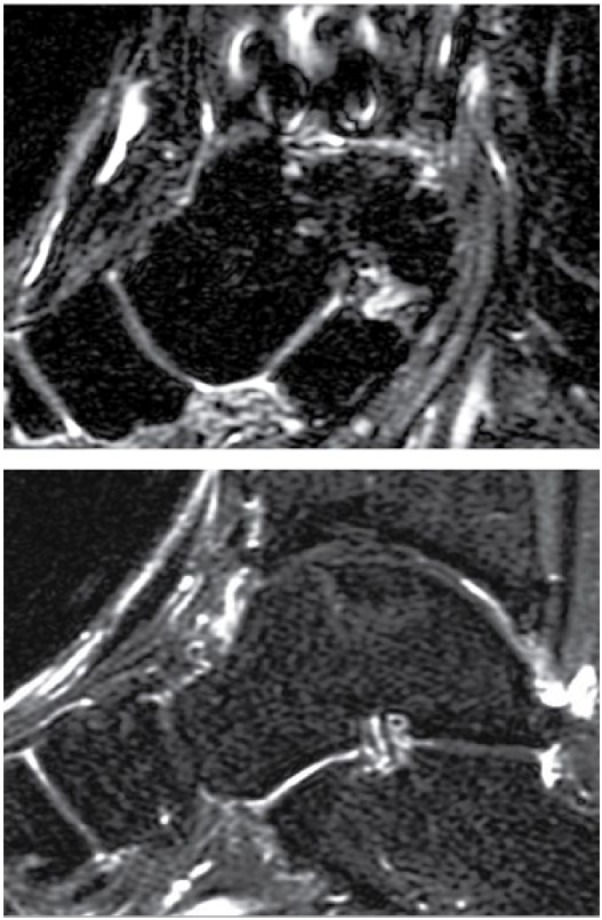
Defect fill: (A) A 41-year-old man with a talar osteochondral defect (OCD) lesion 9.4 years after autologous chondrocyte implantation (ACI) surgery demonstrating moderate defect fill of the talar OCD lesion with the ACI graft. (B) A 22-year-old man with a talar OCD lesion 3.8 years after ACI sandwich surgery demonstrating good defect fill of the talar OCD lesion with the ACI graft.
The surface regularity of the grafts were all found to be either moderately or mildly irregular ( Fig. 2 ). Six of the grafts (25%) showed signs of moderate irregularity with less than 50% but more than 25% articular disruption whereas most grafts (18; 75%) were only mildly irregular with less than 25% articular disruption. No grafts were characterized as severely irregular or smooth.
Figure 2.
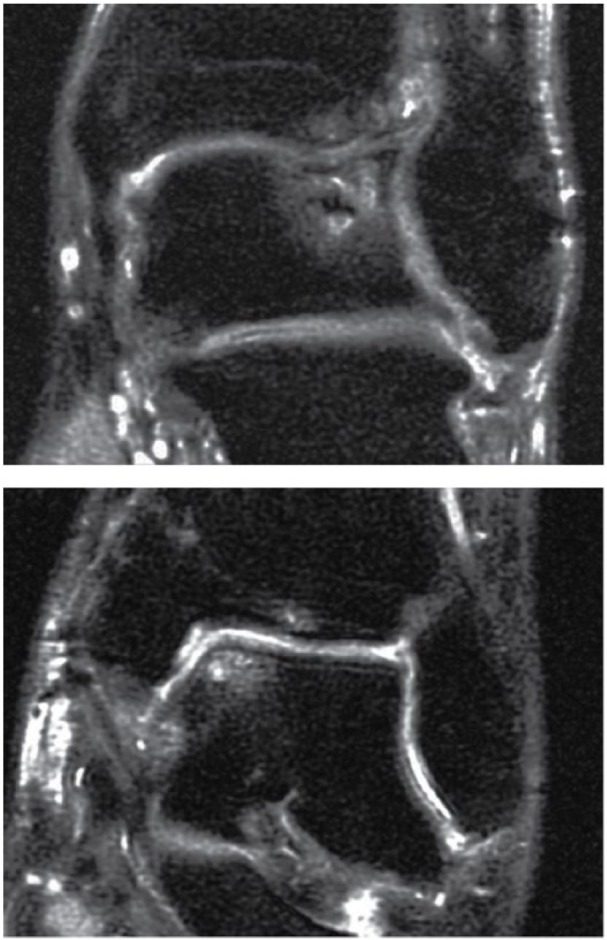
Surface regularity: (A) A 31-year-old man with a talar osteochondral defect (OCD) lesion 8.7 years after autologous chondrocyte implantation (ACI) surgery demonstrating moderate irregularity of surface appearance of the ACI graft (~50% articular surface disruption). (B) A 36-year-old woman with a talar OCD lesion 3.4 years after ACI surgery demonstrating mild irregularity of surface appearance of the ACI graft (~25% articular surface disruption).
Nearly all the grafts showed some abnormal signal intensity when evaluating the T2-weighted images ( Fig. 3 ). Twenty-three grafts (96%) exhibited heterogeneous signal pattern in the repair tissue that filled the osteochondral lesion while only 1 graft (4%) had a homogenous signal pattern. Fourteen of the heterogenous grafts (58%) were characterized as layered and 9 (38%) were described as mottled.
Figure 3.
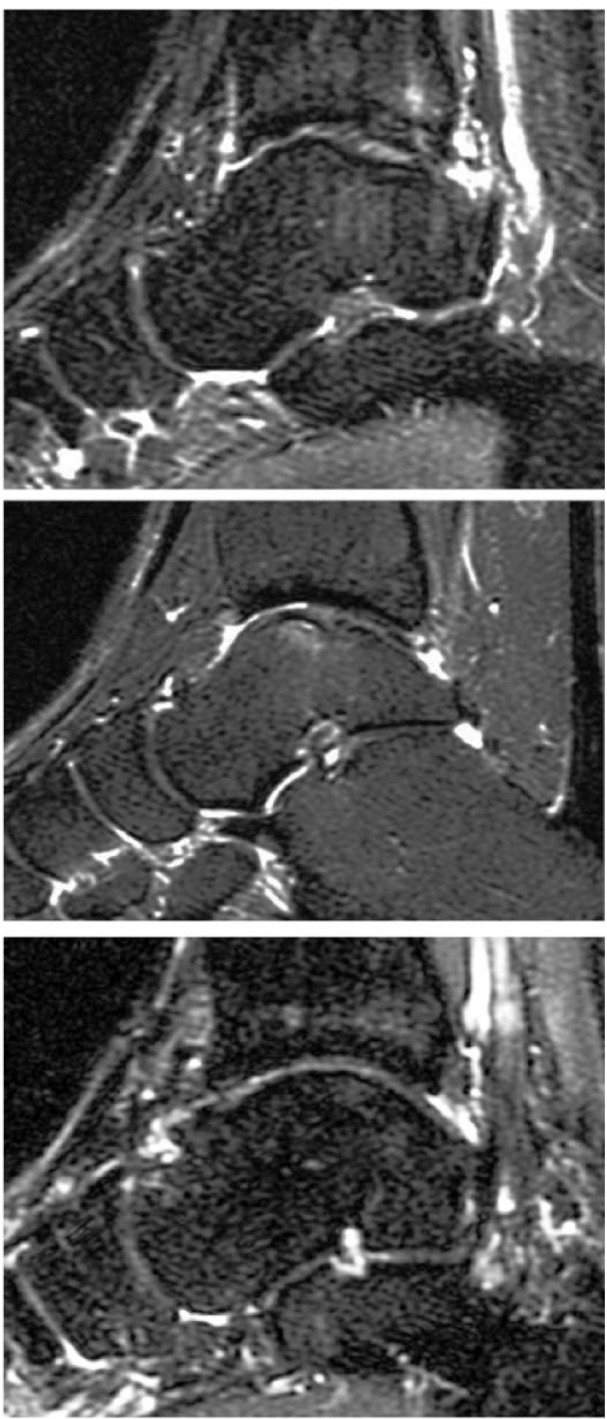
Signal pattern: (A) A 24-year-old woman with a talar osteochondral defect (OCD) lesion 5 years after autologous chondrocyte implantation (ACI) surgery demonstrating a layered-type heterogenous signal pattern in the repair tissue (B) A 36-year-old woman with a talar OCD lesion 3.4 years after ACI surgery demonstrating a mottled-type heterogenous signal pattern in the repair tissue. (C) A 36-year-old man with a talar OCD lesion 4.3 years after ACI surgery demonstrating a homogenous signal pattern in the repair tissue.
The postoperative MRI was compared with the preoperative MRI to ascertain whether there were any changes in the amount of bone marrow edema ( Fig. 4 ). Fifteen grafts (62%) showed a decreased amount of edema after the ACI procedure. Four of the grafts (17%) had no change in the amount of edema while the 5 grafts (21%) actually exhibited an increase in the amount of bone marrow edema.
Figure 4.
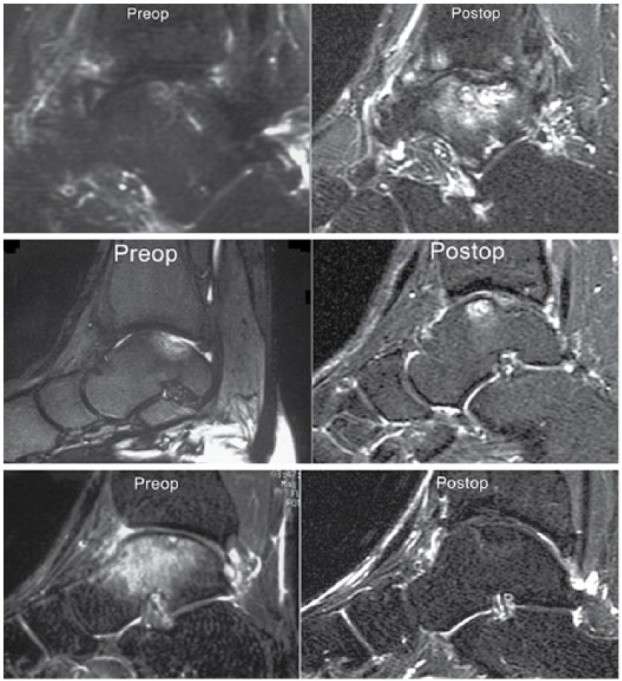
Bone marrow edema: (A) A 31-year-old man with a talar osteochondral defect (OCD) lesion 8.7 years after autologous chondrocyte implantation (ACI) surgery demonstrating an increase in bone marrow edema as compared to preoperative imaging. (B) A 36-year-old woman with a talar OCD lesion 3.4 years after ACI surgery demonstrating no change in the degree of bone marrow edema although it is now more prominently anteriorly as compared with preoperative imaging. (C) A 22-year-old man with a talar OCD lesion 3.8 years after ACI sandwich surgery demonstrating a decrease in bone marrow edema as compared to preoperative imaging.
The subchondral plate of the talus was assessed on MRI examination after the ACI procedure ( Fig. 5 ). Only 2 grafts (8%) were free of abnormalities or defects. Focal defects of the subchondral plate were seen on 10 grafts (42%). Seven cases (29%) exhibited slight depression of the subchondral plate over the graft as compared with the adjacent healthy subchondral plate. In addition, 5 cases (21%) showed evidence of both focal defects and subchondral plate depression in the graft.
Figure 5.
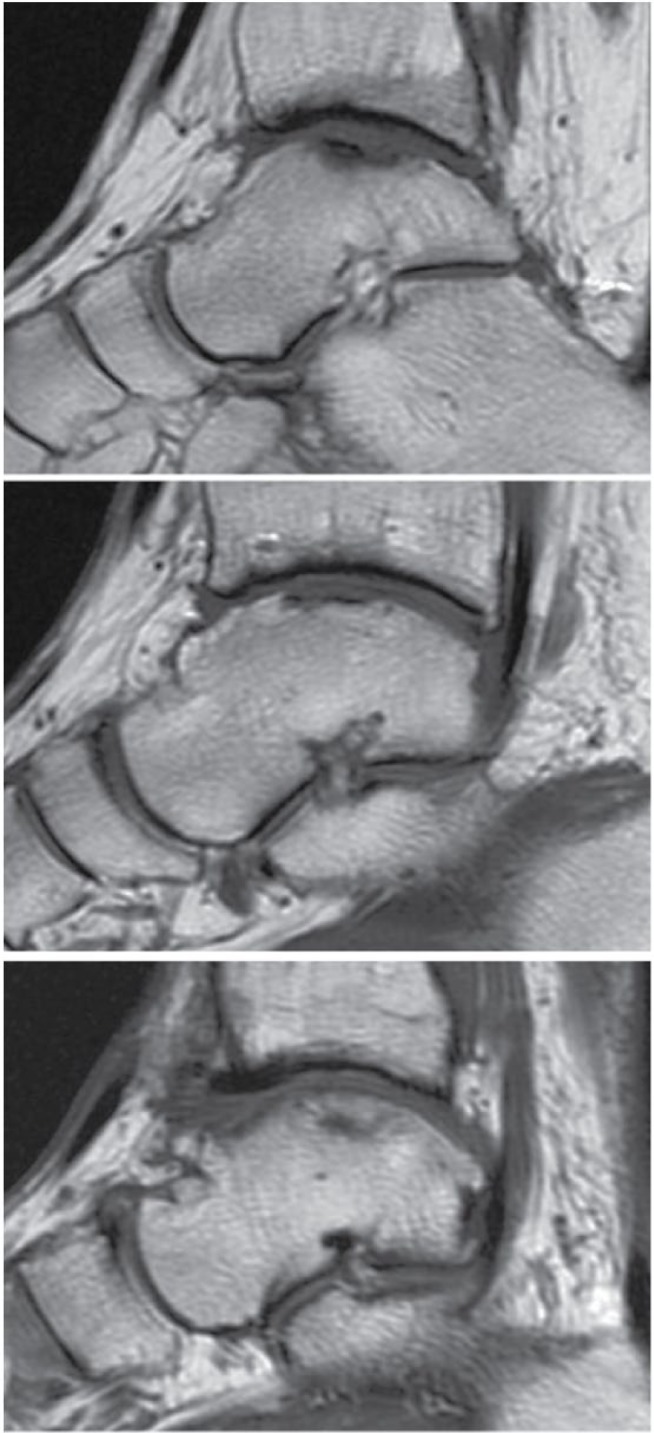
Subchondral plate abnormalities: (A) A 36-year-old woman with a talar osteochondral defect (OCD) lesion 3.4 years after autologous chondrocyte implantation (ACI) surgery demonstrating focal defects in the subchondral plate. (B) A 40-year-old man with a talar OCD lesion 4.6 years after ACI surgery demonstrating slight depression in the subchondral plate. (C) A 36-year-old man with a talar OCD lesion 4.3 years after ACI surgery demonstrating no defects of the subchondral plate.
Cystic lesions are commonly present in osteochondral lesions and improvement was seen in seven of the lesions (30%), which showed a decrease in cyst size after the ACI procedure ( Fig. 6 ). Two lesions (9%) demonstrated no change in cyst size while 7 (26%) were worse with increased cyst size. Eight grafts (35%) showed no presence of cystic lesions.
Figure 6.
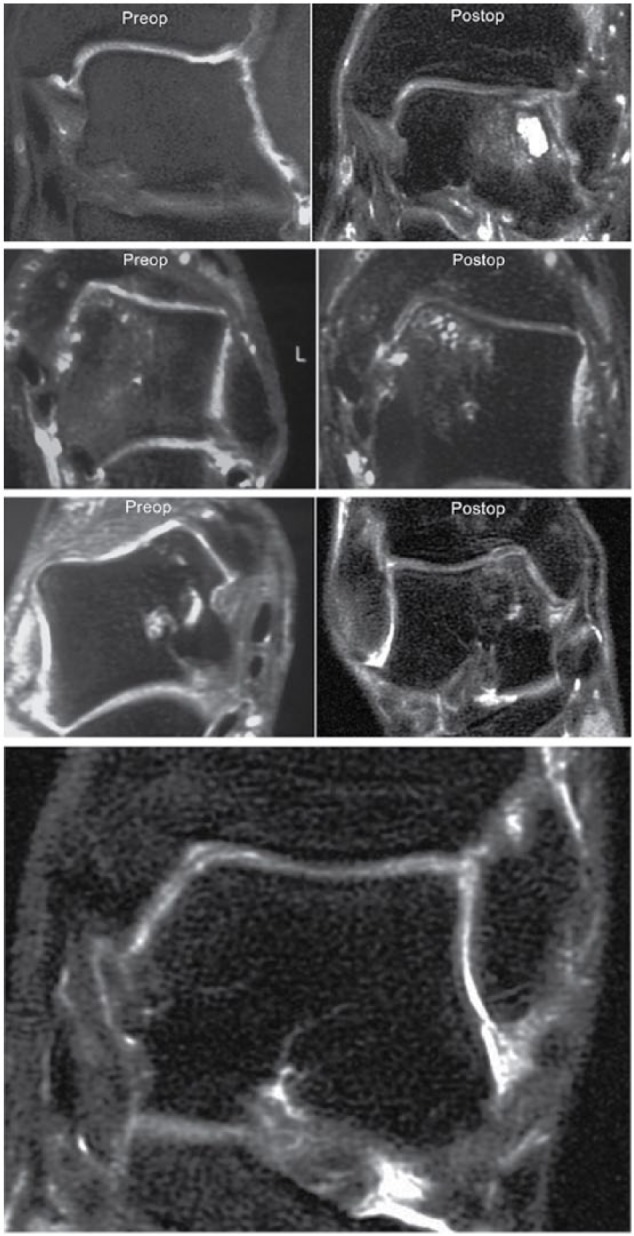
Cystic lesions: (A) A 31-year-old man with a talar osteochondral defect (OCD) lesion 8.7 years after autologous chondrocyte implantation (ACI) surgery demonstrating an increase in cystic lesions as compared with the preoperative imaging. (B) A 43-year-old man with a talar OCD lesion 8.9 years after ACI surgery demonstrating minimal change in cystic lesions as compared with the preoperative imaging. (C) A 47-year-old woman with a talar OCD lesion 8.1 years after ACI sandwich surgery demonstrating a decrease in cystic lesions as compared with the preoperative imaging. (D) A 36-year-old man with a talar OCD lesion 4.3 years after ACI surgery demonstrating no cystic lesions.
Clinical Correlation
The mean AOFAS score on postoperative follow-up was 87.8 with a statistically significant mean improvement of 39.4 points (P < 0.0001) after the ACI procedure was performed. No significant difference between the final postoperative AOFAS scores of the ACI group and sandwich procedure group was observed (P = 0.52).
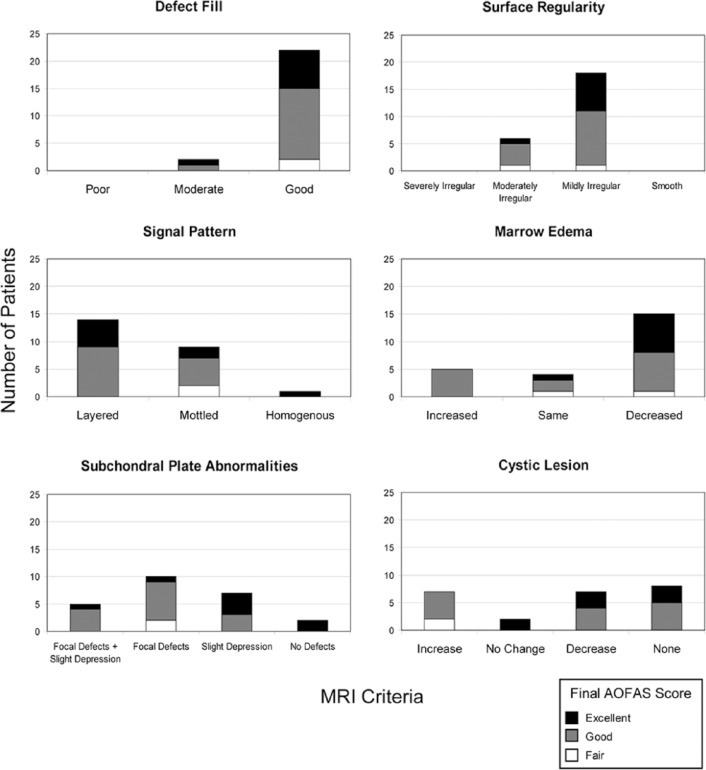
The final AOFAS scores were categorized as fair (AOFAS score 70-79), good (AOFAS score 80-89), and excellent (AOFAS score 90-100). Within these categories, we compared the MRI findings for each criterion ( Fig. 7 ).
Figure 7.
Magnetic resonance imaging criteria of the appearance of cartilage repair tissue broken down into American Orthopaedic Foot and Ankle Society (AOFAS) clinical outcomes—fair, good, or excellent.
The 2 patients with a fair AOFAS score demonstrated good defect fill in both cases, 1 was moderately irregular and 1 was mildly irregular when evaluating surface regularity and the signal pattern was mottled in both cases. The marrow edema was the same in one patient and decreased in the other while the subchondral plate showed focal defects in both. There was an increase in cystic lesions in both cases.
For the 14 patients with a good AOFAS outcome, 13 had good defect fill while 1 had moderate defect fill. Examining surface regularity found 4 showing moderate irregularity and 10 with mild irregularity. The signal pattern was layered in 9 and mottled in 5 while the marrow edema was increased in 5, remained the same in 2, and decreased in 7. Four patients had both focal defects and slight abnormalities in the subchondral plate, 7 had focal defects alone and 3 had slight depression alone. Cystic lesions were increased in 5 patients, decreased in 4 and 5 patients did not have any lesions on the postoperative MRI.
Eight patients had an excellent AOFAS final score. Seven demonstrated good defect fill and 1 had moderate defect fill while 7 patients had mild surface irregularities and 1 had moderate surface irregularities. The signal pattern was layered in 5, mottled in 2, and homogenous in 1. The marrow edema was decreased in 7 patients and remained the same in 1 patient. The subchondral plate abnormalities varied with 1 patient with focal defects, 4 with slight depression, and 1 with both. Two patients had no defects when evaluating the subchondral plate. No patients had an increase in cystic lesions, 2 had no change, 3 had a decrease, and 3 had no cystic lesions on follow-up MRI.
There was no correlation of results to lesion size or location, and there was no concomitant foot and ankle pathology noted in these patients.
Discussion
This study, to our knowledge, is the first prospective study to evaluate the MR appearance of osteochondral lesions of the talus after ACI and to compare the MR appearance with clinical outcome scores.
Our results demonstrate that patients have a wide variation in MR appearance after ACI surgery despite most clinically doing good or excellent (22/24). However, our results seem to suggest that certain categories of MR evaluation, such as marrow edema and cystic lesions, may prove to correlate stronger to clinical outcomes than others. Examining our results demonstrate that patients who had an excellent final AOFAS outcome score did not have an increase in marrow edema or an increase in cystic lesions on the follow-up MRI. Further research with larger numbers of patients would be needed to definitively confirm this trend.
In one of the few long-term follow-up study of ACI results in the ankle, Giannini et al.19 evaluated 10 patients with 10-year follow-up and found that clinical AOFAS scores rose from 37.9 to 92.7 points and that the T2-mapping of the cartilage revealed a well-remodeled articular surface similar in appearance to normal hyaline cartilage. Baums et al.20 also reported MRI results in addition to clinical findings in mean 5-year follow-up of 12 patients who underwent ankle ACI. Systematic evaluation of MRI appearance was not performed but the authors found on MRI that 7 of 12 grafts had excellent integration with nearly congruent joint surfaces, while 4 of 12 had slight surface irregularities but were fully integrated. Only one of the grafts was incongruous in appearance.
Most of the remaining literature on MRI follow-up of ACI surgery is in the context of the knee. We can extrapolate the findings in other studies on the knee to compare it with our results in the ankle. However, despite similarities in the ACI procedure, the knee and ankle are different joints with different biomechanics and contact stresses during normal gait.
In our study, we found that nearly all our grafts (22/24) had good fill of the defect. In MRI of ACI results in the knee, the amount of defect fill was correlated to clinical outcome with only 2 of 13 grafts exhibiting less than 50% fill.16 Other authors have also reported good fill characteristics on reviewing ACI results in the knee with MRI.9,23
None of the grafts in our study had a smooth surface appearance. The majority (18 grafts) had some mild irregularity and the rest (6 grafts) were moderate irregular. This contrasts with the literature in the knee that reported a percentage of grafts (range 34.7%-69.2%) do achieve a smooth appearance after healing and integration with the surrounding tissue.13,16,17 We speculate that our findings may be due to the intrinsic difference in performing the ACI procedure in the ankle versus the knee. As well, since we did not follow up the patients at a specified interval such as 1 or 2 years, our grafts may have degenerated over time.
Most of our grafts exhibited some MRI signal abnormalities with a layered or mottled appearance. In addition, the signal intensity of bone marrow edema did decrease or was minimal in the majority of the cases (15/24). This is consistent with other authors who have found a decrease in edema over time.9,11 The clinical significance of signal intensity increasing or remaining the same has not yet been determined.13,24,25,26
The subchondral plate in all but 2 of our grafts had some imaging abnormalities, including focal defects, slight depression, or both. This varies slightly to findings reported in the knee which have showed a range from 38% to 63% abnormalities in the subchondral plate.16,17 However, our clinical outcomes suggest that abnormalities in the subchondral plate do not appear to play a role in the overall clinical evaluation of the patient.
Seven of the grafts in our study showed an increase in cystic lesions whereas the rest had no change, decrease in cysts, or no cysts on MRI. As previously discussed earlier, patients with an excellent AOFAS score did not demonstrate an increase in cystic lesions. This suggests that an increase in cystic lesions may result in lower clinical results.
Limitations of this study include our relatively small sample size. However, it is rare, in our opinion, to be able to obtain long-term MRI follow-up on a group of 24 patients after ACI of the talus. Also, it was unfortunately not possible to quantitatively and thus, statistically compare MRI appearance of the cartilage repair tissue with the clinical outcome scores which limits the usefulness of our clinical and radiological comparison. In addition, the proton density talar dome view was our best cartilage sensitive sequence. The STIR sequence was our optimal sequence for the evaluation of bone marrow edema and cystic changes. Future studies may employ newer cartilage mapping sequences.
This study is important as it demonstrates long-term MRI follow-up findings on a sizable group of ankle ACI grafts. Our findings suggest despite the variations from a normal/nonoperative ankle seen on MRI, patients show improvement in clinical results following ACI surgery. While MRI is an important tool in the postoperative assessment of ACI grafts, the various MRI abnormalities must be interpreted with caution.
Footnotes
Acknowledgments and Funding: The author(s) received no financial support for the research, authorship, and/or publication of this article.
Declaration of Conflicting Interests: The author(s) declared no potential conflicts of interest with respect to the research, authorship, and/or publication of this article.
Ethical Approval: Ethical approval for this study was obtained from Southern California Orthopedic Research & Education.
Informed Consent: Verbal informed consent was obtained from all subjects before the study.
Trial Registration: Not applicable.
References
- 1. Brittberg M, Lindahl A, Nilsson A, Ohlsson C, Isaksson O, Peterson L. Treatment of deep cartilage defects in the knee with autologous chondrocyte transplantation. N Engl J Med. 1994;331:889-95. [DOI] [PubMed] [Google Scholar]
- 2. Romeo AA, Cole BJ, Mazzocca AD, Fox JA, Freeman KB, Joy E. Autologous chondrocyte repair of an articular defect in the humeral head. Arthroscopy. 2002;18:925-9. [DOI] [PubMed] [Google Scholar]
- 3. Koulalis D, Schultz W, Heyden M. Autologous chondrocyte transplantation for osteochondritis dissecans of the talus. Clin Orthop Relat Res. 2002;(395):186-92. [DOI] [PubMed] [Google Scholar]
- 4. Bradley JP, Petrie RS. Osteochondritis dissecans of the humeral capitellum. Diagnosis and treatment. Clin Sports Med. 2001;20:565-90. [DOI] [PubMed] [Google Scholar]
- 5. Bazaz R, Ferkel R. Treatment of osteochondral lesions of the talus with autologous chondrocyte implantation. Tech Foot Ankle Surg. 2004;3:45-52. [Google Scholar]
- 6. Nam EK, Ferkel RD, Applegate GR. Autologous chondrocyte implantation of the ankle: a 2- to 5-year follow-up. Am J Sports Med. 2009;37:274-84. [DOI] [PubMed] [Google Scholar]
- 7. Kwak SK, Kern BS, Ferkel RD, Chan KW, Kasraeian S, Applegate GR. Autologous chondrocyte implantation of the ankle: a 2- to 10-year follow-up. Am J Sports Med. 2014;42:2156-64. [DOI] [PubMed] [Google Scholar]
- 8. Mandelbaum BR, Gerhardt MB, Peterson L. Autologous chondrocyte implantation of the talus. Arthroscopy. 2003;19(Suppl 1):129-37. [DOI] [PubMed] [Google Scholar]
- 9. Henderson IJP, Tuy B, Connell D, Oakes B, Hettwer WH. Prospective clinical study of autologous chondrocyte implantation and correlation with MRI at three and 12 months. J Bone Joint Surg Br. 2003;85:1060-6. [DOI] [PubMed] [Google Scholar]
- 10. Choi YS, Potter HG, Chun TJ. MR imaging of cartilage repair in the knee and ankle. Radiographics. 2008;28:1043-59. [DOI] [PubMed] [Google Scholar]
- 11. Alparslan L, Winalski CS, Boutin RD, Minas T. Postoperative magnetic resonance imaging of articular cartilage repair. Semin Musculoskelet Radiol. 2001;5:345-63. [DOI] [PubMed] [Google Scholar]
- 12. Ho YY, Stanley AJ, Hui JH-P, Wang S-C. Postoperative evaluation of the knee after autologous chondrocyte implantation: what radiologists need to know. Radiographics. 2007;27:207-20. [DOI] [PubMed] [Google Scholar]
- 13. Tins BJ, McCall IW, Takahashi T, Cassar-Pullicino V, Roberts S, Ashton B, et al. Autologous chondrocyte implantation in knee joint: MR imaging and histologic features at 1-year follow-up. Radiology. 2005;234:501-8. [DOI] [PubMed] [Google Scholar]
- 14. Trattnig S, Millington SA, Szomolanyi P, Marlovits S. MR imaging of osteochondral grafts and autologous chondrocyte implantation. Eur Radiol. 2007;17:103-18. [DOI] [PMC free article] [PubMed] [Google Scholar]
- 15. Marlovits S, Striessnig G, Resinger CT, Aldrian SM, Vecsei V, Imhof H, et al. Definition of pertinent parameters for the evaluation of articular cartilage repair tissue with high-resolution magnetic resonance imaging. Eur J Radiol. 2004;52:310-9. [DOI] [PubMed] [Google Scholar]
- 16. Marlovits S, Singer P, Zeller P, Mandl I, Haller J, Trattnig S. Magnetic resonance observation of cartilage repair tissue (MOCART) for the evaluation of autologous chondrocyte transplantation: determination of interobserver variability and correlation to clinical outcome after 2 years. Eur J Radiol. 2006;57:16-23. [DOI] [PubMed] [Google Scholar]
- 17. Takahashi T, Tins B, McCall IW, Richardson JB, Takagi K, Ashton K. MR appearance of autologous chondrocyte implantation in the knee: correlation with the knee features and clinical outcome. Skeletal Radiol. 2006;35:16-26. [DOI] [PubMed] [Google Scholar]
- 18. Brown WE, Potter HG, Marx RG, Wickiewicz TL, Warren RF. Magnetic resonance imaging appearance of cartilage repair in the knee. Clin Orthop Relat Res. 2004;(422):214-23. [DOI] [PubMed] [Google Scholar]
- 19. Giannini S, Battaglia M, Buda R, Cavallo M, Ruffilli A, Vannini F. Surgical treatment of osteochondral lesions of the talus by open-field autologous chondrocyte implantation: a 10-year follow-up clinical and magnetic resonance imaging T2-mapping evaluation. Am J Sports Med. 2009;37(Suppl 1):112S-118S. [DOI] [PubMed] [Google Scholar]
- 20. Baums MH, Heidrich G, Schultz W, Steckel H, Kahl E, Klinger HM. Autologous chondrocyte transplantation for treating cartilage defects of the talus. J Bone Joint Surg Am. 2006;88:303-8. [DOI] [PubMed] [Google Scholar]
- 21. Ibrahim T, Beiri A, Azzabi M, Best AJ, Taylor GJ, Menon DK. Reliability and validity of the subjective component of the American Orthopaedic Foot and Ankle Society clinical rating scales. J Foot Ankle Surg. 2007;46:65-74. [DOI] [PubMed] [Google Scholar]
- 22. Malviya A, Makwana N, Laing P. Correlation of the AOFAS scores with a generic health QUALY score in foot and ankle surgery. Foot Ankle Int. 2007;28:494-8. [DOI] [PubMed] [Google Scholar]
- 23. Trattnig S, Ba-Ssalamah A, Pinker K, Plank C, Vecsei V, Marlovits S. Matrix-based autologous chondrocyte implantation for cartilage repair: noninvasive monitoring by high-resolution magnetic resonance imaging. Magn Reson Imaging. 2005;23:779-87. [DOI] [PubMed] [Google Scholar]
- 24. Chung CB, Frank LR, Resnick D. Cartilage imaging techniques: current clinical applications and state of the art imaging. Clin Orthop Relat Res. 2001;(391 Suppl):S370-8. [PubMed] [Google Scholar]
- 25. Gold GE, Bergman AG, Pauly JM, Lang P, Butts RK, Beaulieu CF, et al. Magnetic resonance imaging of knee cartilage repair. Top Magn Reson Imaging. 1998;9:377-92. [PubMed] [Google Scholar]
- 26. Roberts S, McCall IW, Darby AJ, Menage J, Evans H, Harrison PE, et al. Autologous chondrocyte implantation for cartilage repair: monitoring its success by magnetic resonance imaging and histology. Arthritis Res Ther. 2003;5:R60-73. [DOI] [PMC free article] [PubMed] [Google Scholar]


