Abstract
We present an analysis of the shape, surface quality, and imaging capabilities of custom 3D printed lenses. 3D printing technology enables lens prototypes to be fabricated without restrictions on surface geometry. Thus, spherical, aspherical and rotationally non-symmetric lenses can be manufactured in an integrated production process. This technique serves as a noteworthy alternative to multistage, labor-intensive, abrasive processes such as grinding, polishing and diamond turning. Here, we evaluate the quality of lenses fabricated by Luxexcel using patented Printoptical© technology that is based on an inkjet printing technique by comparing them to lenses made with traditional glass processing technologies (grinding, polishing etc.). The surface geometry and roughness of the lenses were evaluated using white-light and Fizeau interferometers. We have compared peak-to-valley wavefront deviation, root-mean-squared wavefront error, radii of curvature and the arithmetic average of the roughness profile (Ra) of plastic and glass lenses. Additionally, the imaging performance of selected pairs of lenses was tested using 1951 USAF resolution target. The results indicate performance of 3D printed optics that could be manufactured with surface roughness comparable to that of injection molded lenses (Ra < 20 nm). The RMS wavefront error of 3D printed prototypes was at a minimum 18.8 times larger than equivalent glass prototypes for a lens with a 12.7 mm clear aperture, but when measured within 63% of its clear aperture, 3D printed components’ RMS wavefront error was comparable to glass lenses.
Keywords: 3D printing of optical components, Lens fabrication, Lens characterization
1 INTRODUCTION
Optical elements can me manufactured through a variety of techniques. Grinding and polishing are well-established methods used to manufacture precise optical elements. Traditionally, lenses for the visible part of optical spectrum are made from glass, and materials such as crystals and metals are used to build systems in infrared and ultraviolet part of the electromagnetic spectrum [1–3]. Today, mass- produced optical components are often made using polymers. Polymer-specific processes such as injection [4] or compression [5] molding can be tuned for high-volume manufacturing. While tooling and tuning of production process for those techniques is both labor intensive and costly, efficiency and high rate of production results in a low overall cost of mass-produced components. Currently, these state-of-the-art lens fabrication techniques permit the production of parts with surface quality on the nanometer scale (roughness, form), but each method faces challenges when trying to prototype optics of complex geometries. Traditional grinding and polishing techniques are not optimal for production of non- spherical components [1] and existing techniques for creating aspherical components are laborious and costly [6–8]. Recent advances in numerically controlled magnetorheological machining has enabled production of high quality freeform optical components, though these processes still require lengthy part-processing and experience problems with production scalability [9–10]. For molding techniques, the shape of the lens is defined by mold geometry, which makes it possible to mass- produce spherical, aspherical and freeform optics without additional cost at high volumes [2, 10]. However, molding techniques are limited by the availability or production costs of the molds themselves, which can often range upwards of $25,000 and can be impractical for prototyping [2]. Prototyping using non-ferrous materials is best served by diamond-turning technology [11, 13–15]. Unlike other manufacturing technologies, diamond turning allows for direct prototyping of refractive, reflective, and diffractive elements without the need for subsequent post-processing steps. The main disadvantage of diamond turning technology, especially for wavelengths below the infrared region, is scattering of manufactured components due to high frequency residual imprint of a diamond tool.
Three-dimensional printing technology introduced at the beginning of 1990 [16] is quickly gaining market share for prototyping and short scale production [17]. Originally thought of as a tool to manufacture evaluation prototypes for research and development departments and as a tool to simplify mold production, 3D printing has quickly evolved into a technique used in both industry and academia and appears poised to revolutionize consumer markets in the near future [18–23]. With recent progress and available materials, it is now possible to print structural, electrically conductive [24] and magnetic parts [25] used in integrated electro-mechanical systems [26]. As prototyping of mechanical components progresses rapidly, and prototyping of functional mechanical components is currently a well-established technology, 3D printing of optical components has just emerged as another application of this technology. Printing optics is challenging due to the specific requirements of high purity and uniformity of fabricated components that goes together with tight geometrical tolerances that are typically on the order of a fraction of the wavelength. Functional optical components, such as aspheric lenses and waveguides, have been successfully printed for terahertz range [27–30]. In THz regime, mechanical precision of most of the 3D printing machines that is on the order of tens of mm is acceptable as those tolerances are smaller or comparable to the wavelength of propagating radiation. However, optics manufactured for the visible range of the electromagnetic spectrum must have geometric tolerances that are on order of nanometers, which is out of range for most current 3D printing machines. In the visible region, examples of successfully manufactured optical components include light guides, transparent windows, fibers, opto-electo-mechanical sensors and small lenses [24, 26, 28]. Recent attempts to create simple lenses using inkjet-like printing technology resulted in the synthesis of small (<7mm) flexible lenses that can be attached to smartphones and potentially used for microscopy applications [31]. However, the size of lenses manufactured using this technique is limited by surface tension to diameters on the order of millimeters, with little control of surface geometry. Luxexcel has recently developed a manufacturing technique that enables the production of freeform optical components. These components are manufactured using a UV-curable photopolymer with a refractive index of 1.53 that is jetted onto a poly(methyl methacrylate) (PMMA) substrate with a refractive index of 1.49 [35]. Subsequently, the polymer is allowed to set before the fabricated lenses are cured to a solid state using UV light, effectively hardening the photopolymer into a desired shape. This combinational technique of inkjet printing and molding enables prototyping of optical components in range between 1mm and 180 mm in diameter with arbitrary shape, ultimately favoring plano-spherical and aspherical lenses. Manufacturing only requires a specific Computer Aided Design (CAD) model. This technique does not require post-processing and unlike other optical manufacturing techniques, such as polishing and diamond turning, does not need to be tooled specifically for a manufactured part.
Here, we evaluate current state of Printoptical© Luxexcel technology through comparison of 3D printed lenses to geometrically-equivalent lenses obtained from Edmund Optics and Thorlabs. In order to perform fair comparison and simplify testing procedures between state-of-the-art glass lenses and 3D printed lenses, we selected spherical components. Lenses with apertures ranging from 10 mm to 50 mm were purchased from Edmund Optics and Thorlabs. Design schematics and parameters details were then sent to Luxexcel, and equivalent 3D printed lenses were acquired. The Luxexcel polymer properties were measured including index of refraction, transmission, and autofluorescence as a part of evaluation procedures. The refractive index was characterized between 486–656 nm using a refractometer. A spectrophotometer was used to characterize transmission of the material between 310–1080 nm, and a fluorimeter with excitation wavelengths ranging from 300–750 nm was used to measure the autofluorescence profile. White light interferometric data was acquired for both the Luxexcel lenses and the reference lenses to compare surface roughness. Fizeau interferometry was applied to measure surface figure. Finally, we imaged a 1951 USAF resolution target using a 3D printed lens and glass substitutes. An optical system comprising of a microscope illumination system, a narrow band interference filter, an adjustable aperture stop and a monochromatic detector was used to evaluate resolution limit of both lenses working in 1x magnification.
2 METHODS
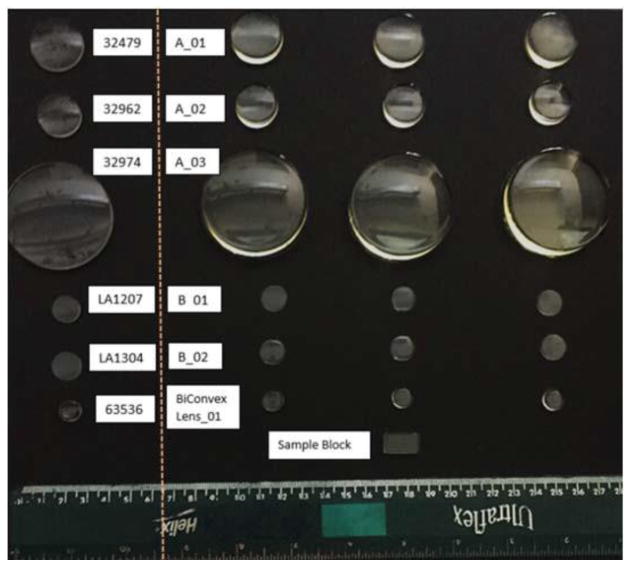
Six glass lenses were purchased from Edmund Optics and Thorlabs to serve as quality references, and their geometries are summarized in Table 1. All lenses were plano-convex except for Edmund Optics lens 63536, which was a biconvex lens. For each of the six reference lenses, three equivalent Luxexcel lenses were purchased and printed. In total, we tested 18 lenses. Additionally, a single 8 mm x 15 mm x 3 mm solid rectangular prism was purchased from Luxexcel for material characterization purposes. All investigated components are show in Figure 1.
Table 1.
Correspondence table for Luxexcel 3D printed lenses and their geometrically equivalent glass lenses obtained from Edmund Optics (EO) or Thorlabs (TL).
| Edmund Optics/ Thorlabs Lens ID | Luxexcel Lens ID | Diameter (mm) | Nominal Focal Length (mm) | Nominal Radius of Curvature (mm) |
|---|---|---|---|---|
| 32479 (EO) | A_01 | 25 | 75 | 38.76 |
| 32962 (EO) | A_02 | 20 | 60 | 31.01 |
| 32974 (EO) | A_03 | 50 | 150 | 77.52 |
| LA1207 (TL) | B_01 | 12.7 | 100 | 51.5 |
| LA1304 (TL) | B_02 | 12.7 | 40 | 20.6 |
| 63536 (EO) | BiConvexLens_01 | 10 | 50 | 14.8 |
Figure 1.
Image of all tested glass lenses and geometrically equivalent Luxexcel lenses. The dashed line separates the glass lenses (left) with their corresponding 3D printed prototypes (right). The sample block used for material characterization is shown below the Luxexcel lenses.
The refractive index of the Luxexcel Opticlear® material was measured on an Atago Multi-Wavelength Abbe DR-M4 refractometer. The refractometer was calibrated with a test piece of a known refractive index (n=1.6199) prior to all measurements. Each measurement was taken at room temperature with a thin layer (<1mm) of monobromonaphthalene employed as a contact liquid. The material refractive index was quantified at four discrete wavelengths, using 486 nm, 546 nm, 589 nm, and 656 nm filters. Measurements were taken three times, and results were averaged. Transmission of the Luxexcel Printoptical© material was characterized using a Varian Cary 50 UV-Vis spectrophotometer. After performing a baseline calibration measurement, transmission of a Luxexcel sample block was measured across a wavelength range of 310–1080 nm. Spectrophotometry measurements were taken three times, and the data was averaged. A Horiba Scientific Fluorolog steady-state spectrofluorometer was employed to quantify emission. Excitation wavelengths at 4 nm intervals were used between 300–750 nm to characterize the fluorescence between 300–1150 nm, a range chosen due to the limit of the machine’s photodetectors. The scan was run three times, and results were averaged. We also tested birefringence for all 3D printed lenses by placing them between two linear polarizers. No visible birefringence was observed for any of the tested Luxexcel lenses.
White light interferometry measurements were taken to characterize surface roughness [32–33] using a Zygo NewView 5000 (Zygo, CT). Images of the surface were acquired using a 10x magnification Mirau objective with 1.3x zoom. All roughness measurements were taken across a 0.22 mm² surface area (0.55 mm x 0.4 mm). Using the Zygo micro.app software, a 20 μm vertical scan was performed to measure surface profile. Zygo built-in least square interpolation routines were used to measure radius of curvature of each tested lens. The radius of curvature was then subtracted from the measured topographic profile, and a 2.51 μm low-pass filter was used to remove noise. The following properties were assessed for each lens for data-set with removed spherical component: peak-to-valley (P-V), root mean squared (RMS), roughness average (Ra). Several measurements were taken for each lens while fine-tuning the mounting of the lens. Measurements were recorded once the PV, RMS, and Ra were minimized after making the appropriateadjustments.
A Zygo PTI 250 Fizeau interferometer was applied to assess surface figure [32]. All measurements were acquired using a F/# 4.8 reference sphere with identical data acquisition and data post-processing settings. Measurements were taken at the confocal position for each Luxexcel lens as well as the equivalent glass lens. A custom, fixed mask was created to assure that measurements were taken over the same surface area for each lens. The diameter of the circular mask was roughly 10.5 mm. An exception was made for the smallest lens, 63536/BiConvex_01, as we needed a reduced mask (9 mm) to remove fringe patterns artifacts observed at the edges of the clear aperture. Position of each of the tested lenses was adjusted based on interference pattern and we manually removed z-axis offset by adjusting axial position of the measurement head. Tilt was controlled by applying corrections to tilt-tip stage driven by micrometer screws. Residual z-offset and tilt were removed by the interferometer built- in software. Peak-to-valley, root mean squared, astigmatism magnitude, and coma magnitude were computed for each lens. Fine tuning was again performed to minimize PTV and RMS for each lens, and these results were recorded. We also took radius of curvature measurements using the Fizeau interferometer. Additionally, radius of curvature of each lens was measured by assessing the difference between the cat's-eye and confocal positions of the measurement head. The z-location of the measurement head was provided by internal linear gauge system that was accessed through MetroPro application RadScalePTI.app. Due to small variances in the z-location traveled as determined by the MetroPro software, radius of curvature measurements were taken 3 times for each lens and averaged after the mounting of the lenses were adjustedappropriately.
An optical resolution of a test lens was measured using a 1951 USAF resolution target. The 1951 USAF resolution target was illuminated by a white light source and imaged by the tested lens. Conjugates were set to provide in 1x magnification. Images of the target were recorded by an 8-bit, monochromatic DMX 72BUC01 CCD camera (The Imaging Source, NC). In order to avoid influence of uncorrected chromatic aberrations (all tested lenses were singlets), a 650 nm narrowband interference filter was used directly behind illumination source. The imaging system was constructed exclusively from a single, tested lens in order to avoid degradation of performance due to imperfections of additional components. Since wavefront aberrations are aperture dependent we repeated measurement four times for each lens with different arbitrarily-selected diameters of a tunable diaphragm that was placed in front of the tested lens. We hypothesize that at full aperture, performance of tested lenses is limited by aberrations, rather than diffractive effect. Thus, reduction of the clear aperture results in improvement of performance up to the point where size of the aperture becomes so small that diffractive effects will dominate.
Material uniformity can also contribute to the performance of an optical component. We created a software model for our system to confirm that the difference in performance could be explained by the surface quality of the lenses. We used Zernike polynomials to approximate the shape of the test lens used in our 1x magnification imaging test. Zernike polynomial coefficients were interpolated using data from the Fizeau interferometer. The convex surface of the lens was measured using the F/# 4.8 reference sphere, and the plano surface of the lens was measured using a reference flat. Results obtained from Fizeau interferometer were used to fit the first 16 coefficients of the Zernike polynomial. We modeled our test lens in Zemax® (Radiant Zemax®, Redmont, WA, USA) to measure the theoretical performance. The theoretical performance of the test lens was calculated with measured Zernike polynomials used to approximate the actual surface quality. From this, we took the software-calculated theoretical limit of our test lens in 1x magnification and compared that to the data we acquired from our imaging experiment to confirm that the surface quality could directly explain the theoretical limits of the Luxexcel lenses.
3 RESULTS
3.1 Material Characterization
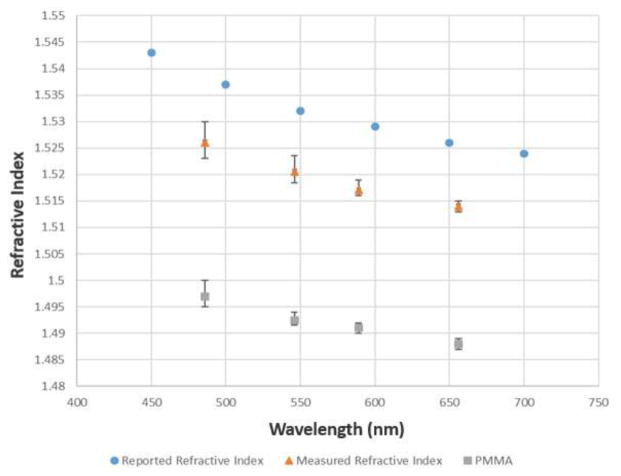
We have measured the following properties of Luxexcel Opticlear® optical material: refractive index, transmission, and autofluorescence. For reference purposes, all below measurements were repeated on in-house sample of PMMA. PMMA is commonly used to fabricate plastic optical components, as it has a similar refractive index and Abbe number s i m i l a r to BK7 glass. Refractive index data for both the Luxexcel polymer and PMMA are displayed in Figure 2. The nominal refractive index of the Luxexcel Opticlear® material was obtained from the Luxexcel website [34] and is plotted with dots. Measured averaged values of the refractive index together with error bars are plotted with triangles. The refractive index data for reference in-house sample of a PMMA are plotted with rectangles together with corresponding error bars. The refractive index of the Luxexcel material was found to be about 2% higher than PMMA across all tested wavelengths and about 1% lower than nominal value reported by the manufacturer. Our measurements of refractive index were limited to spectral range of 486–656nm by available set of narrow band interference filters compatible with the Atago refractometer.
Figure 2.
Measured refractive index of Luxexcel Opticlear® material plotted across visible light spectrum. The blue dots represent the nominal values reported by Luxexcel. The orange triangles display measured results for Luxexcel. Opticlear®. The gray squares represent data points measured for in-house PMMA sample.
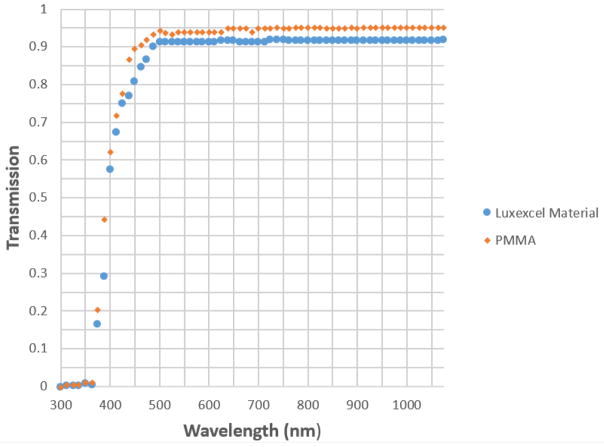
The profile of transmission was observed across wavelengths of 300 – 1100 nm, as these were the limits of the Varian Cary 50 UV-Vis spectrophotometer. The data for PMMA and Luxexcel Opticlear® material is presented in Figure 3, and transmission curves for Luxexcel and PMMA are marked with blue dots and orange diamonds respectively. The data displays the raw transmission measurements for both materials, including Fresnel losses. Measured transmission was over 80% at wavelengths above 445 nm for PMMA and above 450 nm for Luxexcel material. Transmission in UVA band rose between 5% at 320 nm to 35% at 400 nm, while transmission of 300 – 315 nm light in the UVB band remained relatively constant at 5%. On average, transmission was only 4% higher for PMMA, a small difference that makes both materials similar in terms of light transmission properties.
Figure 3.
Plot of transmission vs wavelength for Luxexcel Opticlear® polymer (blue circles) and reference in-house PMMA sample (orange diamonds).
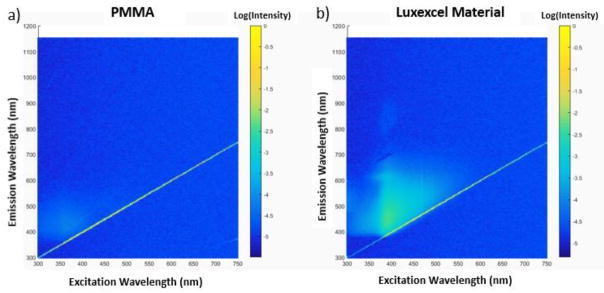
The same samples used in the spectrophotometry measurements were used to characterize material autofluorescence. Each sample was illuminated with excitation wavelengths of 300–750 nm, and emission was measured between 300 nm – 1150 nm. Both ranges were hardware limited by the Horiba Scientific Fluorolog spectrofluorometer. The data is displayed in Figure 4. The subplot 4(a) shows excitation emission matrix for the PMMA sample. The excitation emission matrix for Luxexcel Opticlear® polymer is presented in subfigure 4 (b). Both 2D plots have logarithmic color scales and unified colorbar ranges for visualization purposes. As shown in Figure 4(a), the PMMA sample exhibits weak autofluorescence in the excitation range of 350–400nm. On the other hand, the Opticlear® polymer has broad-band emission in visible spectrum when excited in the wavelength range 350–500nm. Since Stokes shifts for most fluorophores is typically on the order of tens of nm, this suggests non-fluorescent applications of the 3D printed plastic.
Figure 4.
Excitation-emission matrixes for PMMA (a) and Luxexcel Opticlear® (b).
3.2 Roughness and Radii of Curvature Measurements
Using white light interferometry, we measured the radius of curvature, peak-to-valley, root mean squared and Ra for the glass reference lenses and the Luxexcel lenses. Table 2 displays the averaged results where all values were rounded to the nearest. Raw data for each lens can be seen in Supplemental Table 1 (see appendix). Minimum, maximum, and average values are used to show range and variance within the three 3D printed samples of each design. While radii of curvature were found to be within 0.5% of the nominal value for most of the glass lenses, the radius of curvature for the 3D printed prototypes deviated from nominal values anywhere from 0.2%–13%. Additionally, surface irregularities quantified by P-V and RMS deviation were an order of magnitude higher for the 3D printed prototypes as compared to reference glass lenses. The roughness values of 3D printed lenses, however, are comparable with roughness of plastic lenses fabricated with injection molded processes which are on the order of single nm for state-of-the-art and ~10nm for “normal” quality production processes [4].
Table 2.
White light interferometry data for 3D printed lenses and glass lenses. For 3D-printed lenses, the best and worst performing lens in each category from each set of 3 are shown along with the average values.
| Lens ID | Nominal Radius of Curvature(mm) | Software-calculated Radius of Curvature (mm) | Peak-to-valley (nm) | Root mean squared (nm) | Ra (nm) | ||||||||
|---|---|---|---|---|---|---|---|---|---|---|---|---|---|
| Min | Max | Avg | Min | Max | Avg | Min | Max | Avg | Min | Max | Avg | ||
| 32479 | 38.76 | 38.81 | 5 | 1 | 1 | ||||||||
| A_01 | 33.94 | 34.60 | 34.32 | 96 | 125 | 111 | 20 | 23 | 22 | 16 | 18 | 17 | |
| 32962 | 31.01 | 31.01 | 7 | 1 | 1 | ||||||||
| A_02 | 30.99 | 31.14 | 31.08 | 27 | 39 | 32 | 6 | 11 | 9 | 5 | 10 | 8 | |
| 32974 | 77.52 | 77.34 | 7 | 1 | 1 | ||||||||
| A_03 | 63.89 | 74.27 | 70.60 | 48 | 68 | 55 | 13 | 19 | 15 | 11 | 16 | 13 | |
| LA1207 | 51.5 | 51.47 | 5 | 1 | 1 | ||||||||
| B_01 | 44.84 | 45.79 | 45.19 | 43 | 46 | 44 | 8 | 11 | 10 | 6 | 10 | 8 | |
| LA1304 | 20.6 | 20.58 | 7 | 1 | 1 | ||||||||
| B_02 | 19.19 | 19.32 | 19.26 | 44 | 108 | 66 | 8 | 20 | 13 | 6 | 16 | 10 | |
| 63536 | 14.88 | 14.96 | 10 | 2 | 2 | ||||||||
| BiConvexLens_01 | 14.72 | 14.77 | 14.73 | 37 | 85 | 61 | 6 | 18 | 13 | 6 | 15 | 11 | |
Figure 5(a) displays a 2D surface profile of a Thorlabs LA1207 lens, and Figure 5(b) shows its geometric equivalent, a Luxexcel B_01 lens. This pair of lenses was selected because Luxexcel B_01 has an average P-V and RMS deviation compared to the tested population. In both 2D maps presented in Figure 5, the radius of curvature, measured using white-light interferometer, has been removed. For the LA1207 lens and its 3D printed equivalent, deviations from sphericity were within 11 nm for the glass lens and within 169 nm for the plastic lens. The scale bars of 2D plots in Figure 5(a) and Figure 5(b) have different ranges to visualize full dynamic range of a respective data set. The inset in Figure 5(a) has colorbar range identical with the colorbar in Figure 5(b) to assist in comparative and qualitative evaluation of both lenses.
Figure 5.
White-Light interferometry measured surface profiles of (a) Thorlabs lens LA1207 and nominally identical 3D printed B_01 lens (b). Color bar ranges for both images are different in order to visualize different dynamic ranges of both data sets. For visual comparison purposes, surface plot of glass lens shown in (a) is presented in the inset with colorbar scale range identical with subfigure (b).
3.3 Form Measurements
Wavefront deformations caused by irregularity in lens surfaces were evaluated using Fizeau interferometer. Basic surface figure statistics are presented in Tables 3 and 4. Averaged radii of curvature, RMS and P-V are given in Table 3. Averaged astigmatism and coma magnitudes are displayed in Table 4. All numerical values measured in waves were rounded to the nearest thousandth, and all results presented in units of length were rounded to the nearest hundredth of a millimeter. Raw data for both tables can be found in Supplemental Table 2 in the appendix. Minimum, maximum, and average values are used to show range and variance for each set of measurements for both the glass lenses and their corresponding 3D printed prototypes. Generally, Luxexcel lenses exhibited larger magnitudes of aberrations than their geometric equivalents made from glass. The magnitudes of coma and astigmatism for the 3D printed lenses were one to two orders higher than their glass counterparts. Lenses B_01 had smallest measured magnitudes of coma and astigmatism, while lens A_01 had the largest measured combined magnitudes of aberrations. RMS and P-V metrics were also smallest for the B_01 lens. Its RMS was however 21 times higher and P-V was 15 time higher than the corresponding glass lens of the same geometry. Similar in terms of aberrations magnitude lens B_02 has identical 12.7mm diameter. Data from tables 3 and 4 suggest that the magnitude of aberrations, together with P-V and RMS are roughly proportional to diameter. We hypothesize that this may be due to 3D printing machine positioning tolerances and/or process-specific injection/curing parameters. The smallest tested lens, BiConvexLens_01, had diameter of 10mm and high magnitudes of aberrations together with large values of P-V and RMS. The bi-convex lens does not appear to follow the trend we see among the other plano-convex lenses, in which aberrations increase with lens diameter. We attribute this observation to Luxexcel- specific manufacturing/assembly process. Luxexcel-specific 3D printing technology requires assembly of non-plano lenses from any combination of plano-convex and plano-concave components, and this assembly process is likely responsible for the increased magnitude of aberrations.
Table 3.
Statistics for radius of curvature, P-V and RMS measured using a Fizeau interferometer. Averages shown are for 3D prototypes, as there were three samples of each. For Radius of Curvature measurement, multiple measurements were also taken and averaged due to small variance in the measured movement of the z-position as determined by the software.
| Lens ID | Nominal RoC (mm) | Fizeau Measured RoC (mm) | Peak-to-valley (wave) | Root mean squared (wave) | ||||||
|---|---|---|---|---|---|---|---|---|---|---|
| Min | Max | Avg | Min | Max | Avg | Min | Max | Avg | ||
| 32479 | 38.76 | 38.77 | 38.77 | 38.77 | 0.637 | 0.012 | ||||
| A_01 | 34.20 | 34.87 | 34.60 | 7.224 | 8.074 | 7.717 | 1.620 | 1.744 | 1.698 | |
| 32962 | 31.01 | 31.02 | 31.02 | 31.02 | 0.080 | 0.007 | ||||
| A_02 | 30.88 | 31.04 | 30.97 | 4.692 | 12.383 | 7.600 | 0.760 | 2.382 | 1.510 | |
| 32974 | 77.52 | 77.46 | 77.46 | 77.46 | 0.079 | 0.008 | ||||
| A_03 | 68.35 | 74.10 | 71.91 | 7.169 | 8.236 | 7.554 | 1.620 | 1.652 | 1.680 | |
| LA1207 | 51.5 | 51.28 | 51.29 | 51.28 | 0.135 | 0.016 | ||||
| B_01 | 44.90 | 45.63 | 45.25 | 1.908 | 2.140 | 2.048 | 0.301 | 0.379 | 0.336 | |
| LA1304 | 20.6 | 20.58 | 20.59 | 20.59 | 0.140 | 0.014 | ||||
| B_02 | 19.10 | 19.31 | 19.18 | 2.232 | 2.753 | 2.425 | 0.385 | 0.441 | 0.408 | |
| 63536 | 14.88 | 14.88 | 14.88 | 14.88 | 0.127 | 0.016 | ||||
| BiConvexLens_01 | 14.69 | 14.87 | 14.72 | 7.553 | 8.027 | 7.858 | 1.616 | 1.692 | 1.657 | |
Table 4.
Calculated astigmatism and coma magnitudes for 3D printed polymer and glass lenses.
| Lens ID | Astigmatism Magnitude (wave) | Coma Magnitude (wave) | ||||
|---|---|---|---|---|---|---|
| Min | Max | Avg | Min | Max | Avg | |
| 32479 | 0.011 | 0.037 | ||||
| A_01 | 7.755 | 8.434 | 8.169 | 1.016 | 1.231 | 1.097 |
| 32962 | 0.012 | 0.024 | ||||
| A_02 | 3.554 | 11.695 | 6.538 | 0.876 | 1.112 | 0.999 |
| 32974 | 0.024 | 0.029 | ||||
| A_03 | 7.743 | 8.575 | 8.078 | 0.432 | 1.041 | 0.766 |
| LA1207 | 0.029 | 0.008 | ||||
| B_01 | 1.275 | 1.580 | 1.429 | 0.679 | 0.767 | 0.723 |
| LA1304 | 0.033 | 0.016 | ||||
| B_02 | 1.481 | 2.389 | 1.907 | 0.545 | 0.767 | 0.664 |
| 63536 | 0.034 | 0.056 | ||||
| BiConvexLens_01 | 2.223 | 3.022 | 2.656 | 2.678 | 3.022 | 2.858 |
Example 2D wavefront plots for Edmund Optics 32962 and its 3D printed equivalent are presented in Figure 6(a) and 6(b) respectively. The Luxexcel A_02 lens was selected because it has representative performance for population of all tested 3D printed lenses. It has peak-to-valley and RMS deviation of 4.962 and 0.760 waves respectively. As shown in the Figure 6(a), wavefront errors of the reference lens were within a range of 0.08 wave, while corresponding 3D printed lens surface deviations, shown in Figure 6(b), were within 4.7 waves. The insert in Figure 6(a) presents reference glass lens wavefront deformations color coded in range identical with plot given in Figure 6(b) to aid in visual comparison between both components.
Figure 6.
2D plot of the wavefront error of the Edmund Optics 32962 lens (a) and equivalent 3D printed A_02 lens (b). Color bars in subfigures have different magnitudes in order to visualize full dynamic ranges of both profiles. Inset in Figure 6a has colorbar scale identical with Figure 6(b) to enable qualitative comparison between both lenses.
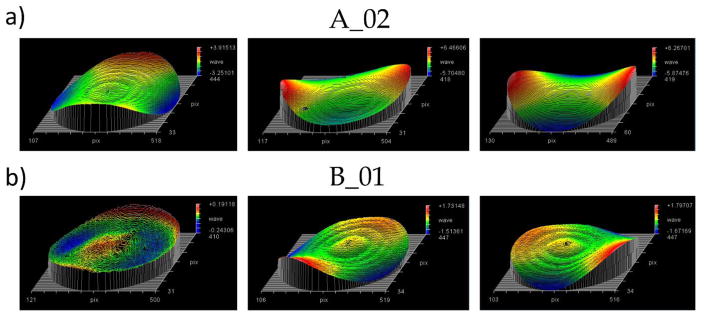
Surface error profiles were found to be both systematic and random as shown in Figure 7. Figure 7(a) is a display of the Fizeau surface profile for each of the three A_02 lenses. The error profiles are all qualitatively similar, albeit at different rotational angles. Figure 7(b) presents the surface measurements for the three B_01 lenses, in which one of the B_01 lenses has a surface profile with a different shape and features (left) than the other two lenses of the same type (middle and right). A further analysis of the presence of random error in the manufacturing process would require a higher volume of tested lenses.
Figure 7.
Presence of systematic and random error in the 3D printed lenses. The top row (a) shows lens A_02, where all lenses have a similar error profile at different rotational angles. The bottom row (b) shows lens B_01, where the leftmost lens has a different surface error profile than the middle and right lenses. Thus, some error in the manufacturing process is random.
3.4 Imaging Perfromance
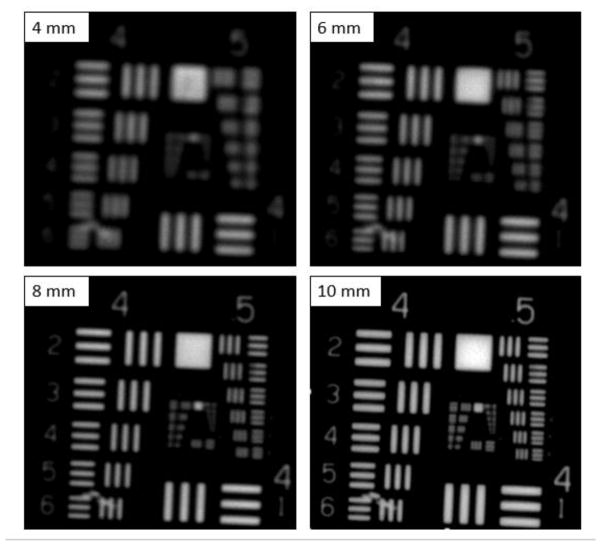
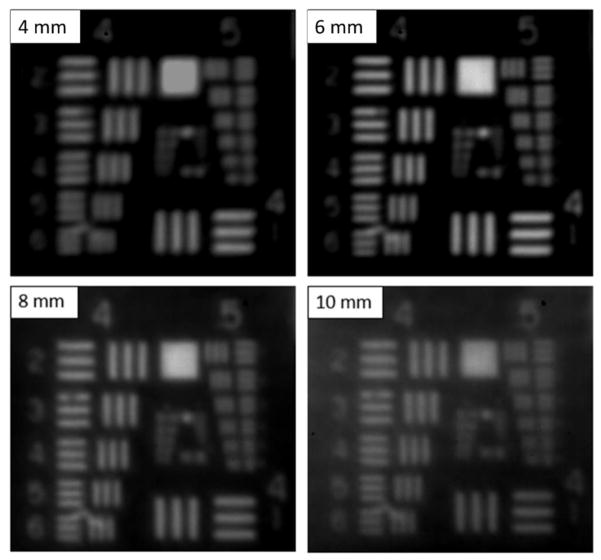
White-Light interferometry data and wavefront aberrations measured using a Fizeau interferometer are sufficient to assess quality of an optical component. While wavefront aberrations can be used to infer performance of the optical system, including resolution, we decided to also experimentally measure the resolution of two arbitrarily-selected lenses using the 1951 USAF resolution target. For this test, we selected the best-performing 3D printed lens, B_01, and its glass counterpart LA1207. Resolution was measured at four different diameters of a manually-controlled aperture, placed directly in front of a tested lens. Images of 1951 USAF resolution target given by Thorlabs LA1207 lens are shown in Figure 8 and corresponding results for the Luxexcel B_01 lens are presented in Figure 9. In a 1x magnification configuration, LA1207 lens reached resolution of 22.63, 32.0, 45.3 and 50.8 lp/mm for adjustable aperture diameters of 4, 6, 8 and 10mm respectively. Under identical conditions, B_01 reached 22.63, 32.0, 32.0 and 28.51 lp/mm resolution. The resolution of the glass lens rose proportionally with an increase in adjustable aperture diameter. Contrary to this, resolution of the 3D printed polymer lens was highest for a mid-range aperture between 6–8 mm. In general, resolution of an optical system working in finite conjugates depends on balance between wavefront aberration and system NA. For well-corrected systems, resolution depends exclusively from NA and can be described by the Rayleigh criterion. In the case of aberrated systems, resolution will depend on balance between aperture size and wavefront aberrations. Since wavefront deformations are field depended and usually decrease together with reduction of clear aperture, we speculate that best performance of plastic lens for 6–8 mm diaphragm was due to optimal balance between aberrations and input beam NA. Increase of aperture diameter should theoretically improve resolution of the polymer lens, but due do surface irregularities resolution decreased and system performance was effectively limited by aberrations rather than diffraction-limited. Please note that in support of this claim, at an aperture of 10mm, the image of the 1951 USAF is brightest and has lowest contrast among all images recorded using polymer lens. Overall, the Luxexcel lens resolution was below its glass equivalent for all measured clear aperture settings, but was quite acceptable for applications that do not emphasize resolution, such as low-resolution imaging and illumination systems.
Figure 8.
Images of the 1951 USAF resolution target recorded by the Thorlabs lens LA1207, in 1x magnification configuration. Diameter of the adjustable aperture is given in the insets.
Figure 9.
Images of a 1951 USAF resolution target recorded by the Luxexcel lens B_01, in 1x magnification conjugates. Diameter of the adjustable aperture is given in the insets.
3.5 Effect of Surface Error on Performance
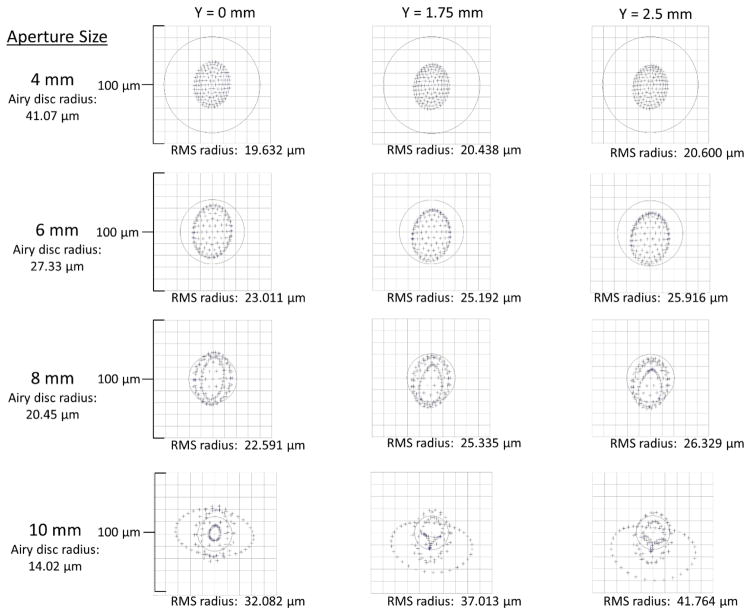
Figure 10 displays the results of our software model used to characterize the theoretical limit of lens B_01. Spot diagrams are shown for each of the aperture diagrams used in the imaging experiment shown in Figure 9. The performance of B_01 is shown with its surface shape approximated using the first 16 Zernike polynomials measured on the test lens on the Fizeau interferometer. Spot diagrams and airy discs are shown at the center of the field of view (left) and at distances 1.75 mm and 2.5 mm away from the center of the FOV for each aperture size. While we show these three different axis points, experimental verification was based on results from the on-axis simulation shown in the left column of Figure 10 as the smallest resolvable resolution targets were placed in the center of the FOV of the imaging system. When the RMS radius is lower than the airy disc radius, the system is diffraction-limited, and the airy disc radius will determine the resolution limit of the system. However, when the RMS radius is larger, the system will be limited by aberrations, and the RMS radius can be used to approximate the theoretical resolution limit. The theoretical performance was compared to the actual performance of the lens measured at a full aperture depicted in Figure 9 above. For the aperture sizes shown in the top row of Figure 10, the system is diffraction limited: a system with a clear aperture reduced to 4 mm has a resolution limit of 24.35 lp/mm, and a system with a 6 mm aperture has a resolution limit of 36.59 lp/mm. For the aperture sizes in the bottom row of Figure 10, the theoretical performance is aberration-limited, where on-axis performance is determined by the RMS radius listed in the left column. The on-axis theoretical performance is as follows: when the system has a reduced clear aperture of 8 mm the resolution is 44.27 lp/mm, and at a full aperture of 10 mm, the resolution limit is 31.17 lp/mm at the center of the FOV and 23.94 lp/mm. Strehl ratios were measured as 0.941 for 4 mm aperture, 0.777 for 6 mm aperture, 0.557 for 8 mm aperture, and 0.424 for 10 mm aperture. Given that resolution using a USAF target is discrete, we should expect the resolution limit to be group 4, element 4 for a 4 mm aperture, group 5, element 2 for a 6 mm aperture, group 5, element 3 for an 8 mm aperture, and group 4, element 6 for a 10 mm aperture. These theoretical values are all within 1–2 elements of the resolution limits we report above. This indicates that while there may be other factors contributing to the performance of these lenses (such as material uniformity), the surface figure dominantly impacts the overall system performance.
Figure 10.
Performance metrics of Lens B_01 modeled in Zemax® for aperture sizes of 4 mm, 6 mm, 8 mm, and 10 mm. Airy disc radius is shown under the aperture sizes on the left. Spot diagrams with RMS radius values are shown at the center of the field of view, and at distances 1.75 mm and 2.5 mm away from the center of the field of view.
4 DISCUSSION
We have assessed the roughness, wavefront aberrations, and imaging capabilities of plastic lenses fabricated using a novel 3D prototyping technology and compared their quality to geometrically identical state-of-the art glass lenses. White-light interferometry results showed that surface roughness of the 3D printed lenses was between 10 and 20 nm (Ra) and was one order of magnitude higher than roughness of reference glass equivalents (1 nm ≤ Ra ≤2 nm). Deviations from sphericity, as measured using the Fizeau interferometer, were higher for the 3D printed lenses than for glass counterparts. Typically, P-V deviation of the plastic lenses was found to be on the order of a single wave, while equivalent glass substitutes’ P-V was on the level of tenths of the test wavelength. Measured coma and astigmatism magnitudes were two orders of magnitude higher in case of the plastic lenses than comparable glass components. The 3D printed lenses consistently had higher surface figure errors than their glass counterparts. As shown in Figure 7, the source of error is both random and systematic, though a majority of the errors we observed were systematic. This systematic error is potentially correctable as the state of the technology matures.
We experimentally measured the performance of an arbitrarily-selected 3D printed lens and compared it with the performance of a nominally identical glass lens. Since 3D printed lenses had larger magnitudes of aberrations, and their RMS and P-V metrics were one order to two orders of magnitude higher than glass equivalents, our imaging system built using a plastic lens suffered from reduced contrast and had lower resolution. We were able to optimize performance of a plastic lens by adjusting its aperture stop diameter. We found that the resolution of a plastic B_01 lens was maximum when clear aperture was closed down to about 63% of the nominal diameter. Since resolution of a lens is a result of balance between theoretically predicted wavefront deformation and aberrations induced by surface irregularities, reduction of clear aperture decreases the theoretically-achievable resolution and simultaneously decreases wavefront aberrations. For that reason, for clear apertures below 63% of a full aperture, the tested plastic lens was primarily limited by the diffraction effects and for clear apertures above it, system performance was dominated by aberrations induced by lens surface irregularities. Analysis of lens performance vs. design parameters suggest that analyzed 3D printed process favors smaller lenses that have larger radii of curvature. Measured RMS values together with P-V deformations were highest for the two largest lenses, A_01 and A_03, which had 20 mm and 50 mm diameters respectively. The two lenses with the smallest diameters, B_01 and B_02, had the smallest values of P-V and RMS. We have also experimentally measured the index of refraction and transmission of the 3D printable Luxexcel Opticlear® material. We found that measured values of n(λ) are about 1% lower than reported by the manufacturer, which may be attributed to batch to batch variation in optical properties that are typical for many other optical materials including Polystyrene and PMMA. It should be noted that refractive index curve of the Opticlear® was very similar to the refractive index curve of the PMMA, albeit the index of refraction for Opticlear® was on average 2% lower. Transmission of the 3 mm thick block made from Opticlear® was 95% in the visible part of the electromagnetic spectrum. Spectral transmission curve of the Opticlear® was very similar to transmission curve of the PMMA, albeit the absorption of Opticlear® absorption was about 4% higher at visible wavelengths and was identical with PMMA in the UVA region. Tested 3D printable material exhibited autofluorescent properties in the excitation range of 370–550 nm. The emission maximum of the Opticlear® was located between wavelengths of 400 and 550nm, and the corresponding excitation maximum was located in the near UVA range at 390 nm. For that reason, use of the Opticlear® components in setups utilizing fluorescent dyes could be considered for fluorophores which excitation and emission bands are located in the far green, red and near infrared part of the spectrum for example: DyLight 594 or Alexa 660. Surface quality metrics used in this article, such as RMS, P-V, Ra together with aberrations coefficients indicate that tested 3D printed lenses suffered from unwanted geometrical deformations. Wavefront deformations of the tested 3D printed lenses were larger than wavefront deformations of a reference glass lenses. Additionally, while other factors such as material uniformity may decrease the performance of these lenses to an extent, it appears that most of the performance decrease can be explained by the surface error as determined by our Zemax® simulations with measured Zernike polynomials. Based on these results, we hypothesize that the performance would increase significantly if the surface figure could be improved upon. Currently, while 3D printed lenses cannot directly compete with off-the-shelf commercially available components, they may be an interesting alternative for those looking for asymmetric and free-form components. They can be also used successfully in illumination systems, which do not have stringent requirements for aberration corrections.
3D printing techniques provide a great degree of flexibility. Symmetric and asymmetric objects can be manufactured in unified automated production processes. Pricing of 3D printed parts depends on the volume of raw material rather than geometry and machining time. Additionally, using 3D printing processes, alignment features together with mounts and actuators can be built into components, allowing production of integrated modules. With the 3D printing technology in its early stage of development, we expect it to advance rapidly. We hope that 3D printing process improvements combined with advances in material engineering will result in improved quality of 3D printed optics. While 3D printed components are currently used mainly to test prototypes of opto-mechanical assemblies, we predict that this technology could be used in commercially available systems in the near future.
Supplementary Material
Acknowledgments
This work was made possible by funding from the National Institute of Health, grant R21 EB016832.
References
- 1.Malacara D, Thompson BJ. Handbook of Optical Engineering. Marcel Dekker, Inc; 2001. pp. 915–957. [Google Scholar]
- 2.Schaub MP. The Design of Plastic Optical Systems. SPIE Press; Bellingham, WA: 2009. [Google Scholar]
- 3.Karow HH. Fabrication methods for precision optics. Wiley & Sons; 2004. [Google Scholar]
- 4.Bäumer S. Handbook of Plastic Optics. WileyVCH; 2005. [Google Scholar]
- 5.Parks Robert E. Overview of optical manufacturing methods. 25th Annual Technical Symposium. International Society for Optics and Photonics; 1982. [Google Scholar]
- 6.Wagner RE, Shannon RR. Fabrication of Aspheres Using a Mathematical Modelfor Material Removal. Applied Optics. 1974;13(7):1683–1689. doi: 10.1364/AO.13.001683. [DOI] [PubMed] [Google Scholar]
- 7.Bajuk DJ. Computer Controlled Generation of Rotationally Symmetric Aspheric Surfaces. Optical Engineering. 1976;15(5):401–406. [Google Scholar]
- 8. [last accessed 07/26/2016];Satisloh product catalog. http://www.satisloh.com/fileadmin/contents/brochures/Precision_Optics/Polishing/Info_SPS-200_en.pdf.
- 9.Kordonski WI, Golini D. Fundamentals of Magnetorheological Fluid Utilization in High Precision Finishing. doi: 10.1106/011M-CJ25-64QC-F3A6. [DOI] [Google Scholar]
- 10.Golini Donald, et al. Precision optics fabrication using magnetorheological finishing. Advanced Materials for optics and precision structures. 1997;1 [Google Scholar]
- 11.Symmons A. Molded Optics: Design and Manufacture. CRC Press; Boca Raton, LA: 2011. [Google Scholar]
- 12.Dumas Paul R, et al. Flexible polishing and metrology solutions for free-form optics. ASPE Free-Form Optics, 2004 Winter Topical Meeting; Chapel Hill, NC. 2004. [Google Scholar]
- 13.Miller AC. TuB1 Single point diamond turning process development. TECHNICAL DIGEST SERIES-OPTICAL SOCIETY OF AMERICA. 1992;24:22–22. [Google Scholar]
- 14.Arnold B, Sladky RE, Steger PJ, Woodall ND, Saito TT. doi: 10.1117/12.7972052. [DOI] [Google Scholar]
- 15.Voelkel Reinhard. Wafer-scale micro-optics fabrication. Advanced Optical Technologies. 2012;405:135–150. 1.3. [Google Scholar]
- 16.Sachs EE, Cima MM, Williams PP, Brancazio DD, Cornie JJ. Three Dimensional Printing: Rapid Tooling and Prototypes Directly from a CAD Model. doi: 10.1115/1.2900701. [DOI] [Google Scholar]
- 17.Wittbrodt Ben T, et al. Life-cycle economic analysis of distributed manufacturing withopen- source 3-D printers. Mechatronics. 2013;23(6):713–726. [Google Scholar]
- 18. [last accessed on 2016.07.27];3D systems materials. http://www.3dsystems.com/files/direct-metal-brochure-0214-usen-web.pdf.
- 19.Berman Barry. 3-D printing: The new industrial revolution. Business horizons. 2012;55(2):413, 155–162. [Google Scholar]
- 20.Kamali Parisa, et al. The Current Role of Three-Dimensional Printing in Plastic Surgery. Plastic and reconstructive surgery. 2016;137(3):1045–1055. doi: 10.1097/01.prs.0000479977.37428.8e. [DOI] [PubMed] [Google Scholar]
- 21.Gross Bethany C, et al. Evaluation of 3D printing and its potential impact on biotechnology and the chemical sciences. Analytical chemistry. 2014;86(7):3240–3253. doi: 10.1021/ac403397r. [DOI] [PubMed] [Google Scholar]
- 22.Sears NA, et al. A Review of 3D Printing of Tissue Engineering Constructs. Tissue engineering Part B, Reviews. 2016 doi: 10.1089/ten.TEB.2015.0464. [DOI] [PubMed] [Google Scholar]
- 23.Gibson Ian, Rosen David, Stucker Brent. Additive manufacturing technologies: 3D printing, rapid prototyping, and direct digital manufacturing. Springer; 2014. [Google Scholar]
- 24.Leigh Simon J, et al. A simple, low-cost conductive composite material for 3D printing of electronic sensors. PloS one. 2012;7(11):e49365. doi: 10.1371/journal.pone.0049365. [DOI] [PMC free article] [PubMed] [Google Scholar]
- 25.Yan Yi, et al. Additive manufacturing of magnetic components for power electronics integration. 2016 International Conference on Electronics Packaging (ICEP); IEEE; 2016. [Google Scholar]
- 26.Willis Karl, et al. Printed optics: 3D printing of embedded optical elements for interactive devices. Proceedings of the 25th annual ACM symposium on User interface software and technology; ACM; 2012. [Google Scholar]
- 27.Squires AD, Constable E, Lewis RA. 3D printing of aspherical terahertz lenses and diffraction gratings. 2014 39th International Conference on Infrared, Millimeter, and Terahertz waves (IRMMW-THz); IEEE; 2014. [Google Scholar]
- 28.Cruz Alice LS, et al. 3D printed hollow core fiber with negative curvature for terahertz applications. Journal of Microwaves, Optoelectronics and Electromagnetic Applications 434 (JMOe) 2015;14:45–53. [Google Scholar]
- 29.Busch SF, et al. Optical properties of 3D printable plastics in the THz regime and their application for 3D printed THz optics. Journal of Infrared, Millimeter, and Terahertz Waves. 2014;437(35.12):993–997. [Google Scholar]
- 30.Pandey Shashank, Gupta Barun, Nahata Ajay. Terahertz plasmonic waveguidescreated via 3D printing. Optics Express. 2013;21(21):24422–24430. doi: 10.1364/OE.21.024422. [DOI] [PubMed] [Google Scholar]
- 31.Sung Y-L, Jeang J, Lee C-H, Shih W-C. Fabricating optical lenses by inkjet printing and heat-assisted in situ curing of polydimethylsiloxane for smartphone microscopy. J Biomed 442 Opt. 2015;20:047005. doi: 10.1117/1.JBO.20.4.047005. [DOI] [PubMed] [Google Scholar]
- 32.Malacara D. Optical Shop Testing. 3. Wiley; New York: 2007. [Google Scholar]
- 33.Wyant JC. White light interferometry. Proc SPIE 4737. 2002:98–107. [Google Scholar]
- 34. [last accessed 12/21/2016];Luxexcel Refractive Index Data. http://info.luxexcel.com/download-refractive-index-graph.
- 35. [last accessed 12/21/2016];Luxexcel Material Info. https://www.luxexcel.com/optics-prototyping/material-overview.
Associated Data
This section collects any data citations, data availability statements, or supplementary materials included in this article.


