Abstract
A prototype fiber-based imaging spectrometer was developed to provide snapshot hyperspectral imaging tuned for biomedical applications. The system is designed for imaging in the visible spectral range from 400 to 700 nm for compatibility with molecular imaging applications as well as satellite and remote sensing. An 81 × 96 pixel spatial sampling density is achieved by using a custom-made fiber-optic bundle. The design considerations and fabrication aspects of the fiber bundle and imaging spectrometer are described in detail. Through the custom fiber bundle, the image of a scene of interest is collected and divided into discrete spatial groups, with spaces generated in between groups for spectral dispersion. This reorganized image is scaled down by an image taper for compatibility with following optical elements, dispersed by a prism, and is finally acquired by a CCD camera. To obtain an (x, y, λ) datacube from the snapshot measurement, a spectral calibration algorithm is executed for reconstruction of the spatial–spectral signatures of the observed scene. System characterization of throughput, resolution, and crosstalk was performed. Preliminary results illustrating changes in oxygen-saturation in an occluded human finger are presented to demonstrate the system’s capabilities.
Keywords: snapshot imaging spectrometry, hyperspectral imaging, fiber bundle
1 Introduction
Hyperspectral imaging systems capture the spectrally resolved intensity of light emanating from each spatial position within an observed scene. These measured intensities over all spatial and spectral points constitute a three-dimensional (x, y, λ) datacube.1–4 Typically, when collecting this datacube, hyperspectral imaging requires either spatial scanning or spectral filtering. However, in recent years, various snapshot hyperspectral imaging techniques have been developed to obtain the three-dimensional (x, y, λ) information within a single exposure. Among them, some snapshot techniques implement computational methods such as compressive sensing (CASSI),5 tomographic reconstruction (CTIS),6 Fourier transformation (SHIFT),7 or channeled imaging polarimetry (MSI).8 Because of the computational reconstruction steps required in order to generate the data-cube, these techniques are called indirect hyperspectral imaging. In contrast, several direct hyperspectral imaging systems have emerged recently which do not require data-cube reconstruction, such as the image-replicating imaging spectrometer9 and image mapping spectrometer.10–13 Other direct techniques include imaging spectrometry using hyper-pixels,14 filter stacks,15 light-field architectures,16 and optical fiber bundles.17–24
Optical fibers have been widely used in designing and building imaging spectrometers.17–23 For applications such as biomedical imaging25 and remote sensing, tunability and compactness are two major properties of HSI systems. Tunability allows us to adjust both spatial and spectral resolutions to meet specific application requirements. Compact and miniaturized HSI systems have simple optomechanical designs and can be highly integrated and robust to harsh environmental factors and mechanical vibrations. Optical fibers offer a high degree of design flexibility and enable construction of tunable miniaturized HSI systems. The use of fibers in snapshot spectrometry was initially introduced in astronomy, where the spectrometer is typically combined with the telescope to identify celestial bodies.24 This technique has also found applications in the field of biomedical imaging such as retinal imaging.20,21 In most of these fiber-based snapshot spectrometer designs, the output end of the fiber bundle is reformatted into a single fiber column that acts as the input slit to a dispersive hyperspectral imaging system.17–23 Thus, the maximum number of fibers in the fiber column is limited by the detector array length, resulting in a fundamental limitation to the spatial sampling density which can be achieved. To date, the largest reported spatial sampling in fiber-based snapshot spectrometry was 44 × 40 = 1760 by Kriesel et al.,22 where the authors split and directed elements of a single fiber bundle to four separate spectrometers and subsequently recombined the datacube in postprocessing. With this approach, the authors avoided extending the detector array length to at least 1760 × 50 μm = 88 mm. A 100 × 100 fiber-optic snapshot imager was proposed recently, but only a theoretical model was reported.26 Many practical challenges remain in assembling snapshot fiber-optic hyperspectral imagers that will have densely packed fibers in the object as well as in the image space. Other than the detector length limitation, the single-row fiber configuration at the fiber bundle output is more susceptible to the light leakage between fibers, as the crosstalk between neighboring pixels increases with the packing density.27 Additionally, from the fabrication point of view, twisting and bending fibers assembled in densely packed bundles puts a high requirement on the fiber’s mechanical properties.
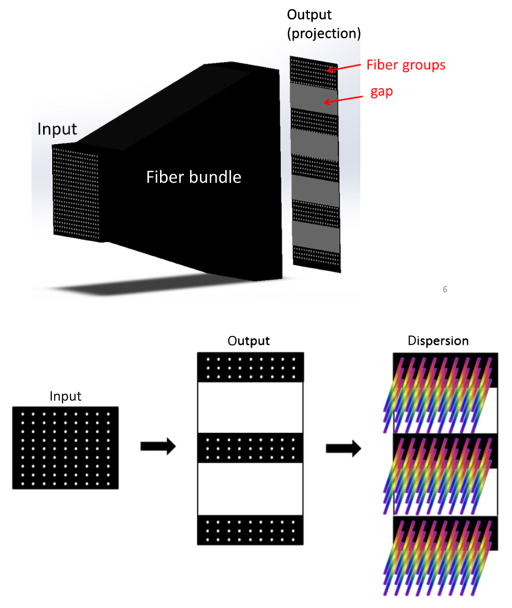
We have developed a new class of fiber-based imaging snapshot spectrometers. Our instrument potentially allows us to change spatial orientation of imaging fibers as well as a spectral resolution that is controlled by adjusting magnification and dispersion of the imaging system. We utilize compact, integrated custom stacked fiber bundle ribbons to sample object space. This solution allows us to achieve dense samplings of the object space and has the potential for a high degree of miniaturization and application specific tunability. Our fiber system is immune to crosstalk and has superior mechanical properties. Additionally, due to the strong demand of the telecommunication industry, fiber bundles can be purchased at competitive prices, giving us a cost savings advantage. The ability to build systems that are compact, light, and robust to environmental conditions is a key feature enabling the use of imaging spectrometers in applications like cube satellites for remote sensing purposes. To the best of our knowledge, this paper presents compact, snapshot imaging spectrometer with the unique feature of high spatial sampling, which is unprecedented in the literature. In this paper, we provide a detailed description of the design and fabrication process together with characterization of a prototype system. Images were collected and then distributed by the custom fabricated fiber bundle shown in Fig. 1. The image presented at the output of the custom fiber bundle is dispersed into predesigned void regions by a prism and then acquired by a CCD camera. In this way, we more than doubled the previous highest spatial sampling figure along both x and y dimensions to 96 × 81 pixels. This system is intended for imaging in the visible part of the electromagnetic spectrum in range 400 to 700 nm. To demonstrate its feasibility, we tested system’s performance by evaluating oxy-/deoxy-hemoglobin perfusion levels in superficial layers of skin under normal and ischemic conditions. In the future, we plan to use our instrument in tunable configuration—to show how modification of the spatial orientation of fibers together with adjustment of magnification and/or dispersive properties of an optical system allows control over spatial and spectral resolutions. This feature is critical in applications that require imaging of multiple fluorescence probes with heterogeneous properties in living cells. The ability to adjust imaging parameters provides convenient opportunity to optimize output signal for either spatial or spectral resolution, allowing to trade spectral resolution necessary to recognize individual probes for spatial resolution necessary to identify locations. Note that we previously presented preliminary results in a nonpeer-reviewed report in SPIE Proceedings.28 Here, we provide more rigorous system analysis and additional details regarding system design, performance, characterization, and overall discussion.
Fig. 1.
Fiber bundle design and image collection schematic. At the input end, fibers are organized in a regular matrix presented at the left-hand side of the figure. At the output end, fibers are organized into multiple groups separated by gaps. The void spaces in between the individual fibers are filled with spectral data objtained using prism. Because image plane include both spatial and spectral information, we can acquire complete (x, y, λ) datacube in a single snapshot.
2 System Setup
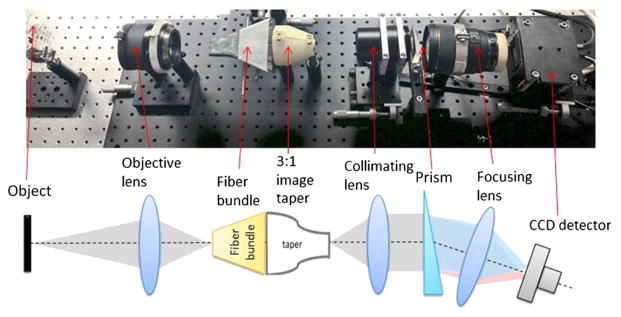
A photograph of the light-guide spectrometer system together with its layout is presented in Fig. 2. Presented system can work with various fore-optical subsystems, assuming that in the object space image given by the forward looking system has a size compatible with fiber optics input matrix dimensions and light impinging fibers can be efficiently coupled [numerical aperture (NA) compatibility]. Here, an objective lens (Hasselblad 80 mm f/2.8, HC, Sweden, Gothenburg) was positioned with the Hasselblad systems’ standard distance between the lens flange and the input face of the fiber bundle. The image presented by this lens was directly sampled by the input face of the fiber bundle and presented in a remapped form at the output end. The distal end of the fiber bundle (from the object’s perspective, the right side in Fig. 2) was subsequently 3× reduced in size by the glass image taper. Light emerging from the taper’s output face was collimated using a commercially available Olympus microscope lens (MVPLAPO 1×, NA = 0.25, WD = 65 mm, FOV = 34.5 mm). A custom glass wedge prism (material: SF4, 50 mm × 50 mm, 10-deg wedge angle, made by Tower Optics) was placed directly after the Olympus objective and served as a light dispersing element. A similar prism has served as the dispersing component in previously built imaging spectrometers.11 Directly following the prism, a focusing lens (Sigma 85 mm f/1.4 EX DG HSM) focused the spectrally separated and spatially remapped image onto a CCD sensor (Bobcat ICL-B6640M). The internal stop of the focusing lens was controlled electronically by a Canon camera body through a custom made interface.
Fig. 2.
Prototype light-guide snapshot spectrometer system setup and schematic layout. The image presented by an objective lens was directly sampled by the input face of the fiber bundle and presented in remapped form at the output end. The distal end of the fiber bundle was 3× reduced in size by the glass image taper and then collimated. A custom glass prism served as light dispersing element. Then, the spectrally separated image was focused and spatially remapped onto a CCD sensor.
3 Fiber Bundle Design and Fabrication
3.1 Fiber Bundle Design
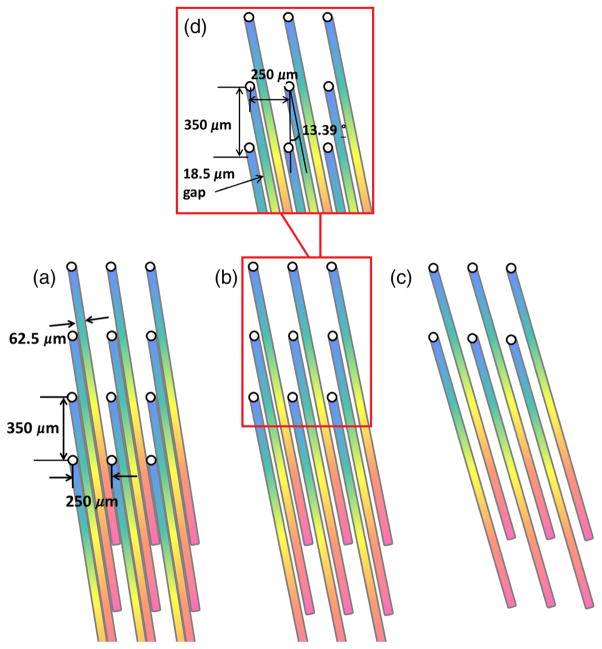
The custom made fiber bundle is a critical component of the light-guide snapshot spectrometer. At the input end of the bundle, fibers are densely packed in a 96 × 81 matrix (Fig. 1). The intercore spacing was 250 μm in the horizontal direction and 350 μm in the vertical direction. At the output end of the bundle, fibers are organized into 27 groups separated by a 2.5-mm gaps, with each group comprising 96 columns and 3 rows of fibers. This spatial organization of output fibers, namely introduction of gaps between fiber groups, generates free space for spectral information. We use a prism to decode the spectral signature of the light transmitted through each fiber. Figures 3(a)–3(c) schematically represent three possible arrangements of the spectrally dispersed intensities at the detector plane. Figure 3(a) shows that with a fixed intercore spacing of 250 μm and a fiber-core diameter of 62.5 μm (InfiniCor® 300 multimode fibers), a maximum of four spectral lines can be packed into the space between the images of each fiber at the sensor plane. However, in this case, there would be no space between lines, providing zero tolerance for crosstalk. The arrangements employing fewer rows of individual fibers [Figs. 3(b) and 3(c)] are other possible solutions, but come with the disadvantage of decreased spatial information density. To balance information density with cost and technical requirements for imaging optics, we decided to configure our system to fit up to three spectral lines between the fiber-core images as presented schematically in Fig. 3(b).
Fig. 3.
Three possible configurations of the spectrally dispersed intensities at the detector plane for groups of four, three, and two rows. With a fixed intercore spacing of 250 μm and a fiber-core diameter of 62.5 μm, (a) groups of four would have no space between lines, providing zero tolerance for aberrations. (b) Groups of three fibers offer less spatial information density but could accommodate residual aberrations introduced by the imaging optics. (c) Groups of two fibers do not offer efficient use of void space. (d) Configuration with optimal rotation angle of (13.39 deg) and a gap of 18.5 μm is presented.
As shown in Fig. 3, the dispersive prism must be oriented at an angle with respect to the grid of optical fibers to efficiently fill void space with spectral data. Figure 3(d) shows the process of calculation of the optimal rotation angle between the fibers and the prism. The lines should be evenly aligned in the available space. For a group of three fibers, the tangent of the optimal angle should be equal to one-third of the intercore distance (250 μm) divided by the interrow distance (350 μm)
| (1) |
Based on this arrangement, the optimal angle was calculated to be 13.39 deg. With the dispersed lines tilted at 13.39 deg with respect to the fiber-core grid, a gap of 18.5 μm [Fig. 3(d)] is provided between the lines (along the direction perpendicular to the dispersion axis). This gap can accommodate residual aberrations introduced by both the imaging optics and imperfect optomechanical alignment, while at the same time providing a buffer zone for unwanted crosstalk between spatial and spectral data.
3.2 Fiber Bundle Fabrication
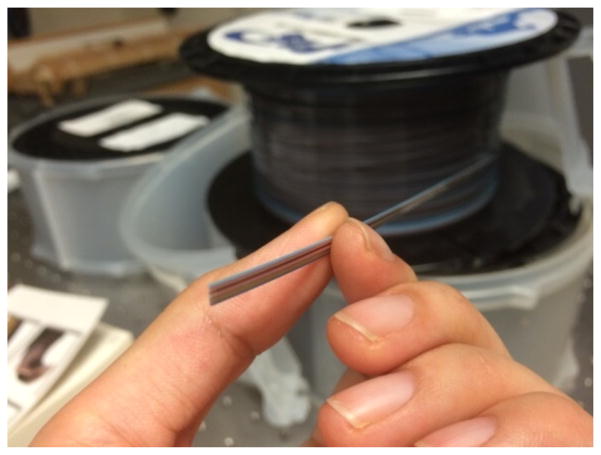
The fiber bundle was made from fiber ribbons (Fig. 4, the light connection (TLC) 12 fiber MM 62.5-μm ribbon, M62RB012C), instead of single fibers, to guarantee uniform distribution of the fibers. Commercially offered fiber ribbons are available in configurations in which a single ribbon consists of 4, 6, 8, 12, and 24 individual fibers. While the choice of 24-fiber ribbon seems to be the best from the point of view of manufacturing (providing the maximum number of fibers in a single line), this product is only available per custom orders. The manufacturer-estimated lead times are long, and the minimum length that needs to be purchased exceeds the needs of a scientific project focused on prototype scale production. Therefore, we chose to develop snapshot fiber-based spectrometer using the 12-fiber ribbon. The ribbon we used was made of 12 InfiniCor® 300 multimode fibers that have 62.5-μm diameter cores and 125-μm diameter cladding. Although this kind of fiber was originally designed for telecommunication with peak performance in the infrared parts of the electromagnetic spectrum, in our design it was short enough that losses incurred by wavelength mismatch were negligible.
Fig. 4.
TLC 12 fiber multimode 62.5-μm ribbon, a raw material used to manufacture integrated, fiber-based snapshot spectrometer.
3.2.1 Fabrication of fiber bundle assembly
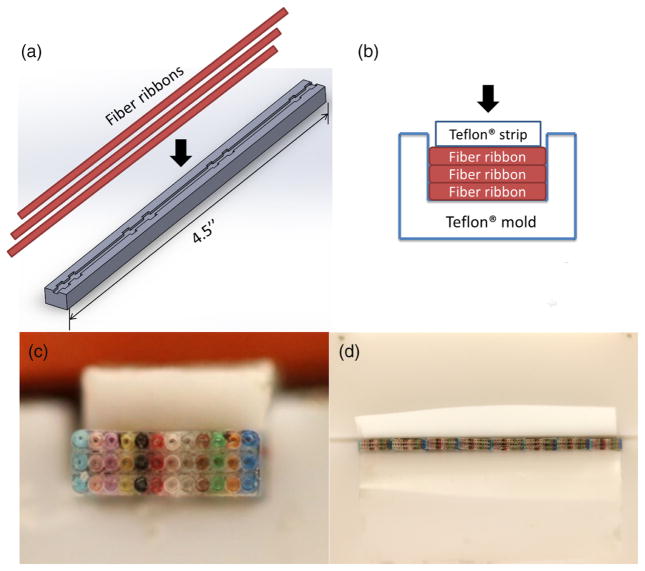
Fiber bundles were manufactured in batches, using custom made teflon forms. Three 4.5-in.-long fiber ribbons were first stacked in a custom mold shown in Fig. 5(a). Epoxy (Yellow Double/Bubble® machineable fast setting epoxy adhesive) was applied between the layers. The mold was made of Teflon® polytetrafluoroethylene which is nonadhesive to epoxy. A mechanical clamp (not shown) was used to compress layers of individual fibers during the gluing process. A custom made teflon strip was placed between clamp and fibers to evenly distribute the compressive load, see Figs. 5(b) and 5(c) for details. In this way, a firm and a solid three-layer group of 12 × 3 fibers was formed. Next, eight such groups were put together side by side in a larger mold, and the gluing process was repeated, yielding a 96 × 3 fiber bundle group [Fig. 5(d)].
Fig. 5.
(a) Assembly process of a fiber bundle. First, three 4.5-in.-long fiber ribbons were stacked in a custom mold. (b) In the second step, epoxy was applied between the layers and a custom made teflon strip was put on top of the fiber ribbons and squeezed downward by a clamp. (c) Photograph of a three-layer fiber bundle mounted in the moldis presented. (d) Eight groups of fibers put together side by side in a larger mold during gluing process of a 96 × 3 bundle are depicted.
3.2.2 Laser cutting
To ensure repeatable fiber lengths necessary for successful assembly, we decided to utilize a laser cutter to cut the fibers to the length. The laser cutter x and y positioning repeatability is below 10 μm, and it was deemed acceptable for our purposes. Since a laser cutter can only process materials that are a few millimeters in height, and this dimension is primarily dictated by the NA of the focusing lens, this constraint was taken into account during assembly of the fiber bundle.
3.2.3 Assembly of the complete fiber bundle
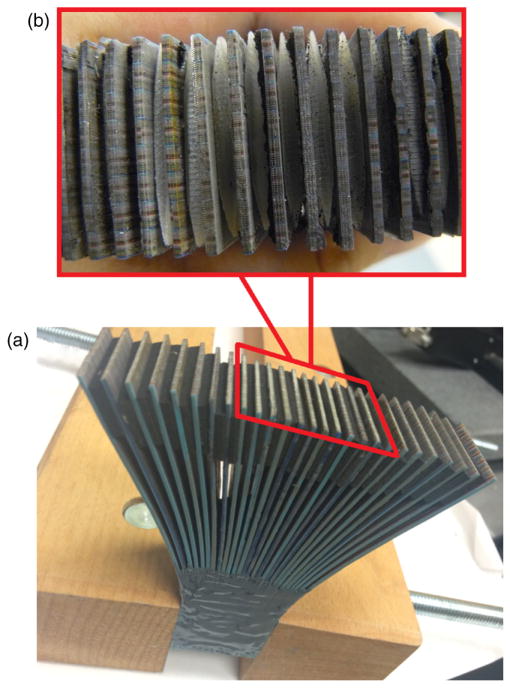
After fabricating 27 of these 96 × 3 fiber groups, epoxy was applied between groups at the input side to fix the relative position of those fibers. Additional glue was applied immediately around the input end for reinforcement. Next, the output ends were separated by spacers inserted between groups of fiber bundles [Fig. 6(a)]. In order to create an even distribution of fibers, we used a set of 3-D-printed solid spacers [Fig. 6(b)], made on a ProJet™ SD 3000 3-D printer with a thickness tolerance of 0.032 mm. The orientation of the fibers at the output end was designed to be parallel to the optical axis. However, due to the limitation of the fabrication technique, they are diverging outward, which may result in light loss at the edge of the field. Therefore, we performed a flat-field correction before image reconstruction to cancel out this effect.
Fig. 6.
(a) Photograph of the completed fiber bundle and (b) a set of 3-D-printed solid spacers inserted between fiber groups.
3.2.4 Polishing fiber bundle ends
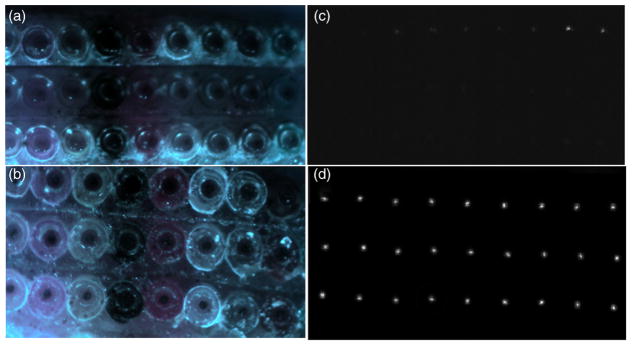
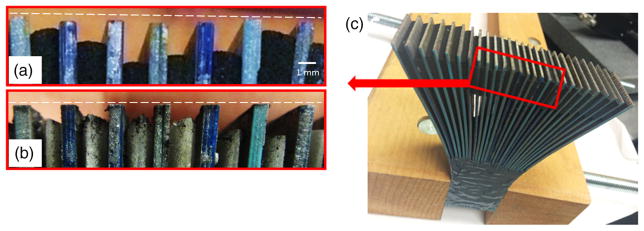
Figure 7(a) shows a micrograph of one fiber bundle end surface after laser cutting. During the cutting process, due to differences in material melting point temperature, the plastic coating of the cores evaporates faster than the cladding, leaving the glass cores protruding outward. Debris and ash from the melted material also accumulates at the end surfaces and contributes to the attenuation of the transmitted signal. To improve system throughput, we polished both ends of the fiber bundle on an automatic polisher (nanopol fiber polishing system, Ultra-Tec®) using a sequence of pads; 12-μm silicon carbide pads for 10 min, followed by 1-μm silicon carbide for 10 min, and finally 0.1-μm diamond pads for 10 min. The micrograph in Fig. 7(b) shows one of the polished ends of the fiber bundle, demonstrating a planar end face free of debris. Figures 7(c) and 7(d) show the output end of the fiber bundle with uniform broadband illumination presented at the input side, before and after the polishing process, respectively. To examine the fiber-core end surface quality after polishing, we measured the polished fiber cores using a Zygo® white-light interferometer. The surface quality (represented by Ra) was measured to be 11.541 nm. Figure 8(a) shows a portion of one fiber bundle end before polishing (the white dotted line represents the position of the image taper). It can be seen that the location of the fiber ends does not coincide with the input face of the image taper, which may result in signal decoupling and a defocused representation of the fibers ends on the image sensor. We have experimentally verified that the distance between the fiber bundle’s output end face and the image taper’s input face should not exceed 50 μm in order to avoid signal loss and image blur. Figure 8(b) shows the fiber bundle output face after the polishing process, with the white dotted line again denoting the location of the glass taper’s input face. Note that the output faces of all fiber bundle groups now coincide with the white-dotted line, indicating satisfactory surface flatness.
Fig. 7.
(a) Micrograph of a fiber bundle end face after laser cutting, before polishing. The glass cores protrude outward and with debris and ash from the melted material accumulating at the end surfaces. (b) Polished ends of the fiber bundle with a planar end face and absence of debris. Micrograph of the output face with the input face of the bundle evenly illuminated by a broadband light source, (c) before and (d) after polishing.
Fig. 8.
Comparison of the output ends of fiber groups in the bundle (a) before and (b) after polishing. The white dotted line represents the position of the image taper. Before polishing the location of the fiber ends does not coincide with the input face of the image taper. After polishing the output faces of all fiber bundle groups now coincide with the white-dotted line, indicating satisfactory surface flatness. (c) Photo of the completed fiber bundle, showing the position of the zoomed area in (a) and (b).
4 System Calibration and Image Reconstruction
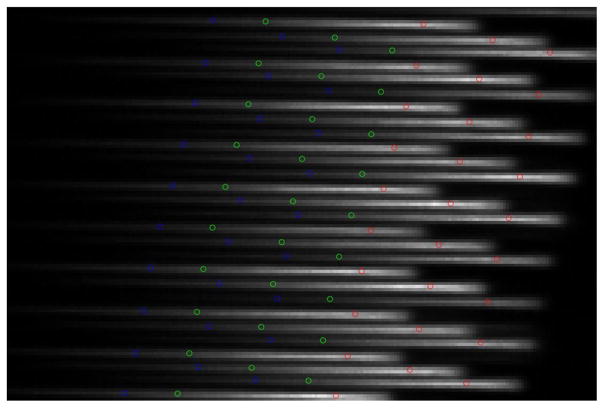
The background of Fig. 9 (without colored dots) shows a portion of the raw flat-field image captured by the CCD detector. Light from individual fiber cores was dispersed into lines, due to the broadband nature of the illumination light source (Zeiss HAL 100). Note that according to our theoretical calculations [Fig. 3(d)], the tilt angle of 13.39 deg allowed us to pack three spectral lines between each fiber-core image. In order to reconstruct the spatial and spectral features of an object, the system needs to be calibrated, and the recorded intensity signal needs to be flat-field corrected to account for fiber coupling nonuniformities and other light losses. The calibration procedure consists of two steps: (1) locating each wavelength on the spectral lines, i.e., spectral calibration and (2) finding the corresponding input fiber positions for each output fiber, i.e., spatial calibration.
Fig. 9.
A portion of the raw flat-field image captured by the CCD detector superimposed by the positions of spot centroids from the 488-, 514.5-, and 632.8-nm filters in the spectral calibration procedure. On the raw flat-field image, light from individual fiber cores was dispersed into lines. For spectral calibration, we used three 1-nm filters to obtain three single-channel flat-field images which are marked with blue (488.0 nm), green (514.5 nm), and red (632.8 nm) dots on the figure.
For spectral calibration, we used three 1-nm wide bandpass filters (centered at 488, 514.5, and 632.8 nm) to obtain three single-channel flat-field images. The evenly illuminated scene observed through narrow band filters forms an image on the detector that looks like a regularly spaced matrix of spots. The position of those spots on the dispersed line (see for example Fig. 9) depends on wavelength. For visualization purposes, in Fig. 9, the centroids of light spots for the 488-, 514.5-, and 632.8-nm filters are marked with blue, green, and red dots, respectively, and are superimposed on the raw signal recorded by the CCD camera. We created a custom algorithm to automatically localize and group each set of three narrow-band spots within their respective dispersion lines. We then used a second-order polynomial function to interpolate the coordinates of these three measured locations to determine the positions of the remaining wavelengths from 400 to 700 nm. The polynomial parameters that bound the physical pixel location with wavelength are the product of system spectral calibration.
Fibers on the input face of the fiber bundle are regularly spaced in both orthogonal directions, creating a regular matrix. As described earlier, on the output side, fibers are organized into 27 groups each consisting of 3 × 96 fibers. In order to provide space for spectral information, 27 groups of fibers were spaced laterally by the introduction of custom 3-D printed inserts. The fiber bundle was also manufactured manually, using custom machined forms. Thus, the spacing between individual fiber ribbons was not perfectly consistent. Since the fiber bundle is the component responsible for the spatial organization of the image on camera, there is a need to determine the spatial relationship between the input and the output fibers in reference to the observed scene. Two sets of gray-scale sinusoidal patterns were used to calibrate the system response in the x- and y-directions. Six sinusoidal patterns were projected for both the x- and y-directions, and for each sinusoidal pattern six phase shifted versions were generated. We analyzed the intensity of the fringe pattern to determine the relative location of each fiber within image space.29 The calibration procedure was repeated twice for the two orthogonal directions.
To reconstruct the single channel images, we collected the intensities for that channel in each of the lines obtained from the spectral calibration results, and remapped them according to the spatial calibration results. A linear interpolation algorithm was used to estimate the values in the void regions. The image reconstruction took about 0.62 s on personal class computer (Intel® Core® i5-4670 CPU at 3.40 GHz) and was performed offline using a dedicated script written in MATLAB. We think that reconstruction time may be shortened to a few milliseconds using the dedicated binary code, rendering live observation of multispectral scenes possible.
5 System Characterization
To evaluate system performance, we tested the light-guide snapshot spectrometer for its overall throughput, crosstalk, spectral resolution, and spatial sampling. The results and methods are outlined in the sections below.
5.1 System Throughput
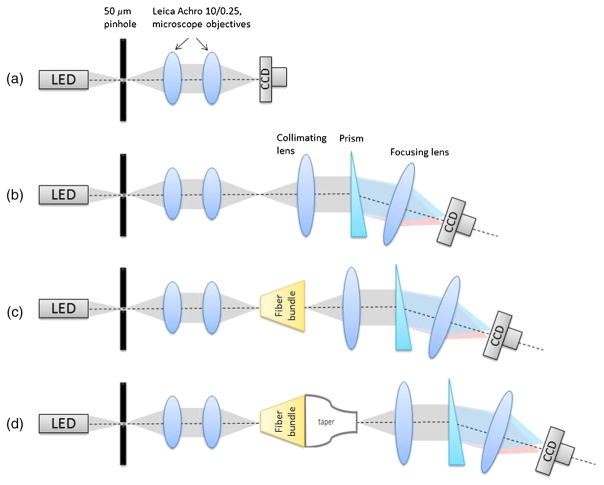
To examine the system’s throughput, we performed a series of measurements using a white light LED (Thorlabs Mounted High Power LED MCWHL2) focused on the 50-μm pinhole. Specific tests included: (1) direct irradiance measurement without light-guide spectrometer system [Fig. 10(a)], (2) throughput of an optical system alone [without fiber bundle and image taper, Fig. 10(b)], (3) throughput of fiber bundle [Fig. 10(c)], and (4) throughput of a fiber bundle and image taper [Fig. 10(d)]. Consecutive tests (2 to 4) were considered to identify the specific contributions of individual components to light losses in reference to measurement 1. In cases 3 and 4, the light coming from the pinhole was coupled into a random fiber of the custom fiber bundle using two microscope objective lenses (Leica Achro 10/0.25, ∞/0.17). A raw image of the illuminated fiber on the system’s CCD detector was acquired, and the total transmitted light was calculated. The obtained value was the sum of the signals at all illuminated camera pixels divided by exposure time. To allow comparison of all configurations and avoid detector saturation, the exposure time was adjusted between experiments. All measurements were repeated five times for five randomly selected fibers to obtain average throughput value. The throughput was defined as a ratio of intensity measured in configurations (2), (3), and (4) with a reference value assessed in configuration (1). Note that ultimately the light-guide spectrometer is intended to work using components (2) and (3). In the future, we do not plan to use an image taper in the spectrometer system as it is an expensive component requiring realignment for various bundle settings. Here, it was used to allow application of available optics. After analyzing the results, it appeared that commercially imaging optics was responsible for 39.50% light loss (60.50% light throughput), whereas the custom fabricated fiber bundle was responsible for 29.59% of light loss (70.41% throughput). The overall system throughput in configuration (3) was 42.60%. These findings are important as they suggest that in the ultimate spectrometer configuration it will be possible to obtain high-light throughput. Major improvements can be achieved with dedicated high throughput lenses and better quality of bundle front surfaces. The loss caused by image taper appeared to be most significant (1.4% light throughput). As mentioned above, in the future, an image taper will not be used in the optical train of the light-guide spectrometer. We have used it in this paper in order to construct optical system of the spectrometer from optical components available in the laboratory, which otherwise will have unmatched image/object dimensions, prohibiting unobstructed propagation of light.
Fig. 10.
A series of system throughput measurements: (a) direct irradiance of the detector through a 50-μm pinhole; (b) throughput measurement of an optical system alone without the fiber bundle and the image taper; (c) throughput measurement with the fiber bundle in the optical train; (d) throughput of the fully assembled experimental setup.
5.2 Spatial Sampling Versus Spatial Resolution
The system spatial sampling is limited by the fiber bundle front end. The fiber-core diameter in the fiber bundle is 62.5 μm. The core–core distance is 250 μm in the x-direction and 350 μm in the y-direction, which results in a spatial resolution of 2 LP/mm in the x-direction and 1.43 LP/mm in the y-direction. However, the system’s actual spatial resolution changes with the optical relay system’s magnification ratio (9× in the current system) and quality of optics. In demonstrated results, the system was fiber bundle limited rather than limited by imaging optics. Therefore, the final spatial resolution can be improved by adding different optical coupling systems.
5.3 Spectral Resolution
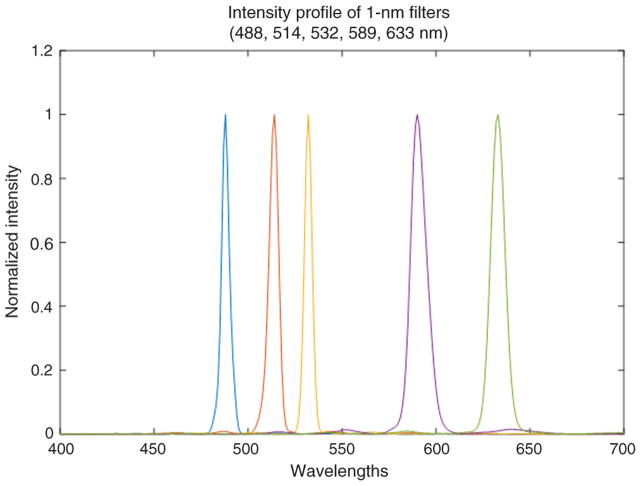
In general, the spectral resolution depends on optical system point spread function, pixel size, dispersive properties of the optical train, and overall sampling of the imaging spectrometer. Therefore, to assess spectral resolution of the spectrometer, we acquired a series of images using five 1-nm filters centered at 488, 514, 532, 589, and 633 nm wavelengths. The combination of broadband illumination and narrow band interference filters resulted in an acquired image that a resembled regular matrix of Gaussian-like disks. For each filter, we have evaluated an arbitrarily selected series of the intensity profile. The average full-width half maximum of intensity cross section was measured for each filter, and this value scaled in the physical unit of length was considered the resolution for that respective wavelength. Because dispersion of the prism utilized in the system changes nonlinearly with the wavelength, we have repeated measurements for five wavelengths. Since optical resolution also depends on wavelength as a consequence, the spectral resolution varied with wavenumbers. The low dispersion for longer wavelengths resulted in lower spectral sampling as the point spread function diameter increased linearly with the wavelength. Arbitrarilt selected intensity profiles for five filters are shown in Fig. 11. Note that measurements across different field locations allowed assessing the variation of intensity profile across the image and are reflected in the provided deviations from the average value of FWHM listed in Table 1.
Fig. 11.
The spectral response of filters at 488, 514, 532, 589, and 633 nm.
Table 1.
Spectral resolution of light-guide spectrometer at 488, 514, 532, 589, and 633 nm.
| Narrowband filter (nm) | 488 | 514 | 532 | 589 | 633 |
|---|---|---|---|---|---|
| Average of FWHM ± STD across FOV (nm) | 4.79 ± 1.61 | 4.52 ± 0.83 | 5.03 ± 0.58 | 6.88 ± 0.74 | 8.73 ± 1.24 |
5.4 Spectral Crosstalk
The crosstalk was analyzed in two aspects: (a) fiber to fiber (in the image guide) and (b) spectral crosstalk at the image plane (CCD plane) between adjacent dispersed spatial points. In configuration (a), no detectable crosstalk was recorded. This is most likely due to the fact that in light-guide imaging spectrometer fibers are optically separated by the core–core distance of 250 μm while the fiber-core diameter is 62.5 μm. Therefore, the crosstalk caused by light leakage in neighboring fibers is negligible. In case (b), however, we could observe crosstalk between signals from neighboring spatial locations. The design itself (core separation, disperser tilt, ribbon spacers) was performed to eliminate crosstalk effects (spacing was expected to be sufficient to obtain crosstalk below 1%). Due to manufacturing imperfections of the custom bundles, individual fibers were not uniformly distributed. As a result, after dispersion, the lines were not evenly distributed in the void space between fibers. To quantify crosstalk, we illuminated a random fiber and obtained the raw image on the detector. The measurement was repeated five times at different field locations. Using the phase-shifting spatial calibration (as described in Sec. 4), we were able to bind pixels on the detector with fibers. Therefore, we summed the intensity recorded by the detector in the neighborhood of the image of the illuminated fiber and divided it by the sum of the intensity recorded at the location of the image of the illuminated fiber. We defined this ratio as the system crosstalk. The average crosstalk was found to be 6.65% with a standard deviation of 2.43%. The crosstalk was obtained as a global value for white light illumination. In other words, it means that we analyzed overall leakage between spectral distributions from neighboring spatial locations. More detailed analysis will be performed in the future on spectral values with the most significant crosstalk and wavelengths affected at different spatial points.
6 Imaging Results
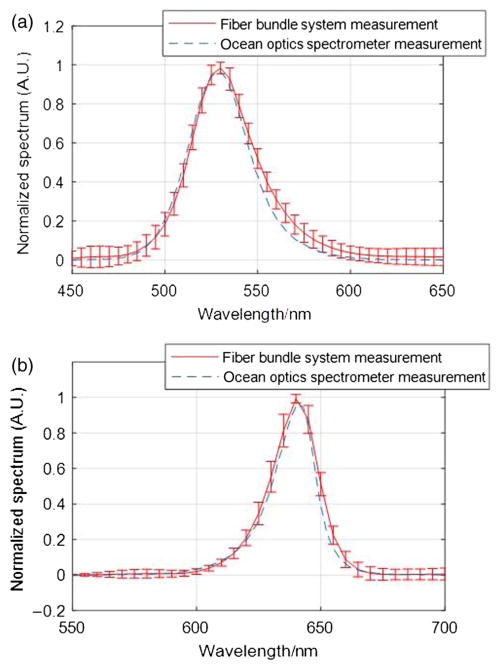
To examine the system performance, first, we measured the emission spectra of two LEDs (Thorlabs Mounted High Power LED M530L3 and M625L3) with the light-guide snapshot spectrometer. We illuminated the whole fiber bundle input end with each of these LEDs in turn, averaged the measured spectrum from all fibers, and plotted the results. The error bars represent the standard deviation of the intensity measured over all individual fibers. Each LED’s output spectrum was also measured with an ocean optics modular spectrometer to provide reference data. We interpolated the data measured by the light-guide spectrometer using Gaussian functions and then overlapped it with the ocean optics modular spectrometer measurement presented in Fig. 12. The differences in the interpolated peak and the peak measured by the reference spectrometer are below 5 nm, which is less than the as-designed resolution of the light-guide system.
Fig. 12.
(a) Comparison of the emission spectrum of a M530L3 LED measured by the light-guide snapshot spectrometer system (red line with error bars) and an ocean optics spectrometer (dotted line). (b) Comparison of the emission spectrum of a M625L3 LED measured by the light-guide snapshot spectrometer system (red line with error bars) and an ocean optics spectrometer (dotted line).
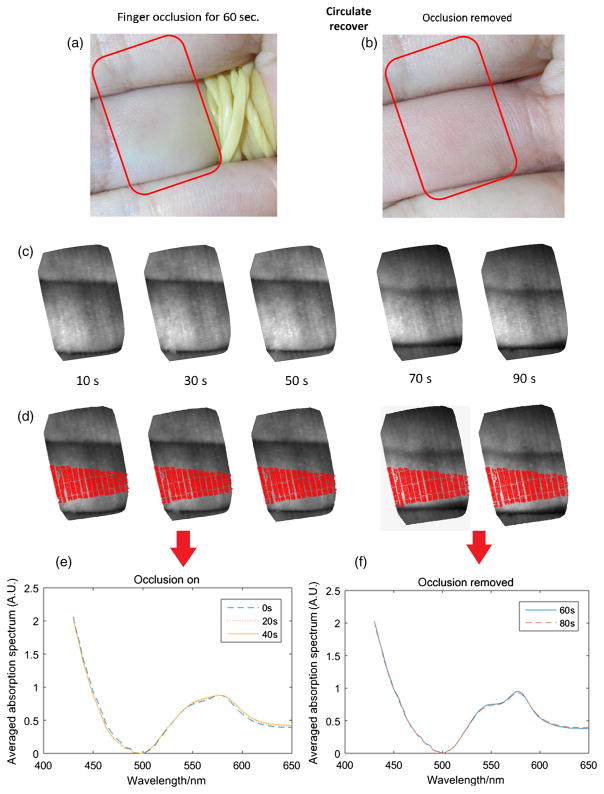
We next measured the oxygen saturation level in an in vivo arterial finger occlusion experiment (under a Rice University IRB-approved study protocol) using our prototype system. Initially, an artery in one finger is occluded with a rubber band, as shown in Fig. 13(a) (RGB reference camera image). After starting the occlusion, images were taken by the fiber bundle system at 10, 30, 50, 70, and 90 s with an exposure time around 0.2 s. The rubber band was removed at the 60-s time point [Fig. 13(b)], resulting in the first three images (10, 30, and 50 s) capturing data from the occluded finger, with the last two images (70 and 90 s) capturing the circulation recovery. Figure 13(c) shows the reconstructed single channel image (600-nm wavelength) from our imaging spectrometer. The area imaged by the fiber bundle is indicated by the red rectangle in Figs. 13(a) and 13(b), where the occluded finger is in the center of the fiber bundle images.
Fig. 13.
Illustration of the finger occlusion experiment. (a) The artery in one finger is occluded with a rubber band (RGB reference camera image). The area imaged by the fiber bundle is indicated by the red rectangle. (b) The rubber band was removed after 60 s. (c) Reconstructed single channel image (600-nm wavelength) from our imaging spectrometer at 10, 30, 50, 70, and 90 s. (d) The red area indicates the central area where the averaged absorption spectra were calculated. (e) The calculated average spectrum of the occluded finger (10, 30, and 50 s). (f) The calculated average spectrum of the finger after occlusion removal (70 and 90 s).
We determined the absorption spectrum for every pixel in the image and then used these data to calculate the mean absorption spectrum over the central area of the occluded finger, using pixels marked in red in Fig. 13(d). For the first three images where the artery was occluded, an absorption peak between 550 and 600 nm is apparent in the mean spectrum [Fig. 13(e)], characteristic of deoxy-hemoglobin. For the last two images which correspond to the circulation recovery phase [Fig. 13(f)], the measured mean spectra exhibit the characteristic oxy-hemoglobin peaks at 540 and 580 nm, respectively.
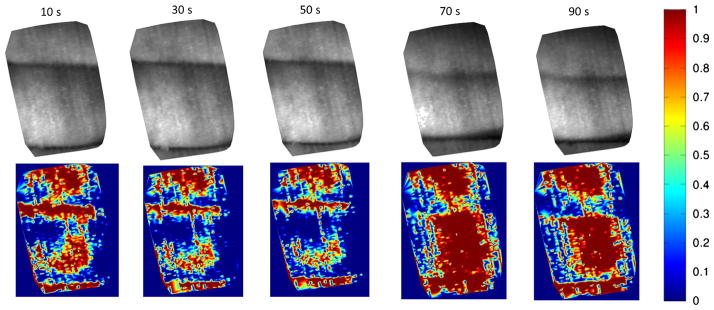
We used the mean spectra measured at 50 and 70 s as “standard spectra” for deoxy-hemoglobin [HbO2] and oxy-hemoglobin [Hb], respectively, and subsequently performed linear spectral unmixing30,31 for each pixel in these images. This unmixing process is based on the assumption that for each individual pixel, the measured absorption spectrum is a linear superposition of contributions from the deoxy-hemoglobin spectrum [HbO2] and the oxy-hemoglobin spectrum [Hb]:
where X is the measured absorption spectrum, and A1, A2 are the proportions of oxy-hemoglobin [HbO2] and deoxy-hemoglobin [Hb] absorption spectra. For each pixel, we calculated A1 and A2 for each pixel in the images acquired at 0, 20, 40, 60, 80 s using nonnegative least-squares curve fitting in MATLAB. The result revealed the proportions of oxy- and deoxy-hemoglobin “standard spectra” at each pixel. We then used the oxy-hemoglobin proportion A1/(A1 + A2) as an indicator of oxygen saturation and formed separate color-mapped O2 saturation images (Fig. 14). For the first three images, the saturation value fades with increasing time, indicating a gradually decreasing tissue oxygen level. For the last two images (after the occlusion was released), the oxygen saturation value displayed a sudden rapid increase and then a slight decay, consistent with the typical recovery process of blood circulation and oxygenation.
Fig. 14.
Color-mapped O2 saturation images reflecting the finger oxygen saturation changes during the occlusion experiment. For the first three images, the saturation value fades with increasing time. For the last two images, the oxygen saturation value displayed a sudden rapid increase and then a slight decay.
7 Conclusions and Discussions
In conclusion, we have presented a prototype fiber-based snapshot spectrometer that offers an unprecedented density of spatial sampling in the object space. Due to the exclusive use of optical fibers in reimaging optics of the snapshot imaging spectrometer, we benefited from an added degree of flexibility at the design stage of the optomechanical layout. The ability to arbitrarily reorganize fibers input/output configurations provides us with the capacity to construct the spatial-spectrally tunable system. The flexibility and compactness of reimaging optics built from fiber ribbons allow construction of an optomechanically compact system that can be robust to environmental conditions. We have described the fabrication process, the prototype system setup, and the calibration procedure in detail. We have demonstrated the ability of this system to capture spectral images in a finger occlusion experiment, identifying temporal changes in tissue oxygen saturation. The spatial sampling density in our current fiber bundle configuration is 96 × 81. In our current experiment, only 96 × 42 fibers were utilized because of the available image taper diameter, but future experiments will extend that range by using a larger taper.
For proof of concept, we built the fiber bundle with a spatial sampling density of 96 × 81. However, with a more efficient way of packing individual fibers, the system can be scaled to larger formats with higher spatial sampling and could potentially be integrated into a more compact format. Note that in our current system, the selected output fiber design with three rows per group [Fig. 3(b)] is based on the configuration of the commercially available fiber ribbon (62.5 core size, 250-μm core distance). In the future, a more compact fiber bundle with closer cores will not only improve the system throughput but also enable the output design to be one row per group, which could eliminate the crosstalk (described in Sec. 5.3) between nonadjacent voxels in the datacube.
In the next step, we will add spatial and spectral sampling tunability into the system by changing the gap between fiber groups. This adjustment results in a trade-off between spatial and spectral sampling. Based on different resolution requirements, the imaging area for the system could be tuned with the spectral resolution ranging from 15 to 3.5 nm. In this work, we had difficulty tuning the gap area because the prototype fiber bundle used here was only 4-in. long. When the fiber groups are compressed, the groups at the edge stick out, causing a concave output plane which is incompatible with the image taper. In the future, we plan to use longer fibers with semielastic adhesive to gain more control over position of the fibers. Also, longer fibers would likely make this curvature of the output end negligible. Furthermore, with a long-fiber bundle and a taper with smaller output size, the system can be minimized in size and developed as a hand-held snapshot spectrometer. It also has potential to be incorporated into a snapshot OCT system.32–34
Acknowledgments
We would like to acknowledge funding from the National Institutes of Health, NIBIB (No. R21 EB016832) as well as the Cancer Prevention and Research Institute of Texas (CPRIT) under Award No. RP130412. We would like to thank Dr. Thuc-Uyen Nguyen, for her preliminary exploration in the fiber bundle fabrication process. We would also like to thank Dr. Mark Pierce for valuable input and advice for writing this paper and also Jason Dwight for helpful discussions and help in MATLAB reconstruction codes.
Biographies
Ye Wang received her BS degree in physics from Nanjing University in 2013. She is currently a fourth-year PhD student of applied physics at Rice University and is now a research assistant working in the Laboratory of Tomasz Tkaczyk. Her research interests include fiber-based spectroscopy, optical design and fabrication, and biomedical imaging.
Michal E. Pawlowski received his MSc Eng degree in applied optics and his PhD from Warsaw University of Technology in 1997 and 2002, respectively. He was a postdoctoral student at the University of Electro-Communications, Tokyo, Japan, between 2003 and 2005. Currently, he works at Rice University as a research scientist. His main interests are applied optics, optical design, and bioengineering.
Tomasz S. Tkaczyk received his MS and PhD degrees from the Institute of Micromechanics and Photonics, Warsaw University of Technology. He is an associate professor of bioengineering and electrical and computer engineering at Rice University. His research is in microscopy, endoscopy, cost-effective high-performance optics for diagnostics, and snapshot imaging systems. In 2003, he began working as a research professor at the College of Optical Sciences, University of Arizona. He joined Rice University in 2007.
References
- 1.Gao L, Wang LV. A review of snapshot multidimensional optical imaging: measuring photon tags in parallel. Phys Rep. 2016;616:1–37. doi: 10.1016/j.physrep.2015.12.004. [DOI] [PMC free article] [PubMed] [Google Scholar]
- 2.Hagen N, Kudenov MW. Review of snapshot spectral imaging technologies. Opt Eng. 2013;52(9):090901. [Google Scholar]
- 3.Lu G, Fei B. Medical hyperspectral imaging: a review. J Biomed Opt. 2014;19(1):010901. doi: 10.1117/1.JBO.19.1.010901. [DOI] [PMC free article] [PubMed] [Google Scholar]
- 4.Gao L, Smith RT. Optical hyperspectral imaging in microscopy and spectroscopy—a review of data acquisition. J Biophotonics. 2015;8(6):441–456. doi: 10.1002/jbio.201400051. [DOI] [PMC free article] [PubMed] [Google Scholar]
- 5.Wagadarikar A, et al. Single disperser design for coded aperture snapshot spectral imaging. Appl Opt. 2008;47(10):B44–B51. doi: 10.1364/ao.47.000b44. [DOI] [PubMed] [Google Scholar]
- 6.Okamoto T, Yamaguchi I. Simultaneous acquisition of spectral image information. Opt Lett. 1991;16(16):1277–1279. doi: 10.1364/ol.16.001277. [DOI] [PubMed] [Google Scholar]
- 7.Kudenov MW, Dereniak EL. Compact real-time birefringent imaging spectrometer. Opt Express. 2012;20(16):17973–17986. doi: 10.1364/OE.20.017973. [DOI] [PubMed] [Google Scholar]
- 8.Kudenov MW, et al. White-light Sagnac interferometer for snapshot multispectral imaging. Appl Opt. 2010;49(21):4067–4076. doi: 10.1364/AO.49.004067. [DOI] [PubMed] [Google Scholar]
- 9.Harvey AR, Fletcher-Holmes DW. High-throughput snapshot spectral imaging in two dimensions. Proc SPIE. 2003;4959:46. [Google Scholar]
- 10.Gao L, Kester RT, Tkaczyk TS. Compact image slicing spectrometer (ISS) for hyperspectral fluorescence microscopy. Opt Express. 2009;17(15):12293–12308. doi: 10.1364/oe.17.012293. [DOI] [PMC free article] [PubMed] [Google Scholar]
- 11.Gao L, Kester RT, Tkaczyk TS. Biomedical Optics and 3-D Imaging. BMD8. Optical Society of America; 2010. Snapshot image mapping spectrometer (IMS) for hyperspectral fluorescence microscopy. [Google Scholar]
- 12.Gao L, et al. Snapshot image mapping spectrometer (IMS) with high sampling density for hyperspectral microscopy. Opt Express. 2010;18(14):14330–14344. doi: 10.1364/OE.18.014330. [DOI] [PMC free article] [PubMed] [Google Scholar]
- 13.Bedard N, et al. Image mapping spectrometry: calibration and characterization. Opt Eng. 2012;51(11):111711. doi: 10.1117/1.OE.51.11.111711. [DOI] [PMC free article] [PubMed] [Google Scholar]
- 14.Bodkin A, et al. Snapshot hyperspectral imaging: the hyperpixel array camera. Proc SPIE. 2009;7334:73340H. [Google Scholar]
- 15.George TC, et al. Distinguishing modes of cell death using the ImageStream® multispectral imaging flow cytometer. Cytometry. 2004;59(2):237–245. doi: 10.1002/cyto.a.20048. [DOI] [PubMed] [Google Scholar]
- 16.Levoy M, et al. Light field microscopy. ACM Trans Graph. 2006;25(3):924–934. [Google Scholar]
- 17.Fletcher-Holmes DW, Harvey AR. Real-time imaging with a hyperspectral fovea. J Opt A: Pure Appl Opt. 2005;7(6):S298. [Google Scholar]
- 18.Bedard N, Tkaczyk TS. Snapshot spectrally encoded fluorescence imaging through a fiber bundle. J Biomed Opt. 2012;17(8):080508. doi: 10.1117/1.JBO.17.8.080508. [DOI] [PMC free article] [PubMed] [Google Scholar]
- 19.Bodkin A, et al. Video-rate chemical identification and visualization with snapshot hyperspectral imaging. Proc SPIE. 2012;8374:83740C. [Google Scholar]
- 20.Khoobehi B, Khoobehi A, Fournier P. Snapshot hyperspectral imaging to measure oxygen saturation in the retina using fiber bundle and multi-slit spectrometer. Proc SPIE. 2012;8229:82291E. [Google Scholar]
- 21.Khoobehi B, et al. A new snapshot hyperspectral imaging system to image optic nerve head tissue. Acta Ophthalmol. 2014;92(3):e241. doi: 10.1111/aos.12288. [DOI] [PubMed] [Google Scholar]
- 22.Kriesel J, et al. Snapshot hyperspectral fovea vision system (HyperVideo) Proc SPIE. 2012;8390:83900T. [Google Scholar]
- 23.Gat N, et al. Development of four-dimensional imaging spectrometers (4D-IS) Proc SPIE. 2006;6302:63020M. [Google Scholar]
- 24.Courtes G, et al. Instrumentation for Ground-Based Optical Astronomy. Springer; New York: 1988. A new device for faint objects high resolution imagery and bidimensional spectrography; pp. 266–274. [Google Scholar]
- 25.Pogue BW. Optics in the molecular imaging race. Opt Photonics News. 2015;26(9):24–31. [Google Scholar]
- 26.Mansur DJ, Dupuis JR, Vaillancourt R. Fiber optic snapshot hyperspectral imager. Proc SPIE. 2012;8360:836007. [Google Scholar]
- 27.Komiyama A, Hashimoto M. Crosstalk and mode coupling between cores of image fibres. Electron Lett. 1989;25(16):1101–1103. [Google Scholar]
- 28.Wang Y, Pawlowski ME, Tkaczyk TS. Light-guide snapshot spectrometer for biomedical applications. Proc SPIE. 2016;9711:97111J. [Google Scholar]
- 29.Malacara D, editor. Optical Shop Testing. Vol. 59. John Wiley & Sons; 2007. Chapter 14. [Google Scholar]
- 30.Dickinson ME, et al. Multi-spectral imaging and linear unmixing add a whole new dimension to laser scanning fluorescence microscopy. Biotechniques. 2001;31(6):1272–1279. doi: 10.2144/01316bt01. [DOI] [PubMed] [Google Scholar]
- 31.Keshava N, Mustard JF. Spectral unmixing. IEEE Signal Process Mag. 2002;19(1):44–57. [Google Scholar]
- 32.Nguyen TU, et al. Snapshot 3D optical coherence tomography system using image mapping spectrometry. Opt Express. 2013;21(11):13758–13772. doi: 10.1364/OE.21.013758. [DOI] [PMC free article] [PubMed] [Google Scholar]
- 33.Xie T, et al. Fiber-optic-bundle-based optical coherence tomography. Opt Lett. 2005;30(14):1803–1805. doi: 10.1364/ol.30.001803. [DOI] [PubMed] [Google Scholar]
- 34.Nguyen T-U. Doctoral dissertation. Rice University; 2014. Development of hyperspectral imagers for snapshot optical coherence tomography. [Google Scholar]


