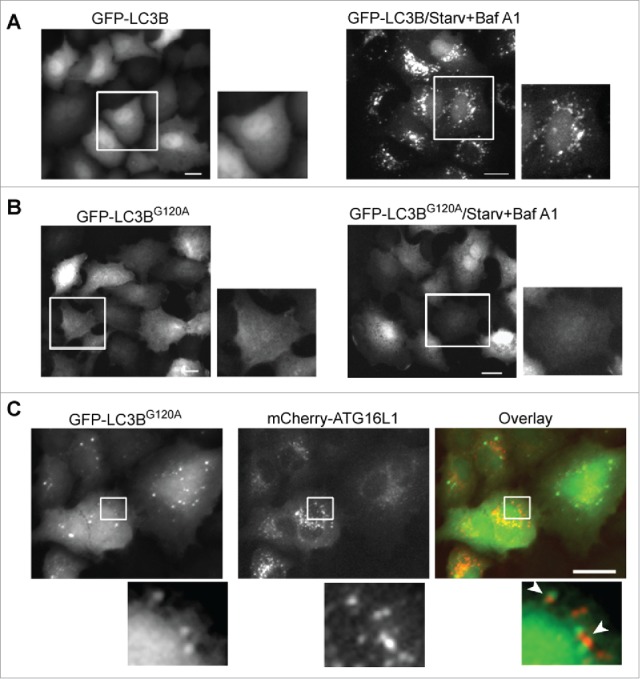
Figure 5.

GFP-LC3B puncta represent protein aggregates in cells overexpressing ATG16L1. (A) A549 cells were infected with Ad-GFP-LC3B vector (MOI 2) for 16 h (left). Cells were then starved in EBSS with bafilomycin A1 (100 nM) for 2 h (right). (B) A549 cells were infected with Ad-GFP-LC3BG120A vector (MOI 2) for 16 h (left). Cells were then starved in EBSS with bafilomycin A1 (100 nM) for 2 h (right). (C) A549 cells were co-infected with Ad-mCherry-ATG16L1 and Ad-GFP-LC3BG120A at MOI 2 for 16 h. Boxed areas are enlarged to show the association between GFP-LC3BG120A puncta and mCherry-ATG16L1 puncta. Scale bar: 25 micron.
