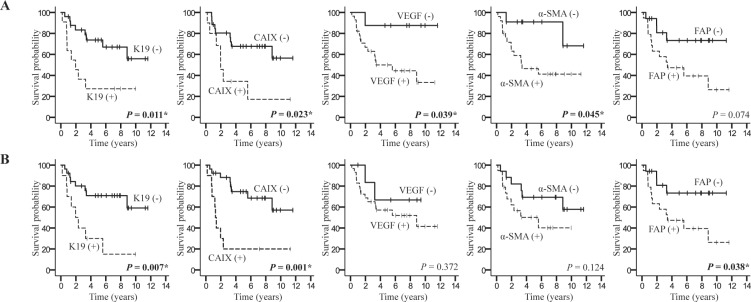
Figure 3.
Kaplan-Meier survival curve representing the overall survival of hepatocellular carcinoma patients according to K19, CAIX, VEGF, α-SMA and FAP expression detected in (A) biopsied and (B) resected HCCs in non-TACE group. Positive expression is indicated by a dotted line, and negative expression is indicated by a solid line. *P < 0.05

