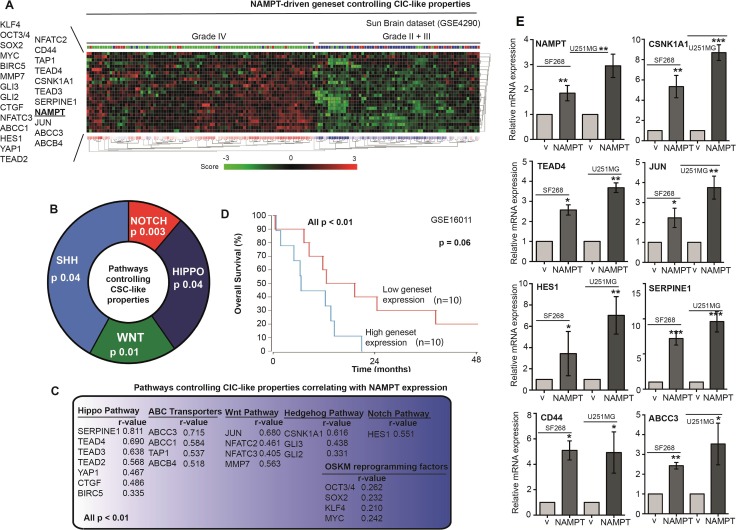
Figure 6. NAMPT induces a gene signature that correlates with glioma tumor grade and predicts poor survival.
(A) R2 expression analysis of the gene signature triggered by NAMPT in the Sun dataset shows a correlation between NAMPT expression and advanced glioma stage: grade IV. R2 expression analysis of the gene signature triggered by NAMPT showed genes related to Stem Cell phenotype. (B) pathways controlling CIC-like propersies related to NAMPT expression. (C) Genes associated to NAMP gene expression [all p < 0.01, Pearson r is shown in each case], and the pathway each gene is associated to. (D) Overall survival probability comparing the patients showing low expression signature vs high expression signature. R2 expression analysis of the gene signature triggered by NAMPT in the Sun Brain tumor database in a biased cohort of patients with high signature expression [n = 10] and low signature expression [n = 10] shows poor survival in patients [p = 0.06 with log-rank analysis]. (E) Analisis of the expression of the different genes of the signature in SF268 and U2521MG expressing NAMPT.

