

Abstract
The placenta is a complex and essential organ composed largely of fetal-derived cells, including several different trophoblast subtypes that work in unison to support nutrient transport to the fetus during pregnancy. Abnormal placental development can lead to pregnancy-associated disorders that often involve metabolic dysfunction. The scope of dysregulated metabolism during placental development may not be fully representative of the in vivo state in defined culture systems, such as cell lines or isolated primary cells. Thus, assessing metabolic function in intact placental tissue would provide a better assessment of placental metabolism. In this study, we describe a methodology for assaying glycolytic function in structurally-intact mouse placental tissue, ex vivo, without culturing or tissue dissociation, that more closely resembles the in vivo state. Additionally, we present data highlighting sex-dependent differences of two mouse strains (C57BL/6 and ICR) in the pre-hypertrophic (E14.5) and hypertrophic (E18.5) placenta. These data establish a foundation for investigation of metabolism throughout gestation and provides a comprehensive assessment of glycolytic function during placental development.
Keywords: placenta, glycolysis, tissue, metabolism, ex vivo, extracellular flux, sexual dimorphism
1. Introduction
The placenta is necessary for fetal development and provides the interface for nutrient, gas, and waste exchange between the mother and fetus [1,2]. It is composed of distinct trophoblast cell types (lineages) that develop during pregnancy [3]. Early embryonic development occurs under low oxygen conditions that support anaerobic glycolysis [4,5]. Under these low oxygen conditions, placental cells are thought to promote glycolysis and suppress mitochondrial metabolism [5–7]. As oxygen availability increases, a shift away from anaerobic glycolysis occurs. The placenta is in a pre-hypertropic state throughout midgestation (E0.5–E16.5) but undergoes a dramatic shift with an overall expansion in volume and increase in nonproliferative growth in the hypertrophic phase as it nears the end of gestation (E16.5-birth) [8–10]. Therefore, effective regulation of placental metabolism is necessary to maintain a healthy pregnancy [11].
Pregnancies with male offspring have been associated with having a greater risk of pregnancy-associated disorders than pregnancies with female offspring, particularly in conditions of nutrient restriction [5,8,9,12–17]. It is believed that this difference between male and female outcomes may be due to the ability of the female placenta to better adapt to environmental influences [6,17,18]. Additionally, in cases where both males and females experience preeclampsia, male placentas exhibit a stronger phenotype, exhibiting higher expression of pro-apoptotic, hypoxic, and pro-inflammatory molecules compared to placentas from their female counterparts [19]. While these studies have identified that placentas from female offspring have a better ability to adapt metabolically, they shed little light on functional differences in male and female placentas under normal conditions.
The energy provided by glycolytic metabolism is important for proper development; however, direct measures of glycolytic function in placental tissue are limited. Current methods to assay glycolysis include: quantifying glucose uptake and lactate production, enzymatic activity at rate-limiting steps, and determination of metabolite levels using mass spectrometry or nuclear magnetic resonance spectrometry [20]. While these methods are effective at measuring glycolytic function, they often require radioactive isotopes, are not conducive to high-throughput analysis, and/or can require substantial amounts of tissue. However, the development and implementation of the extracellular flux analysis has resulted in an automated system capable of assessing metabolic function with minimal sample requirements.
Extracellular flux analysis of isolated primary placental cells and cell lines has recently been used to investigate several aspects of cellular metabolism [21–23]. In monolayer cell culture, extracellular flux analysis is a relatively uncomplicated assay that uses glucose, oligomycin, and 2-deoxy-D-glucose (2-DG) to determine glycolysis, glycolytic capacity, glycolytic reserve, and non-glycolytic proton production rate (PPR). While cultured cells have been used to increase our knowledge of cellular metabolism, assaying glycolysis in intact tissue would provide a more accurate representation of the in vivo state. Additionally, extracellular flux analysis of ex vivo tissue rather than cultured cells, will allow for analysis of different time points in gestation and reduce confounding environmental factors related to primary cell isolation and cell culture. A few reports have adapted extracellular flux analysis to intact tissue; including single skeletal muscle fibers, white adipose tissue, and brain sections; however, these tissues are relatively homogeneous in composition in contrast to the multi-lineage, highly-vascularized placenta [24–27]. In this study, we hypothesized that glycolysis would decrease as gestation progresses, while pregnancy parameters increase with age, regardless of fetal sex or mouse strain.
In this study, we have developed a method to analyze glycolytic parameters in ex vivo tissue of the mouse placenta that retains in utero placental architecture and is representative of in vivo trophoblast lineages. In addition, we have shown that there are few changes in glycolytic parameters based on gestational age or sex; however, there are dramatic differences in pregnancy parameters.
2. Methods
2.1 Institutional Approval
Animals were mated overnight. Females were removed the following morning, checked for a copulation plug, and designated embryonic day 0.5 (E0.5). At the appropriate gestational days, animals were euthanized by CO2 followed by cervical dislocation under a Wright State University IACUC approved protocol. Ex vivo placental tissues were collected from ICR and C57BL/6 mice (Charles River) at E14.5 or E18.5.
2.2 Hematoxylin and Eosin Staining (H&E)
For H&E analysis, placentas were isolated and fixed in 4% paraformaldehyde overnight and dehydrated through a series of ethanol washes. Ex vivo placental tissues were subsequently isolated using a 2 mm punch (Integra Miltex, #33–31) and paraffin embedded. 10 μm sections were cut, deparaffinized, rehydrated, and H&E stained using standard procedures [28].
2.3 Quantitative PCR Analysis (qPCR)
Ex vivo placental tissue or whole placentas from E14.5 ICR mice were isolated and placed into RNAlater (Thermo Fisher, AM7020). Tissues were homogenized in Trizol (Thermo Fisher, 15–596–018), and total RNA was isolated using Direct-zol RNA miniprep columns (Zymo Research, R2050). Expression of mRNA was assessed by qPCR using SYBR green, as previously described [29,30]. Briefly, total RNA (1μg) was reverse transcribed using the iScript RT kit for SYBR green and qPCR reactions were then prepared using the iTaq Universal SYBR green supermix (BioRad), according to the manufacturers instructions. Validated primers for Epcam, Gcm1, Syncytin-a (SynA), Prl3b1, and Prl2c2 were obtained from BioRad (BioRad Prime PCR Assays, Table 1). These genes were chosen to represent all trophoblast subtypes present in the different layers of the placenta at E14.5 (decidua, junctional zone, labyrinth), including labyrinth trophoblast progenitors (Epcam), syncytiotrophoblast (Gcm1, Syncytin-a), spongiotrophoblast and trophoblast giant cells (Prl3b1, Prl2c2). Quantitative PCR reactions were conducted in triplicate on equal amounts of each cDNA sample, for each gene, and data was compiled and analyzed using CFX Manager software applying the ΔΔ Cq method and normalized relative to Ppia, Ywhaz, and H2afz [31]. Gene expression was presented as relative expression normalized to multiple reference genes to minimize error in normalization. These reference genes were chosen based on stable expression in both the whole placenta and ex vivo placental tissue samples.
Table 1.
qPCR Primers, ID and Accession Number
| Gene | BioRad ID | Entrez Accession Number |
|---|---|---|
| Epcam | qMmuCED0049724 | 17075 |
| Gcm1 | qMmuCED0045702 | 14531 |
| Syncytin-a | qMmuCED0003216 | 214292 |
| Prl3b1 | qMmuCID0011919 | 18776 |
| Prl2c2 | qMmuCID0041440 | 18811 |
| Ppia | qMmuCED0041303 | 268373 |
| Ywhaz | qMmuCED0027504 | 22631 |
| H2afz | qMmuCED0040907 | 51788 |
2.4 Analysis of Glycolytic Function
Glucose (G8270), oligomycin (75351), and 2-DG (D8375) were purchased from Sigma. XF24 Sensor Cartridges (101174-100), XF24 Islet Capture Plates (101122-100), XF24 Microplates (100777-004), XF Base Minimal Media (102353-100), and Glycolysis Stress Test Kit (103020-100) were obtained from Agilent. Lineage-intact, ex vivo placental tissue was isolated using a 2 mm punch (Integra Miltex, #33–31). Ex vivo tissue (2× 2 mm) was weighed, placed into assay media (525 μl, XF Base Minimal Media plus 2.0 mM L-glutamine; untreated) or assay media containing the glycolytic inhibitor, 2-DG (100 mM; treated), where the tissue remained for approximately 30 min while all samples were collected. Tissue was subsequently placed into microwells of an XF24 Islet Capture Plate and secured using mesh screens. The glycolytic assays on ex vivo tissue used sequential injections of 62.5 mM glucose, 10.0 μM oligomycin A, and 100 mM 2-DG. Three measurements were taken at each metabolic condition using a mix/wait/measure protocol of 2/2/2 min. The mouse labyrinthine placental progenitor cell line, SM10, under differentiated conditions, was also assayed for glycolytic rates for comparative analysis. SM10 cells (1×10⁴) were plated on XF24 Microplates and allowed to incubate for 24 h at 37C/5% CO2, and then treated with TGF-β2 (5 ng/ml) for 72 h to induce terminal differentiation [23, 32–34]. SM10 cells were assayed under the similar conditions to ex vivo placental tissue, but with differing drug concentrations: glucose (10 mM), oligomycin A (1.0 μM), and 2-DG (100 mM), as indicated by the manufactures instructions and previously described [23].
2.5 Determination of fetal sex
Fetal sex was determined by analyzing Sry/MyoG gentoypes via genomic PCR. Briefly, genomic DNA was extracted from fetal tissue using the EZNA DNA tissue extraction kit according to the manufacturers directions (Omega, D3396-01). 5 μl of genomic DNA underwent PCR in 50 μl final volume in the presence of 400 nM forward and reverse primers for both Sry and MyoG [35] and 2X ExcellaStart dye Tracker (Worldwide Medical Products, 61071121). PCR conditions were 1 cycle – [94C for 5 min]; 25 cycles – [94C for 5 sec; and 68C for 40 sec]; 1 cycle – [72C for 1 min]; and 4C. Males display bands at 441 bp (Sry) and 245 bp (MyoG). Females display only the MyoG band at 245 bp.
2.6 Statistical Analysis
A mixed effects ANOVA was run for each dependent variable of basal glycolysis, glycolytic capacity, glycolytic reserve, non-glycolytic proton production rate, placental weight, fetal weight, or placental efficiency with sex and time as fixed independent variables. To control for any potential litter effects, the mother of each of the pups was recorded and included in the model as a random effect. P-values for the pairwise comparisons within each ANOVA were adjusted for multiplicity following the methods described by Westfall [36]. The software program SAS version 9.2 (SAS Institute, Inc., Carey, NC) was used for mixed models analyses.
3. Results and Discussion
3.1 Ex vivo tissue retains placental architecture
To confirm that the ex vivo placental tissue retained in vivo placental architecture, punches and placentas at E14.5 were fixed and stained with H&E (Fig. 1A,B). Histological examination of the ex vivo tissue indicated normal placental morphology composed of maternal decidua, junctional zone, labyrinth, and chorionic plate, similar to that of whole placenta (Fig. 1A,B). Ex vivo punches and whole placental tissue were also examined for expression of trophoblast lineage markers using qPCR to confirm that the punches retained the appropriate trophoblast subtypes (Fig. 1C) [29,37]. The presence of the junctional zone was assessed using Prl3b1 (expressed by spongiotrophoblasts and trophoblast giant cells) and Prl2c2 (expressed by trophoblast giant cells) [37]. The genes Gcm1 and SynA confirmed the presence of syncytiotrophoblast in the labyrinth of the placenta [29]. Epcam, a marker of trophoblast progenitor cells that are restricted to the labyrinth, was also confirmed [38]. The ex vivo tissues expressed markers characteristic of all placental lineages examined, indicating that they are representative of the mouse placenta in vivo (Fig. 1C).
Figure 1. Ex vivo Placental Tissue Retains Morphology and Lineages of the Normal Mouse Placenta.

(A) H&E staining of 2 mm ex vivo tissue from ICR E14.5 placenta, indicating representative morphology. (B) H&E staining of whole ICR E14.5 placental tissue, indicating representative morphology. (C) Expression of trophoblast lineage markers Epcam (undifferentiated labyrinth progenitor cells), Gcm1 (labyrinth), SynA (labyrinth), Prl3b1 (spongiotrophoblasts and trophoblast giant cells), and Prl2c2 (trophoblast giant cells) were analyzed using qPCR from whole placenta (black) and 2mm ex vivo tissue (blue). Expression data was analyzed using CFX Manager software, applying the ΔΔ Cq method and normalized relative to Ppia, Ywhaz and H2afz [31]. Data are reported as the average ± SEM. (D) Variability of Proton Production Rates (PPR) in one-2mm punch (1× 2 mm, black) versus two-2 mm punches (2× 2 mm, gray) of ICR E14.5 ex vivo tissue. Data presented are average standard deviations of full glycolytic extracellular flux runs (n=5 animals per group). 2× 2 mm tissue punches (gray) were less variable and produced consistent and repeatable results.
3.2 Optimization of ex vivo tissue for extracellular flux analysis
To adapt extracellular flux analysis to ex vivo placental tissue, different amounts of ex vivo tissue were evaluated to determine the optimal mass of tissue per well. Previous studies have indicated that a 2 mm biopsy was appropriate for use of white adipose tissue in extracellular flux analysis [27]. Initial assays were conducted comparing one versus two - 2 mm biopsies per well. 2× 2 mm tissue punches were found to produce consistent results, with less variability, and were subsequently used throughout the rest to the study (Fig. 1D).
Extracellular flux analysis measures the proton production rate during serial addition of glucose, oligomycin, and 2-DG. Figure 2A is a representative diagram of the extracellular flux glycolytic parameters. Both differentiated SM10 labyrinthine trophoblast cells and 2× 2 mm placental ex vivo tissue displayed similar glycolytic responses to glucose, oligomycin, and 2-DG addition, with ex vivo tissue being normalized to tissue weight (pmol H+/min/mg tissue) and SM10 being normalized to cell number (pmol H+/min) (Fig. 2). This normalization accounts for the difference in y-axis scaling. Glycolytic rate increased with glucose addition, as it is used for glycolytic ATP production. Glycolytic rate further increased upon inhibition of ATP synthase using oligomycin; as oligomycin simulates energetic stress by blocking mitochondrial ATP production (Fig. 2B,C). Both monolayer cells and ex vivo tissue exhibited a decreased glycolytic rate when 2-DG was added to inhibit glycolysis. However, the SM10 cells exhibited a greater decrease upon 2-DG addition than ex vivo tissue, which is most likely due to greater accessibility. Ex vivo tissues and differentiated SM10 labyrinthine trophoblast cells, pre-treated with 2-DG, exhibited lower glycolytic rates than the vehicle-treated, confirming that the measured rates were due to cellular glycolysis (Fig. 2B,C).
Figure 2. Determination of Glycolytic Function in Differentiated Labyrinthine Trophoblast Cells and Murine Ex Vivo Placenta Tissue.
(A) Representative glycolytic function output. (B) Glycolytic function analysis from differentiated SM10 labyrinthine trophoblast cells (n=9), normalized by plated cell number. (C) Glycolytic function of 2× 2 mm E14.5 ICR ex vivo placental tissue (n=32 placentas; 4 pregnancies). Rates were normalized to tissue mass (mg) per well. The data are reported as the average ± SEM. The treatment groups for (B,C) were treated with 2-DG 30 min prior to and subsequently throughout the assay. (D) Breakdown of glycolytic parameters in differentiated SM10 labyrinthine cells (n=9). (E) Breakdown of glycolytic parameters in ex vivo placental tissue (n=32 placentas; 4 pregnancies). Rates were normalized to tissue mass (mg) per well. (A,B) Data are reported as the average ± SEM.
Further evaluation of extracellular flux analysis calculates proton production rates attributed to basal glycolysis, glycolytic capacity, glycolytic reserve, and non-glycolytic proton production. Non-glycolytic proton production is the rate of extracellular proton flux due to cellular processes, other than glycolysis, and is subtracted from the other glycolytic parameters to ensure the rates measured are attributable to glycolysis. Basal glycolysis is the rate of proton production after glucose addition and is considered the normal rate at which the cells will process glucose when glucose is available. Glycolytic capacity is the assumed maximal glycolytic rate upon inhibition of ATP synthase. Glycolytic reserve is a measure of the glycolytic response to increased energy demands. Analysis of these glycolytic parameters resulted in comparable relationships between basal glycolysis, glycolytic capacity, and glycolytic reserve in SM10 cells and ex vivo placental tissue, confirming the adaptation of the extracellular flux analysis from cultured cells to ex vivo tissue (Fig. 2D,E).
3.3 Extracellular flux analysis of pre-hypertrophic and hypertrophic C57BL/6 and ICR mouse placentas
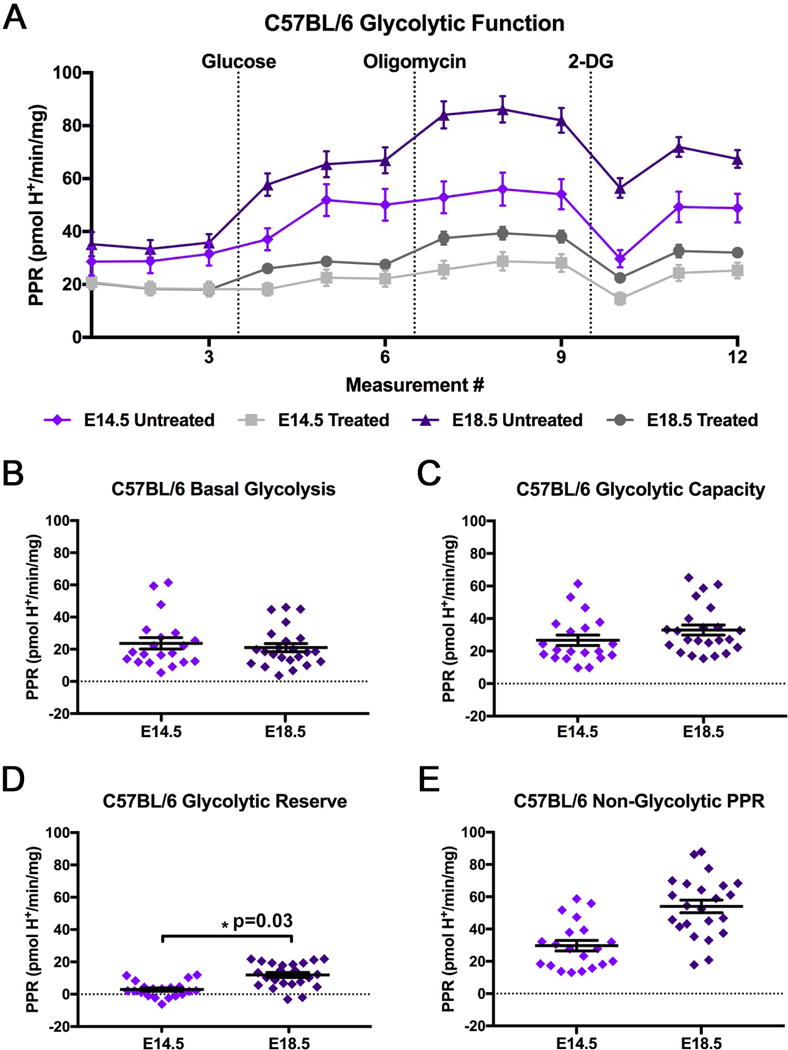
To investigate changes in placental glycolysis from the pre-hypertrophic and during the hypertrophic phases of mouse placental development, placentas from C57BL/6 mice were collected and analyzed at E14.5 (pre-hypertrophic) and E18.5 (hypertrophic). Figure 3A is the representation of C57BL/6 extracellular flux analysis output, where samples were either incubated with 2-DG in assay media (Treated), as a control to ensure viable and reactive tissue was used in the assay, or incubated in assay media alone (Untreated). All comparisons of glycolytic parameters were conducted using untreated ex vivo placental tissue. When comparing the parameters of basal glycolysis, glycolytic capacity, or non-glycolytic proton production rate between C57BL/6 E14.5 and E18.5, no significant differences were identified (Fig. 3A–E). However, C57BL/6 mice at E18.5 had a significantly increased glycolytic reserve compared to E14.5; resulting from a slight, but not significant, increase in glycolytic capacity and decrease in basal glycolysis at E18.5 (Fig. 3D). In addition to the glycolytic parameters; placental weight, fetal weight, and placental efficiency were measured (Fig. 4A–C). C57BL/6 mice had decreased placental weight and increased fetal weight at E18.5 compared to E14.5 (Fig. 4A,B). This decrease in placental weight at E18.5 in C57BL/6 mice was unexpected, but may be in part due to the method of collection in combination with the nature of the near term C57BL/6. The E18.5 C57BL/6 placentas were notably more pliable than the E14.5 C57BL/6 placentas or the ICR placentas at either time point studied. The more pliable nature of the E18.5 C57BL/6 placenta maybe due to increased vascularity and higher rates of blood loss during collection. Additionally, placental efficiency, which is the ratio of fetal weight to placental weight, was analyzed and was significantly increased at E18.5 compared to E14.5 (Fig. 4C) [39–40].
Figure 3. Glycolytic Function of C57BL/6 Ex Vivo Placental Tissue at E14.5 and E18.5.

(A) Glycolytic function of E14.5 and E18.5 C57BL/6 ex vivo placental tissue (E14.5 n=20 placentas from 4 pregnancies; E18.5 n=23 placentas from 4 pregnancies). Rates were normalized to tissue mass (mg) per well. The data are reported as the average ± SEM. The control groups (Treated) were incubated with 100 mM 2-DG 30 min prior to and throughout the assay. Breakdown of glycolytic parameters of (B) basal glycolysis, (C) glycolytic capacity, (D) glycolytic reserve, and (E) non-glycolytic proton production rate comparing C57BL/6 E14.5 and E18.5. Data is presented as average ± SEM.
Figure 4. C57BL/6 Pregnancy Parameters at E14.5 and E18.5.

Breakdown of pregnancy parameters (A) placental weight, (B) fetal weight, and (C) placental efficiency (fetal weight/placental weight) (E14.5 n=20 placentas from 4 pregnancies; E18.5 n=23 placentas from 4 pregnancies). Data is presented as average ± SEM.
In addition to C57BL/6, the commonly used mouse strain, ICR, was investigated for differences in placental glycolytic metabolism and pregnancy parameters at E14.5 and E18.5. Figure 5A is the representation of the extracellular flux analysis output from ICR placentas, where the treated samples were incubated with 2-DG as a control to ensure viable and reactive tissue was used in the assay. No significant differences were found in basal glycolysis (B), glycolytic capacity (C), glycolytic reserve (D), or non-glycolytic proton production rate (E) when comparing E14.5 to E18.5 placentas (Fig. 5). Additionally, no significant differences were found in E14.5 and E18.5 placental weights (Fig. 6A). However, E14.5 ICR fetuses were significantly smaller than E18.5 ICR fetuses and this corresponded to a significantly increased placental efficiency at E18.5 compared to E14.5 (Fig. 6B,C).
Figure 5. Glycolytic Function of ICR Ex Vivo Placental Tissue at E14.5 and E18.5.

(A) Glycolytic function of E14.5 and E18.5 ICR ex vivo placental tissue (E14.5 n=32 placentas from 4 pregnancies; E18.5 n=52 placentas from 6 pregnancies). Rates were normalized to tissue mass (mg) per well. The control groups (Treated) were incubated with 100 mM 2-DG 30 min prior to and throughout the assay. Breakdown of glycolytic parameters of (B) basal glycolysis, (C) glycolytic capacity, (D) glycolytic reserve, and (E) non-glycolytic proton production rate comparing ICR E14.5 and E18.5. Data is presented as average ± SEM.
Figure 6. ICR Pregnancy Parameters at E14.5 and E18.5.

Breakdown of pregnancy parameters (A) placental weight, (B) fetal weight, and (C) placental efficiency (fetal weight/placental weight) (E14.5 n=32 placentas from 4 pregnancies; E18.5 n=52 placentas from 6 pregnancies). Data is presented as average ± SEM.
3.4 Comparative strain analysis of extracellular flux and pregnancy parameters
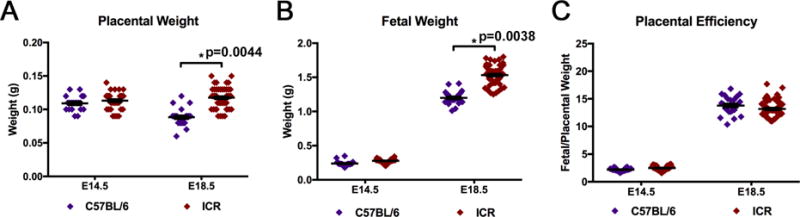
To identify any differences between the C57BL/6 and ICR mouse strains, the glycolytic and pregnancy parameters at E14.5 and E18.5 were compared. Figure 7A is the representation of the extracellular flux analysis output of C57BL/6 and ICR mice at E14.5 and E18.5. The analysis of these data indicated that there were no significant differences across any of the glycolytic parameters of basal glycolysis, glycolytic capacity, glycolytic reserve, or non-glycolytic proton production rate (Fig.7 A–E). When comparing the pregnancy outcomes, the ICR strain had significantly larger placentas and fetuses than C57BL/6 mice at E18.5, but no significant differences at E14.5 (Fig. 8A,B). While differences were found in placental and fetal weights at E18.5 between ICR and C57BL/6 mice, no difference was found in placental efficiency of the strains at either time point (Fig. 8C).
Figure 7. Comparative Analysis of C57BL/6 and ICR Ex Vivo Placental Tissue Glycolytic Function at E14.5 and E18.5.

(A) Glycolytic function of C57BL/6 and ICR ex vivo placental tissue at E14.5 and E18.5 (C57BL/6 E14.5 n=20 placentas from 4 pregnancies; C57BL/6 E18.5 n=23 placentas from 4 pregnancies; ICR E14.5 n=32 placentas from 4 pregnancies; ICR E18.5 n=52 placentas from 6 pregnancies). Rates were normalized to tissue mass (mg) per well. Breakdown of glycolytic parameters of (B) basal glycolysis, (C) glycolytic capacity, (D) glycolytic reserve, and (E) non-glycolytic proton production rate comparing C57BL/6 and ICR at E14.5 and E18.5. The data are reported as the average ± SEM.
Figure 8. Comparative Analysis of C57BL/6 and ICR Pregnancy Parameters at E14.5 and E18.5.

Breakdown of pregnancy parameters (A) placental weight, (B) fetal weight, and (C) placental efficiency (fetal weight/placental weight) (C57BL/6 E14.5 n=20 placentas from 4 pregnancies; C57BL/6 E18.5 n=23 placentas from 4 pregnancies; ICR E14.5 n=32 placentas from 4 pregnancies; ICR E18.5 n=52 placentas from 6 pregnancies). Data is presented as average ± SEM.
3.5 Extracellular flux analysis and pregnancy parameters stratified by sex as a biological variable
Previous studies have indicated that pregnancies with male offspring are more susceptible to adverse pregnancy outcomes [5,8,12–17]. To determine if placentas from male offspring have functional glycolytic differences from female placentas, glycolytic and pregnancy parameters were stratified by fetal sex for data analysis of each mouse strain. Figure 9A is the representation of the extracellular flux analysis output for male and female C57BL/6 mice at E14.5 and E18.5. In C57BL/6 mice, no significant differences were identified between male and female glycolytic parameters of basal glycolysis (B), glycolytic capacity (C), glycolytic reserve (D), or non-glycolytic proton production rate (E) when comparing E14.5 to E18.5 placentas (Fig. 9). However, significant differences were found when investigating pregnancy parameters. In C57BL/6 mice, both male and female placental weights decrease over time and placental efficiency increases over time (Fig. 10A,C). Additionally, male C57BL/6 fetuses and placentas are larger than C57BL/6 female fetuses and placentas near term (E18.5), but there is no significant difference in placental efficiency at either time point (Fig. 10A–C).
Figure 9. Comparative Analysis of Glycolytic Function in Female and Male C57BL/6 Ex Vivo Placental tissue at E14.5 and E18.5.

(A) Glycolytic function of female and male C57BL/6 ex vivo placental tissue at E14.5 and E18.5 (Female E14.5 n=14 placentas from 4 pregnancies; Male E14.5 n=6 placentas from 3 pregnancies; Female E18.5 n=10 placentas from 4 pregnancies; Male E18.5 n=13 placentas from 4 pregnancies). Rates were normalized to tissue mass (mg) per well. Breakdown of glycolytic parameters of (B) basal glycolysis, (C) glycolytic capacity, (D) glycolytic reserve, and (E) non-glycolytic proton production rate comparing female and male C57BL/6 placental tissue at E14.5 and E18.5. The data are reported as the average ± SEM.
Figure 10. Comparative Analysis of Female and Male C57BL/6 Pregnancy Parameters at E14.5 and E18.5.
Breakdown of pregnancy parameters (A) placental weight, (B) fetal weight, and (C) placental efficiency (fetal weight/placental weight) (Female E14.5 n=14 placentas from 4 pregnancies; Male E14.5 n=6 placentas from 3 pregnancies; Female E18.5 n=10 placentas from 4 pregnancies; Male E18.5 n=13 placentas from 4 pregnancies). Data is presented as average ± SEM.
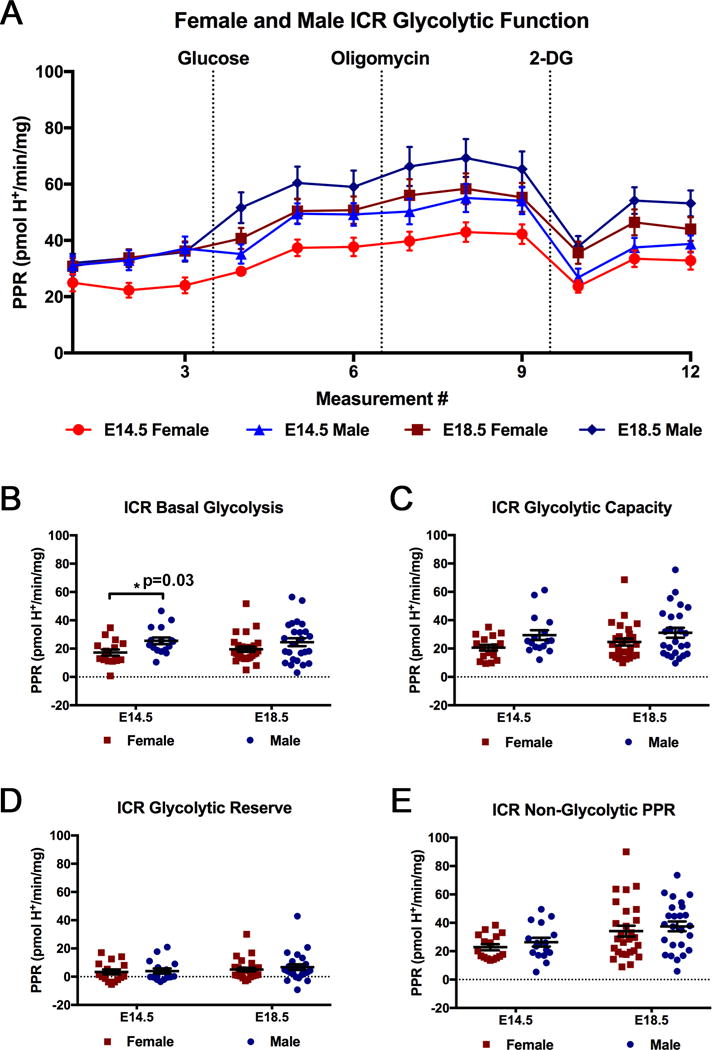
In addition to investigating male and female differences in C57BL/6 mice, differences in glycolytic and pregnancy parameters, based on fetal sex, were investigated in ICR mice. Figure 11A is the representation of the extracellular flux analysis output for male and female ICR mice. No significant differences were observed between male and female ICR placentas at E14.5 and E18.5 for the glycolytic parameters of glycolytic capacity (B), glycolytic reserve (C), and non-glycolytic proton production rate (D) (Fig. 11). However, at E14.5, ICR male placentas exhibited significantly higher rates of basal glycolysis than female placentas, but this difference is no longer significant at E18.5 (Fig. 11B). Additionally, glycolytic capacity followed a trend, similar to basal glycolysis, with a tendency for males to have a higher glycolytic capacity than females at E14.5 (p=0.08, Fig. 11C). Male ICR placentas were also found to be larger than female placentas at both E14.5 and E18.5 (Fig. 12A). In addition to both males and females having increased placental efficiencies at E18.5 compared to E14.5, ICR males had a greater placental efficiency than females at E18.5 (Fig. 12C). Furthermore, ICR male fetuses were found to be larger than ICR female fetuses at E18.5 (Fig. 12B). While this difference in male and female ICR fetal weight is small, a more thorough investigation of each ICR pregnancy collected for this study, using mixed model analysis, more clearly identifies the significant differences between male and female fetal weights. By identifying the average male and female weight per pregnancy, it is apparent that the average male weight is greater than the average female weight (Fig. 12D). While some mothers tended to give birth to heavier pups, within each litter, the males weighed more in all cases.
Figure 11. Comparative Analysis of Glycolytic Function in Female and Male ICR Ex Vivo Placental tissue at E14.5 and E18.5.

(A) Glycolytic function of female and male ICR ex vivo placental tissue at E14.5 and E18.5 (Female E14.5 n=16 placentas from 4 pregnancies; Male E14.5 n=16 placentas from 4 pregnancies; Female E18.5 n=27 placentas from 6 pregnancies; Male E18.5 n=25 placentas from 6 pregnancies). Rates were normalized to tissue mass (mg) per well. Breakdown of glycolytic parameters of (B) basal glycolysis, (C) glycolytic capacity, (D) glycolytic reserve, and (E) non-glycolytic proton production rate comparing female and male ICR placental tissue at E14.5 and E18.5. The data are reported as the average ± SEM.
Figure 12. Comparative Analysis of Female and Male ICR Pregnancy Parameters at E14.5 and E18.5.
Breakdown of pregnancy parameters (A) placental weight, (B) fetal weight, and (C) placental efficiency (fetal weight/placental weight) (Female E14.5 n=16 placentas from 4 pregnancies; Male E14.5 n=16 placentas from 4 pregnancies; Female E18.5 n=27 placentas from 6 pregnancies; Male E18.5 n=25 placentas from 6 pregnancies). Data is presented as average ± SEM. (D) ICR female and male fetal weights at E18.5 from individual pregnancies (ICR number (1–6)). Average fetal weights, by sex, per pregnancy are indicated.
The fetal and placental weight data in the current study parallels a study conducted in Sprague Dawley rats which found that males fetuses were larger at E20 and male placentas larger at E15 and E20, when compared to their female counterparts [8]. In the current study, we found that both ICR and C57BL/6 males had larger placentas and fetuses at E18.5 (Fig. 10A,B; Fig. 12A,B). Furthermore, the study in rats also found that at E15, female Sprague Dawley rats had morphologic differences resolving by E20 [8]. These data correlate with our study in mice, which found that females have lower basal glycolysis at E14.5, while there is no longer a significant difference in basal glycolysis later in pregnancy at E18.5 (Fig. 11B).
4. Conclusion
Our studies have demonstrated that extracellular flux analysis is an effective methodology for assaying glycolytic function in ex vivo mouse placental tissue. Furthermore, our data indicate that ex vivo placental tissue is representative of the in vivo placenta, as demonstrated by histological morphology and characteristic placental lineage analysis. While extracellular flux analysis of trophoblast cells in culture has increased our knowledge of placental cell metabolism, ex vivo analysis more thoroughly represents whole placental metabolism by preserving cellular architecture, trophoblast lineages, and the placental microenvironment. Evaluation of glycolytic parameters in differentiated SM10 cells and ex vivo placental tissue demonstrated nearly identical relationships. This supports the use of SM10 cells as a placental cell line that is glycolytically representative of metabolic functions of the mouse placenta [23], as well as validating extracellular flux analysis for use to assay glycolytic function in ex vivo placental tissue. Our studies found no significant differences in glycolytic parameters between mouse strains. Regardless of strain, males have larger placentas and fetuses. Comparatively, ICR mice have greater placental and fetal weights than C57BL/6 later in pregnancy.
In summary, our study provides an advance to investigate placental phenotypes that do not have established in vitro cell culture models. As placental development progresses, cell metabolism changes to meet new energy demands. Therefore, investigating placental metabolism throughout gestation will help to provide a more comprehensive understanding of the glycolytic requirements needed for successful pregnancy. In particular, ex vivo glycolytic analysis will provide an important advance in understanding placental metabolism in biologically relevant animal models of pregnancy-disorders associated with alterations in fetal growth, such as placental insufficiency, intrauterine growth restriction and preeclampsia, where metabolic reprogramming may occur [5].
Highlights.
A methodology to assay glycolytic function in intact murine placental tissue, ex vivo
Extracellular flux analysis as a measure of cell metabolism in ex vivo tissue
Ex vivo tissue retains characteristic placental lineages of the murine placenta
Ex vivo glycolytic analysis is a technical advance to understand placental metabolism
Acknowledgments
The authors would like to Dr. Debra Mayes of Wright State University and Dr. Nadja Grobe of Wright Patterson Air Force Base for the use of the XF24 Extracellular Flux Analyzer. We would like to also thank RJ Nogrady and Dr. Barbara Hull for assistance with tissue preparation and sectioning, and Dr. Steve Ledbetter of Genzyme, Inc., Boston, Massachusetts for providing TGF-β2. Funding for this work was supported in part by grants from the National Institutes of Health NICHD-R01 HD059969 (TLB) and Canadian Institutes of Health Research 201203MOP-275374-CIA-CBBA-109624 (DRN); as well as the Wright State University Biomedical Sciences Ph.D. Program (REA, CAW) and The Wright State University Endowment for Research on Pregnancy Associated Disorders (www.wright.edu/give/pregnancyassociateddisorders).
Footnotes
Publisher's Disclaimer: This is a PDF file of an unedited manuscript that has been accepted for publication. As a service to our customers we are providing this early version of the manuscript. The manuscript will undergo copyediting, typesetting, and review of the resulting proof before it is published in its final citable form. Please note that during the production process errors may be discovered which could affect the content, and all legal disclaimers that apply to the journal pertain.
Conflict of Interest Statement
The authors declare no competing financial interests exist.
References
- 1.Cross JC. Genetic insights into trophoblast differentiation and placental morphogenesis. Semin Cell Dev Biol. 2000;11(2):105–13. doi: 10.1006/scdb.2000.0156. [DOI] [PubMed] [Google Scholar]
- 2.Cross JC, Nakano H, Natale DR, Simmons DG, Watson ED. Branching morphogenesis during development of placental villi. Differentiation. 2006;74(7):393–401. doi: 10.1111/j.1432-0436.2006.00103.x. [DOI] [PubMed] [Google Scholar]
- 3.Rossant J, Cross JC. Placental development: lessons from mouse mutants. Nat Rev Genet. 2001;2(7):538–48. doi: 10.1038/35080570. [DOI] [PubMed] [Google Scholar]
- 4.Murray AJ. Oxygen delivery and fetal-placental growth: beyond a question of supply and demand? Placenta. 2012;(Suppl 2):e16–22. doi: 10.1016/j.placenta.2012.06.006. [DOI] [PubMed] [Google Scholar]
- 5.Ilekis JV, Tsilou E, Fisher S, Abrahams VM, Soares MJ, Cross JC, Zamudio S, Illsley NP, Myatt L, Colvis C, Costantine MM, Haas DM, Sadovsky Y, Weiner C, Rytting E, Bidwell G. Placental origins of adverse pregnancy outcomes: potential molecular targets: an Executive Workshop Summary of the Eunice Kennedy Shriver National Institute of Child Health and Human Development. Am J Obstet Gynecol. 2016;215:S1–S46. doi: 10.1016/j.ajog.2016.03.001. [DOI] [PMC free article] [PubMed] [Google Scholar]
- 6.Illsley NP, Caniggia I, Zamudio S. Placental metabolic reprogramming: do changes in the mix of energy-generating substrates modulate fetal growth? Int J Dev Biol. 2010;54:409–419. doi: 10.1387/ijdb.082798ni. [DOI] [PMC free article] [PubMed] [Google Scholar]
- 7.Zamudio S, Torricos T, Fik E, Oyala M, Echalar L, Pullockaran J, Tutino E, Martin B, Belliappa S, Balanza E, Illsley NP. Hypoglycemia and the origin of hypoxia-induced reduction in human fetal growth. PLoSOne. 2010;5:e8551. doi: 10.1371/journal.pone.0008551. [DOI] [PMC free article] [PubMed] [Google Scholar]
- 8.Kalisch-Smith JI, Simmons DG, Pantaleon M, Moritz KM. Sex differences in rat placental development: from pre-implantation to late gestation. Biol Sex Differ. 2017;8:17. doi: 10.1186/s13293-017-0138-6. [DOI] [PMC free article] [PubMed] [Google Scholar]
- 9.Kalisch-Smith JI, Simmons DG, Dickinson H, Moritz KM. Review: Sexual dimorphism in the formation, function and adaptation of the placenta. Placenta. 2016;(16):S0143–4004. 30655–5. doi: 10.1016/j.placenta.2016.12.008. [DOI] [PubMed] [Google Scholar]
- 10.Soncin F, Natale D, Parast MM. Signaling pathways in mouse and human trophoblast differentiation: a comparative review. Cell Mol Life Sci. 2015;72(7):1291–302. doi: 10.1007/s00018-014-1794-x. [DOI] [PMC free article] [PubMed] [Google Scholar]
- 11.Devaskar SU, Chu A. Intrauterine Growth Restriction: Hungry for an Answer. Physiology (Bethesda) 2016;31:131–146. doi: 10.1152/physiol.00033.2015. [DOI] [PMC free article] [PubMed] [Google Scholar]
- 12.Peacock JL, Marston L, Marlow N, Calvert SA, Greenough A. Neonatal and infant outcome in boys and girls born very prematurely. Pediatr Res. 2012;71(3):305–10. doi: 10.1038/pr.2011.50. [DOI] [PubMed] [Google Scholar]
- 13.Walker MG, Fitzgerald B, Keating S, Ray JG, Windrim R, Kingdom JC. Sex-specific basis of severe placental dysfunction leading to extreme preterm delivery. Placenta. 2012;33(7):568–71. doi: 10.1016/j.placenta.2012.03.011. [DOI] [PubMed] [Google Scholar]
- 14.Claycombe KJ, Vomhof-DeKrey EE, Roemmich JN, Rhen T, Ghribi O. Maternal low-protein diet causes body weight loss in male, neonate Sprague-Dawley rats involving UCP-1-mediated thermogenesis. J Nutr Biochem. 2015;26(7):729–35. doi: 10.1016/j.jnutbio.2015.01.008. [DOI] [PubMed] [Google Scholar]
- 15.Brett KE, Ferraro ZM, Yockell-Lelievre J, Gruslin A, Adamo KB. Maternal-fetal nutrient transport in pregnancy pathologies: the role of the placenta. Int J Mol Sci. 2014;15(9):16153–85. doi: 10.3390/ijms150916153. [DOI] [PMC free article] [PubMed] [Google Scholar]
- 16.Rosenfeld CS. Sex-Specific Placental Responses in Fetal Development. Endocrinology. 2015;156(10):3422–34. doi: 10.1210/en.2015-1227. [DOI] [PMC free article] [PubMed] [Google Scholar]
- 17.Clifton VL. Review: Sex and the human placenta: mediating differential strategies of fetal growth and survival. Placenta. 2010;31(Suppl):S33–9. doi: 10.1016/j.placenta.2009.11.010. [DOI] [PubMed] [Google Scholar]
- 18.Tarrade A, Rousseau-Ralliard D, Aubrière MC, Peynot N, Dahirel M, Bertrand-Michel J, Aguirre-Lavin T, Morel O, Beaujean N, Duranthon V, Chavatte-Palmer P. Sexual dimorphism of the feto-placental phenotype in response to a high fat and control maternal diets in a rabbit model. PLoS One. 2013;8(12):e83458. doi: 10.1371/journal.pone.0083458. [DOI] [PMC free article] [PubMed] [Google Scholar]
- 19.Muralimanoharan S, Maloyan A, Myatt L. Evidence of sexual dimorphism in the placental function with severe preeclampsia. Placenta. 2013;34(12):1183–9. doi: 10.1016/j.placenta.2013.09.015. [DOI] [PMC free article] [PubMed] [Google Scholar]
- 20.TeSlaa T, Teitell MA. Techniques to monitor glycolysis. Methods Enzymol. 2014;542:91–114. doi: 10.1016/B978-0-12-416618-9.00005-4. [DOI] [PMC free article] [PubMed] [Google Scholar]
- 21.Maloyan A, Mele J, Muralimanohara B, Myatt L. Measurement of mitochondrial respiration in trophoblast culture. Placenta. 2012;33(5):456–8. doi: 10.1016/j.placenta.2012.01.016. [DOI] [PMC free article] [PubMed] [Google Scholar]
- 22.Muralimanoharan S, Maloyan A, Myatt L. Mitochondrial function and glucose metabolism in the placenta with gestational diabetes mellitus: role of miR-143. Clin Sci (Lond) 2016;130(11):931–41. doi: 10.1042/CS20160076. [DOI] [PMC free article] [PubMed] [Google Scholar]
- 23.Waker CA, Albers RE, Pye RL, Doliboa SR, Wyatt CN, Brown TL, Mayes DA. AMPK knockdown in Placental Labyrinthine Progenitor Cells Results in Restriction of Critical Energy Resources and Terminal Differentiation Failure. Stem Cells Dev. 2017;26(11):808–817. doi: 10.1089/scd.2016.0252. [DOI] [PMC free article] [PubMed] [Google Scholar]
- 24.Schuh RA, Clerc P, Hwang H, Mehrabian Z, Bittman K, Chen H, Polster BM. Adaptation of microplate-based respirometry for hippocampal slices and analysis of respiratory capacity. J Neurosci Res. 2011;89(12):1979–88. doi: 10.1002/jnr.22650. [DOI] [PMC free article] [PubMed] [Google Scholar]
- 25.Fried NT, Moffat C, Seifert EL, Oshinsky ML. Functional mitochondrial analysis in acute brain sections from adult rats reveals mitochondrial dysfunction in a rat model of migraine. Am J Physiol Cell Physiol. 2014;307(11):C1017–30. doi: 10.1152/ajpcell.00332.2013. [DOI] [PMC free article] [PubMed] [Google Scholar]
- 26.Shintaku J, Guttridge DC. Analysis of Aerobic Respiration in Intact Skeletal Muscle Tissue by Microplate-Based Respirometry. Methods Mol Biol. 2016;1460:337–43. doi: 10.1007/978-1-4939-3810-0_23. [DOI] [PubMed] [Google Scholar]
- 27.Dunham-Snary KJ, Sandel MW, Westbrook DG, Ballinger SW. A method for assessing mitochondrial bioenergetics in whole white adipose tissues. Redox Biol. 2014;2:656–60. doi: 10.1016/j.redox.2014.04.005. [DOI] [PMC free article] [PubMed] [Google Scholar]
- 28.Brown TL, Moulton BC, Witte DP, Swertfeger DK, Harmony JA. Apolipoprotein J/clusterin expression defines distinct stages of blastocyst implantation in the mouse uterus. Biol Reprod. 1996;55:740–747. doi: 10.1016/j.redox.2014.04.005. [DOI] [PubMed] [Google Scholar]
- 29.Hughes M, Natale BV, Simmons DG, Natale DRC. Ly6e expression is restricted to syncytiotrophoblast cells of the mouse placenta. Placenta. 2013;34:831–835. doi: 10.1016/j.placenta.2013.05.011. [DOI] [PubMed] [Google Scholar]
- 30.Watson ED, Hughes M, Simmons DG, Natale DRC, Sutherland AE, Cross JC. Cell–cell adhesion defects in Mrj mutant trophoblast cells are associated with failure to pattern the chorion during early placental development. Dev Dyn. 2011;240:2505–2519. doi: 10.1002/dvdy.22755. [DOI] [PubMed] [Google Scholar]
- 31.Pfaffl MW, Georgieva TM, Georgiev IM, Ontsouka E, Hageleit M, Blum JW. Real-time RT-PCR quantification of insulin-like growth factor (IGF)-1, IGF-1 receptor, IGF-2, IGF-2 receptor, insulin receptor, growth hormone receptor, IGF-binding proteins 1, 2 and 3 in the bovine species, Domest. Anim Endocrinol. 2002;22:91–102. doi: 10.1016/s0739-7240(01)00128-x. [DOI] [PubMed] [Google Scholar]
- 32.Selesniemi K, Reedy M, Gultice A, Guilbert LJ, Brown TL. Transforming growth factor-beta induces differentiation of the labyrinthine trophoblast stem cell line SM10. Stem Cells Dev. 2005;14:697–711. doi: 10.1089/scd.2005.14.697. [DOI] [PubMed] [Google Scholar]
- 33.Selesniemi K, Albers RE, Brown TL. Id2 Mediates Differentiation of Labyrinthine Placental Progenitor Cell Line, SM10. Stem Cells Dev. 2016;25:959–974. doi: 10.1089/scd.2016.0010. [DOI] [PMC free article] [PubMed] [Google Scholar]
- 34.Carey EA, Albers RE, Doliboa SR, Hughes M, Wyatt CN, Natale DR, Brown TL. AMPK knockdown in placental trophoblast cells results in altered morphology and function. Stem Cells Dev. 2014;23:2921–30. doi: 10.1089/scd.2014.0092. [DOI] [PMC free article] [PubMed] [Google Scholar]
- 35.McClive PJ, Sinclair AH. Rapid DNA extraction and PCR-sexing of mouse embryos. Mol Reprod Dev. 2001;60:225–226. doi: 10.1002/mrd.1081. [DOI] [PubMed] [Google Scholar]
- 36.Westfall PH. Multiple Testing of General Contrasts Using Logical Constraints and Correlations. Journal of the American Statistical Association. 1997;92(437):299–306. [Google Scholar]
- 37.Simmons DG, Rawn S, Davies A, Hughes M, Cross JC. Spatial and temporal expression of the 23 murine Prolactin/Placental Lactogen-related genes is not associated with their position in the locus. BMC Genomics. 2008;9:352. doi: 10.1186/1471-2164-9-352. [DOI] [PMC free article] [PubMed] [Google Scholar]
- 38.Ueno M, Lee LK, Chhabra A, Kim YJ, Sasidharan R, Van Handel B, Wang Y, Kamata M, Kamran P, Sereti KI, Ardehali R, Jiang M, Mikkola HK. c-Met-dependent multipotent labyrinth trophoblast progenitors establish placental exchange interface. Dev Cell. 2013;27(4):373–86. doi: 10.1016/j.devcel.2013.10.019. [DOI] [PMC free article] [PubMed] [Google Scholar]
- 39.Fowden AL, Sferruzzi-Perri AN, Coan PM, Constancia M, Burton GJ. Placental efficiency and adaptation: endocrine regulation. J Physiol. 2009 Jul 15;587(Pt 14):3459–72. doi: 10.1113/jphysiol.2009.173013. [DOI] [PMC free article] [PubMed] [Google Scholar]
- 40.Wilson ME, Ford SP. Comparative aspects of placental efficiency. Reprod Suppl. 2001;58:223–32. [PubMed] [Google Scholar]