Abstract
Problem
Decidual immune dysregulation is thought to underlie major pregnancy disorders, however, incomplete understanding of the decidual immune interface has hampered mechanistic investigation.
Method of Study
Human term decidua were collected and single-cell phenotypic information acquired by highly polychromatic flow cytometry. Cellular identity analysis was performed with t-distributed Stochastic Neighbor Embedding, densVM clustering and matched to CellOntology database.
Results
Traditional analytical methods validated known cellular T and dendritic cell subsets in human term decidua. Computational analysis revealed a complex and tissue-specific decidual immune signature in both the innate and adaptive immune compartments.
Conclusion
Polychromatic flow cytometry with a streamlined computational analysis pipeline is a feasible approach to comprehensive immunome mapping of human term decidua. As an unbiased, standardized method of investigation, computational flow cytometry promises to unravel the immune pathology of pregnancy disorders.
Keywords: Pregnancy Immunology, adaptive immunity, flow cytometry, machine learning, decidua, T lymphocytes, dendritic cells
1. Introduction
The immune system plays a critical role at the maternal-fetal interface, providing protection against pathogens1,2, maintaining tolerance towards the semi-allogeneic fetus3, and promoting vascular remodeling in the decidua4–6. Accordingly, immune dysregulation is implicated in a wide range of pregnancy pathologies such as preeclampsia, pre-term labor and recurrent pregnancy loss2, to name but a few. Progress in the field has been limited by the difficulty in providing unbiased, simultaneous analysis of the entire immune component present at the maternal-fetal interface. The complexity of mapping the immune component of the maternal-fetal interface necessitated a novel platform, combining highly polychromatic flow cytometry, traditional manual analysis and advanced computational analysis. To demonstrate the power of this approach, we simultaneously mapped the diverse subsets of conventional T cells and antigen presenting cells (APCs), from individual decidual specimens.
Manual operator-driven analysis of high-dimensional panels, such as those employed in this study can prove difficult and inefficient and can mislead due to tissue-dependent deviations in canonical marker expression. T-distributed stochastic neighbor embedding (t-SNE), a dimensionality reduction technique that preserves high-dimensional proximity relationships in data, while projecting cellular information unto a lower-dimensional map7, is a promising method for visualization of logarithmically distributed, high-dimensional flow cytometry data8. Combined with density-based clustering aided by support vector machine, or DensVM, for unbiased segregation of cellular subtypes in hierarchical families, we leverage this computational platform to evince the rich diversity and novel features of the human decidual immunome.
The human decidua is a tissue with unique immunological requirements, whose investigation required a novel approach. To determine the validity of such an approach, we focused on mapping the diversity of T cells and dendritic cells in the human term decidua. However, the extent of CD4+ T cell naïve/memory/effector subset distribution has not been extensively studied, and assigning of cellular identities of DCs/macrophages/monocytes, is difficult due to overlap in expression of canonical markers by multiple cellular subsets9,10, with expression often being tissue specific11.
2. Materials and Methods
2.1 Human Samples
De-identified term human (>37 wks GA) placental samples were collected from normal elective cesarean sections under the UW Obstetrical Tissue Bank IRB protocol (#2014-1223). Briefly, decidua basalis was separated from placenta and decidua parietalis was scraped from the embryonic membrane and washed with cold PBS, as previously described12. Tissue was minced and dissociated in RPMI containing 1 mg/ml of Collagenase type V (Worthington Biochem. Corp.), 2 μg/ml DNAse I (Worthington Biochem. Corp.), using the gentleMACS™ Dissociator system (Miltenyi Biotec Inc. San Diego, CA). Homogenates were then filtered through a 70 μm filter, red blood cells were lysed with ACK lysis buffer (Life Technologies) and mononuclear cells (MCs) were recovered and frozen until processing. Control, anonymous, PBMCs were acquired from All Cells® (Alameda, CA) and kept frozen until processing.
2.2 Flow Cytometry and Standardization
Isolated MCs were first labeled with LIVE/DEAD® fixable blue stain (Invitrogen) according to manufacturer’s instructions. MCs were then labeled with flourochrome-conjugated monoclonal antibodies, listed in Table 1. Briefly, antibodies were diluted in BD Horizon Brilliant™ Stain Buffer (BD Biosciences, San Jose, CA) and used to label MCs according to manufacturer’s instructions. Samples were then acquired using the LSR Fortessa in a 5 laser (355nm, 405nm, 488nm, 562nm, 633nm) 20-detector configuration (BD Biosciences).
Table 1.
Antibodies used for flow cytometry analysis.
| Marker | Clone | Fluorochrome | Supplier |
|---|---|---|---|
| CCR4 | 1G1 | PerCP-Cy5.5 | BD Bioscience |
| CCR6 | 11A9 | BUV496 | BD Bioscience |
| CCR7 | G043H7 | Alexa647 | BioLegend |
| CD1a | HI149 | PE-Cy5 | BD Bioscience |
| CD1c | L161 | PE-Dazzle594 | BioLegend |
| CD3 | UCHT1 | BV421 | BD Bioscience |
| CD3 | SK7 | PE-Cy7 | BD Bioscience |
| CD4 | RPA-T4 | Alexa488 | BD Bioscience |
| CD8 | SK1 | BV605 | BD Bioscience |
| CD8 | RPA-T8 | BV421 | BD Bioscience |
| CD11b | ICRF44 | BV605 | BD Bioscience |
| CD11c | B-ly6 | BB515 | BD Bioscience |
| CD14 | M5E2 | BV605 | BD Bioscience |
| CD16 | 3G8 | BUV496 | BD Bioscience |
| CD19 | SJ25C1 | APC-H7 | BD Bioscience |
| CD25 | M-A251 | PE | BD Bioscience |
| CD27 | M-T271 | PE-Cy7 | BD Bioscience |
| CD33 | WM53 | PE | BioLegend |
| CD38 | HIT2 | BV510 | BD Bioscience |
| CD45RA | HI100 | Alexa700 | BD Bioscience |
| CD45RO | UCHL1 | APC-H7 | BD Bioscience |
| CD56 | B156 | PE-Cy7 | BD Bioscience |
| CD62L | Dreg-56 | PE-CF594 | BD Bioscience |
| CD80 | L307.4 | A700 | BD Bioscience |
| CD123 | 7G3 | BUV395 | BD Bioscience |
| CD127 | A019D5 | BV785 | BioLegend |
| CD141 | 1A4 | APC | BD Bioscience |
| CD161 | DX12 | BV650 | BD Bioscience |
| CD209 | DCN46 | PerCP-Cy5.5 | BD Bioscience |
| CXCR3 | AC6/CXCR3 | PE-Cy5 | BD Bioscience |
| HLA-DR | G46-6 | BV786 | BD Bioscience |
| HLA-DR | G46-6 | BUV395 | BD Bioscience |
SPHERO™ Rainbow Calibration Particles (Sperotech, Lake Forest, IL) were used to standardize PMT voltage settings. Briefly, PMT voltages were optimized during first experimental run. MFI values were then calculated for the Rainbow beads and were used in subsequent experimental runs as target values (± 10%) to set PMT voltages.
2.3 Data Analysis
Manual analysis identifying well-characterized populations was performed using FlowJo v.10 software (FlowJo LLC, Ashland, OR). Dimensionality reduction was performed using the t-SNE algorithm, followed by DensVM clustering, both part of the open-source R package, Cytofkit (github.com/JinmiaoChenLab/cytofkit)13. Briefly, data files were pre-gated to exclude dead cells and irrelevant populations and concatenated using FlowJo. Concatenated files were then uploaded to R/Cytofkit via GUI interface and parameters of interest were selected. Newly derived t-SNE and DensVM coordinates were added to original data matrices, exported, and analyzed in FlowJo. Cluster frequenices and MFI values were then calculated within FlowJo. Heatmaps for MFI (z-score normalized) and cluster frequencies were constructed using JMP Pro® v. 11.0.0 (SAS, Cary, NC). All data is represented as Mean ± SEM and statistical significance was determined with ANOVA analysis, followed by Tukey’s post-hoc test to correct for multiple comparisons, using Prism® v. 7 (GraphPad Software, Inc, La Jolla, CA).
3. Results
3.1 High dimensional flow cytometry panels identify canonical T and antigen presenting cell subsets in term human decidua
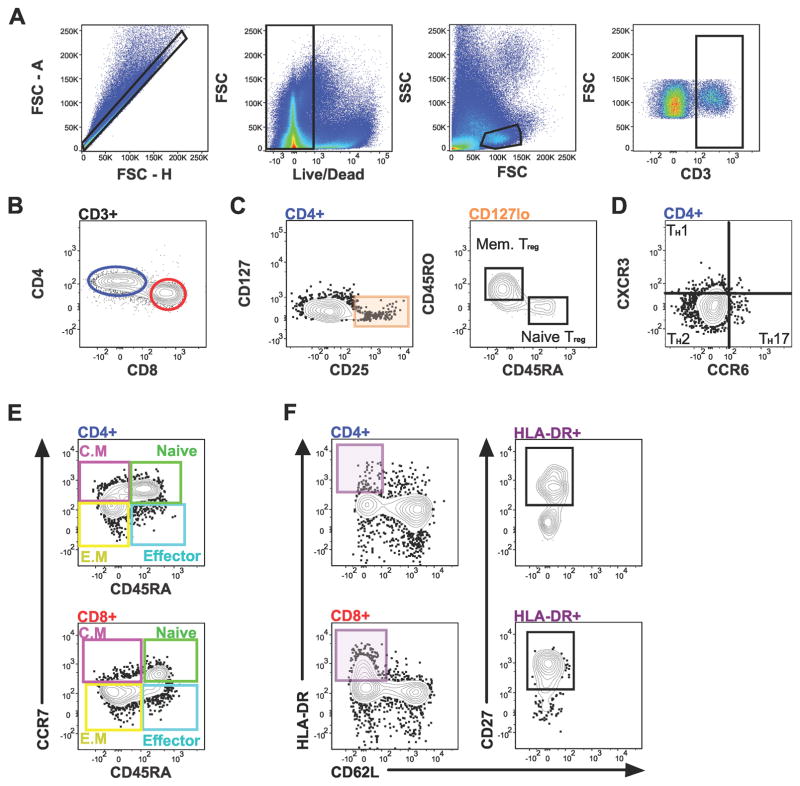
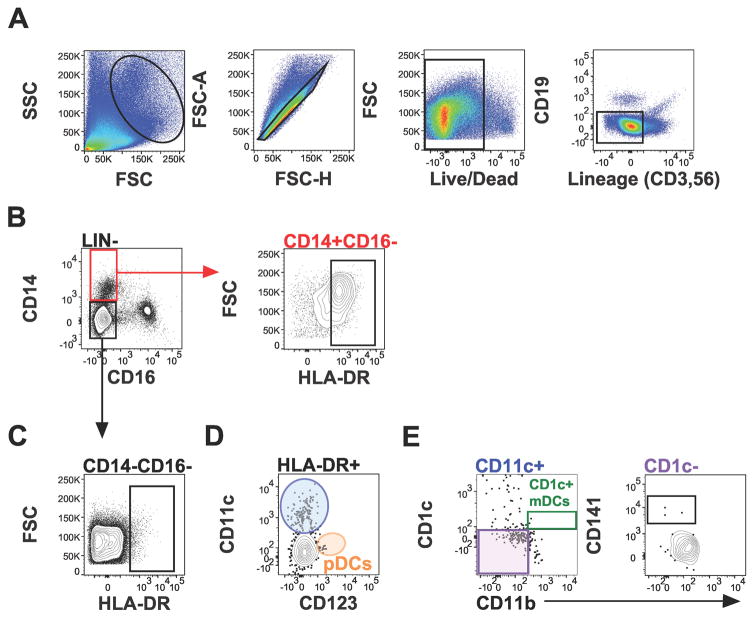
To examine the T cell and dendritic cell component of the human term decidua, two 16-parameter panels (Table 1) were developed. These panels were validated by subset mapping of known T cell subsets in human term decidua (Figure 1) and technical control PBMCs (Figure S1). Similarly, diverse antigen presenting cells were precisely defined (Figure 2), including macrophages (HLA-DR+CD16−CD14+, Figure 2B), dendritic cells (DC, HLA-DR+CD16−CD14−, Figure 2C), and DC subsets plasmacytoid (pDCs, Figure 2D), and myeloid (mDCs) type in human term decidua (Figure 2E).
Figure 1.
T cell subsets identified in term human decidua. Gating scheme for: (A) CD3+, (B) CD4+ and CD8+ T cells, and (C) Tregs and Tregs subsets, (D) T helper (TH) subsets, (E) Central Memory (C.M), naïve, effector memory (E.M), and effector CD4+ (top) and CD8+ (bottom) T cells, and (F) activated CD4+ (top) and CD8+ (bottom) T cells, from decidua basalis.
Figure 2.
Antigen presenting cell subsets in term human decidua. Gating scheme for: (A) Lin (CD3, CD19, CD56) negative cells, (B) macrophages (CD16−HLA-DR+CD14+), (C) dendritic cells (CD16−HLA-DR+CD14−), (D) plasmacytoid dendritic cells (pDCs), and (E) myeloid dendritic cells, from decidua basalis.
3.2 Cellular subset visualization by dimensionality reduction allows phenotype classification without complex gating
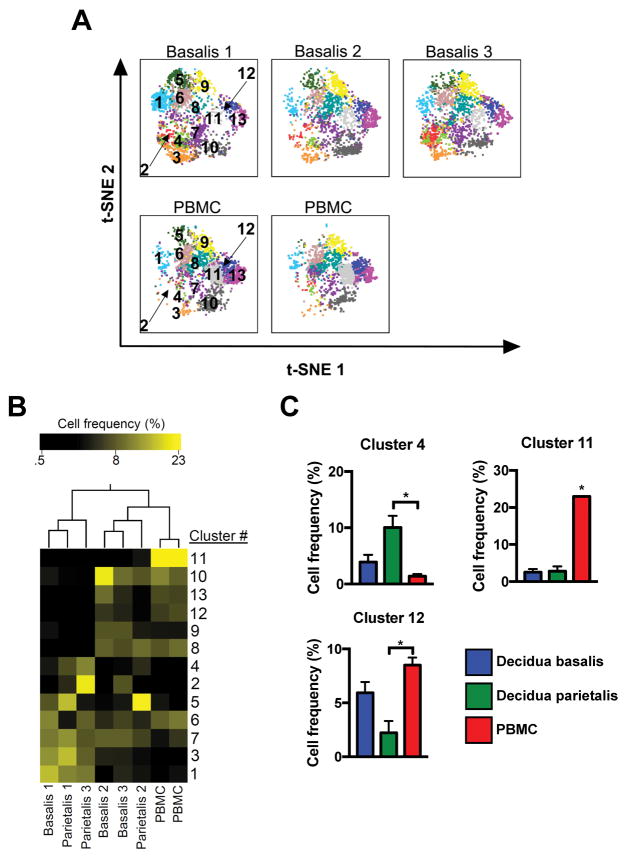
Analysis of flow cytometry data by manual methods can be a source of variation and requires expert knowledge. To test whether dimensionality reduction coupled with automated clustering presented a valid tool to analyze the decidual immunome, T cell and dendritic cell data sets were visualized (Figure 3). Pre-gated CD3+ populations from three data sets (3 decidua basalis, 3 decidua parietalis, 2 PBMC) were coded with sample numbers (censored from analysis), merged, and visualized with t-SNE dimensionality reduction. Thirteen cellular phenotypes were identified by DensVM clustering, providing visual partitioning of t-SNE map (Figure 3A, top). To validate t-SNE/DensVM-derived cellular identity, TH (1, 2 and 17) and CD8+ T cells were manually gated and overlaid onto the reduced t-SNE dimensions. Manually gated TH and CD8+ cells mapped onto separate regions of the plot, validating application of this platform to decidual immune cells (Figure 3A, bottom). A heatmap of the median fluorescence intensity (MFI) for every marker analyzed within each cluster was generated to assess phenotypes (Figure 3B). Phenotypes were then classified as T cell subsets by CellOntology14 (Table 2), allowing rapid assignment of cell identity.
Figure 3.
Visualization of T cell and dendritic cell diversity. (A) t-SNE map generated from pre-gated CD3+ cells from decidua basalis (D.B), decidua parietalis (D.P), and PBMC (P) data sets (top) and manually gated subsets overlaid onto total CD3+ cells (bottom). (B) Hierarchical clustering of median surface marker expression levels of clusters identified by DensVM. (C) t-SNE map generated from merged data from pre-gated Lin−HLADR+CD16− cells from D.B, D.P, and (P) data sets (top) and indicated cell manually gated subsets overlaid onto total Lin−HLADR+CD16− cells (bottom). (D) Hierarchical clustering of median surface marker expression levels of clusters identified by DensVM.
Table 2.
Presumed classification of CD3+ clusters
| Cluster | Phenotype | Presumed Name |
|---|---|---|
|
| ||
| 1 | CD4+CCR6-CCR4+CD27-CD45RA-CD197-CD62L-CXCR3+CD45RO+CD161+CD25+ | CD4-positive, CD25-positive, CCR4-positive, alpha-beta regulatory T cell |
| 2 | CD8+CD127-CCR4+CD27-CD45RA-CD197-CD62L-HLA-DR+CD38+CXCR3+CD45RO+CD161+CD25+ | CD8-positive, CD25-positive, alpha-beta regulatory T cell |
| 3 | CD8+CCR6+CD127-CD45RA-CD197-CD62L-HLA-DR+CXCR3+CD161- | Cytotoxic T cell |
| 4 | CD8+CD127-CCR4-CD27-CD45RA-CD197-CD62L-CXCR3+CD161+CD25+ | Cytotoxic T cell |
| 5 | CD4+CCR6-CD127-CCR4-CD45RA-CD197-CD62L-CD38+CXCR3+CD45RO+CD161+CD25+ | T-helper 1 cell |
| 6 | CD4+CCR6+CD127+CD27-CD45RA-CD197-CD62L-HLA-DR-CD38-CXCR3+CD45RO+CD161+ | T-helper 1 cell |
| 7 | CD8+CD127-CCR4+CD27-CD197-CD62L-HLA-DR-CXCR3-CD45RO-CD161+ | Cytotoxic T cell |
| 8 | CD4+CCR6-CD127+CCR4+CD45RA-CD197-CD62L-HLA-DR-CD38-CXCR3-CD45RO+CD161+CD25+ | T-helper 2 cell |
| 9 | CD4+CD127+CCR4+CD27+CD45RA-CD197-CD62L+HLA-DR-CD38-CD45RO+ | Central Memory T Cells |
| 10 | CD8+CCR6+CD127+CCR4+CD27+CD45RA+CD197+CD62L-HLA-DR-CD38-CXCR3-CD45RO-CD161-CD25- | Cytotoxic T cell |
| 11 | CD8-CD27+CD45RA+CD197+CD62L-HLA-DR-CD38-CXCR3-CD45RO-CD161-CD25- | Effector Memory T cell |
| 12 | CD4+CD127+CCR4+CD27+CD45RA+CD197+CD62L+HLA-DR-CXCR3-CD45RO-CD161-CD25+ | CD4-positive, CD25-positive, CCR4-positive, alpha-beta regulatory T cell |
| 13 | CD4+CD127+CCR6+CCR4-CD27+CD45RA+CD197+CD62L+HLA-DR-CXCR3-CD45RO-CD161-CD25- | T-helper 17 cell |
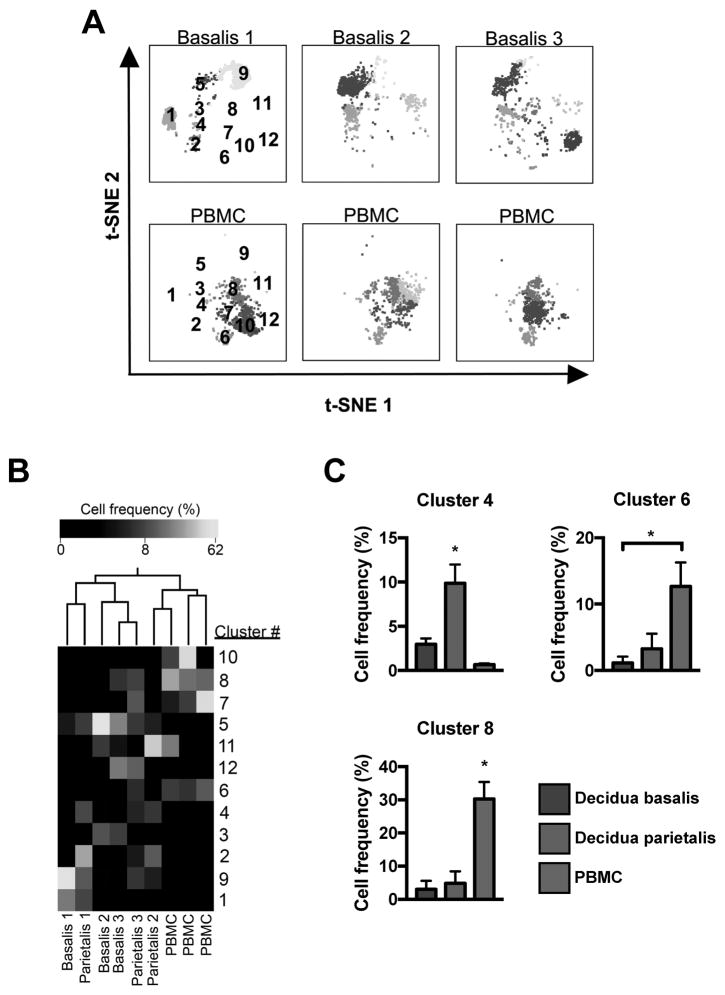
The t-SNE analysis pipeline was then used to classify decidual dendritic cells (Figure 3C), within HLA-DR+CD16− subpopulations from three experiments (3 decidua basalis, 3 decidua parietalis, 3 PBMC). Because a small subset of DCs express the CD14 marker, it was included in the analysis. DensVM analysis revealed 12 phenotype clusters on the merged t-SNE dataset map (Figure 3C, top). Major DC populations segregated onto unique regions of the generated t-SNE map (Figure 3C, bottom). MFI values for each marker were calculated for each cluster and a heatmap was generated (Figure 3D). Thus, t-SNE/DenseVM/CellOntology analysis pipeline provides an unbiased, operator-independent method for mapping the cellular immunome of the human decidua.
3.3 DenseVM clustering reveals unique immune signature of human term decidua
To determine if patterns of cellular phenotypes observed in specimens constitute cellular “signatures” characteristic of tissue of origin (decidua, PBMC), individual t-SNE maps of decidual and PBMC specimens were visualized (Figure 4A). Quantification of phenotype frequency in each sample, followed by hierarchical 2-way clustering (phenotype and tissue), revealed a distinct distribution of phenotypes across the tissues tested (Figure 4B). PBMC and decidual specimens segregated based on frequency of cellular phenotypes constituting them. Furthermore, certain phenotypes (e.g., cluster 11) were found primarily in PBMC samples, while others (e.g. cluster 4) were characteristic of the decidua (Figure 4B). Classification by CellOntology suggested that cluster 4 are activated CD8+ T cells (Table 2, elevated in decidua parietalis), while clusters 11 (CD4+ effector memory) and 12 (CCR4+ Treg) were preferentially represented in PBMCs (Figure 4C).
Figure 4.
Unique T cell distribution signature in term decidua. (A) Separate decidua basalis (D.B) and PBMC (P) visualized using t-SNE map generated from the merged data set. (B) Hierarchical clustering of cluster frequencies within CD3+ cells from D.B, decidua parietalis (D.P), and P. (C) Bar graphs of average cell frequencies that were determined to be statistically different. D.B (n = 3), D.P (n = 3), and P (n = 2). Significance is denoted by *p < 0.05.
To determine whether this was cell type specific, a similar analysis investigated the distribution of DC clusters in decidua and PBMCs and revealed cluster frequency differences between decidua basalis and PBMCs (Figure 5A) and Ward clustering of cell frequency segregated decidual tissues from PBMC samples (Figure 5B). Three clusters (4, 6, 8) were found to be statistically different between tissues (p < 0.05). Cluster 4 (granulocyte monocyte progenitor cell; Table 3) was significantly elevated in decidua parietalis, while clusters 6 and 8 (neutrophilic myelocite) were elevated in PBMCs (Figure 5C).
Figure 5.
Dendritic cell distribution in term decidua. (A) Separate decidua basalis (D.B) and PBMC (P) visualized using t-SNE map generated from the merged data set. (B) Hierarchical clustering of cluster frequencies within Lin−HLA-DR+CD16− cells from D.B, decidua parietalis (D.P), and P. (C) Bar graphs of average cell frequencies that were determined to be statistically different. D.B (n = 3), D.P (n = 3), and P (n = 3). Significance is denoted by *p < 0.05.
Table 3.
Presumed classification of HLA-DR+CD16- clusters
| Cluster | Phenotype | Presumed Name |
|---|---|---|
|
| ||
| 1 | CD123+CD1a-CD80-CD8+CD209+CD1c+CD11b-CD14-CD33-CD11c+ | CD141+ Myeloid |
| 2 | CD123+CD141+CD1a+CD80+CD209-CD1c+CD11b-CD33-CD11c- | Plasmacytoid |
| 3 | CD123-CD141-CD1a-CD80-CD8-CD209+CD11b-CD14-CD33-CD11c- | CD11c- negative plasmacytoid dendritic cell |
| 4 | CD123+CD1a-CD80-CD209+CD11b-CD14-CD33-CD11c- | Plasmacytoid |
| 5 | CD123-CD141-CD1a-CD80-CD8-CD209+CD11b-CD14-CD33-CD11c- | CD11c- negative plasmacytoid dendritic cell |
| 6 | CD123-CD141-CD1a+CD8+CD209-CD1c+CD11b-CD14-CD33+CD11c- | CD1c+ Myeloid |
| 7 | CD123-CD141-CD8+CD209-CD1c-CD11b+CD14+CD33+CD11c- | CD11b-Positive Dendritic Cell |
| 8 | CD141-CD80-CD8+CD1c-CD33+CD11c- | CD33+ Myeloid Dendritic Cell |
| 9 | CD123+CD141-CD1a-CD80-CD8+CD209+CD1c+CD11b-CD33-CD11c+ | CD1c+ Myeloid |
| 10 | CD123+CD141-CD1a+CD80+CD8+CD209-CD1c-CD11b+CD14+CD33+CD11c- | Plasmacytoid |
| 11 | CD123+CD141-CD1a+CD80-CD8-CD209-CD1c-CD11b+CD14+CD33+ | CD11b-Positive Dendritic Cell |
| 12 | CD123-CD141-CD1a+CD80+CD8+CD209-CD1c-CD11b+CD14+CD33+CD11c+ | Myeloid-derived Suppressor Cell |
4. Discussion
A successful pregnancy requires the collaboration of a diverse array of maternal and feto-placental immune and non-immune cells. Accordingly, the complex network of immune cells at the decidual maternal-fetal interface guides the assembly of tissue architecture, and enacts an appropriate site-specific balance of immune privilege/tolerance and protection. Dysregulation of this system often leads to adverse consequences for both the mother and neonate. Historically, mechanistic dissection of these processes employed single/few identifying cell-surface markers to link specific immune cells with adverse pregnancy outcomes in humans15,16 and model systems, with mixed success, limiting translational/clinical progress. Consequently, the development and application of a novel, comprehensive and unbiased analysis platform was necessary. We optimized and validated highly polychromatic flow cytometry to comprehensively and concomitantly examine immune cells in term human decidua. Resulting datasets exhibited high dimensionality and manual analysis confirmed and extended many known features of adaptive immunity found in the decidua, validating this approach. Analysis of such complex datasets, and standardization for future assessment of clinical-outcome related cellular hubs, led us to apply operator-independent dimensionality reduction for visualization and machine learning algorithms for assignation of cellular identity.
To test the power of dimensionality reduction/machine learning analysis, and compare with manual expert gating, CD3+ cells from our specimens were analyzed. This revealed that amongst CD8+ T cells, the activated fraction is elevated and naïve fraction diminished in decidual tissues (Figure 4C). Furthermore, the identified cellular clusters defined the tissue-specific “cellular signature” as decidual specimens segregated from the control PBMCs when examined by Ward clustering. Previous studies have shown the presence of DCs at the maternal-fetal interface17,18 and our data supports those findings. However, the dramatic level of diversity within DC populations at the maternal-fetal interface has been underappreciated since most of these studies focused on a few defining markers. Dimensionality reduction analysis presented here revealed a high degree of diversity, with nine substantially unique clusters, and distinctive DC subset distribution in the decidua (Figure 5A,B). Herein, we demonstrate the power of tSNE/DenseVM analysis in classifying unique distributions of T/DC subtypes in decidual tissues.
The difficulties in interpretation of clinically relevant data sets focused on immune cells at the maternal-fetal interface prompted the design of the current study, to provide a nuanced understanding of the decidual immunome and establish a baseline for future studies in pregnancy pathology. Our experience reveals both the power and challenges of this approach. Utilization of high-dimensional flow cytometry is currently limited by the detailed expertize and quality control necessary to standardize and maintain necessary consistency across experiments. To reduce technical variations between experiments, we employed use of bead standards to tune flow cytometer detectors prior to each run and employed automated specimen disaggregation, freezing, batching, and careful antibody batch titrations to increase staining consistency. Despite these extensive efforts, we still observe batch effect when employing machine learning, indicating that even batch-batch staining difference not immediately apparent on manual 2D-section analysis will be revealed by agnostic learning algorithms (data not shown). This phenomenon is a key challenge in all of flow cytometry, and use of agreed-upon classifiers (such as CellOntology14) can help curtail the batch variance. Development of algorithms allowing efficient and operator-independent cross-experiment normalization and classification is a key feature necessary for broader distribution of this technology. Similarly, seeding of t-SNE clusters and random-walk optimization is run-specific, necessitating re-running of the entire concatenated series with each added specimen, a task that scales logarithmically with added data points, presenting challenges in computational time/resource use. We, and others, are currently pursuing optimizations and adaptations of dimensionality reduction/machine learning algorithms to overcome these limitations. Accomplishing this goal would dramatically expand use cases for flow cytometry/machine learning in clinical diagnostics.
Our work establishes a novel platform for immunome assessment at the maternal-fetal interface. Human term decidual immunome analysis reveals the stunning complexity of the normal immune signature, validated against conventional manual gating. Computational flow cytometry platform promises standardization and simplification of decidual immunome analysis for both basic research and translational physiology and pathology applications.
Supplementary Material
Gating scheme for CD3+ and T cell subsets in technical control PBMCs. CM = Central Memory, E.M = effector memory (E.M).
Gating scheme for antigen presenting cells in technical control PBMCs.
Acknowledgments
We thank T. Golos, M. Patankar, and J. Bezbradica for review of manuscript and suggestions. D. Sheerar and R. Sheridan from UWCCC Flow lab for technical support. J.V. was supported by NIH TEAM-Science (R25 GM083252) and UW SciMed GRS Fellowship. M.C. was supported by WISE Summer Research Grant. Y.L. was supported by AAI Careers in Immunology Fellowship (to A.K.S). AKS and this research project were supported grant K12HD000849-28 awarded to the Reproductive Scientist Development Program by the Eunice Kennedy Shriver National Institute of Child Health & Human Development. Additional research support (to A.K.S.) was provided by March of Dimes, and Burroughs Wellcome Fund, as part of the Reproductive Scientist Development Program. UWCCC Flow core grant (1S100OD018202-01).
Footnotes
Author Contributions
J.V and A.K.S. designed research. J.V., Y.L., and G.E.L. acquired tissue samples. J.V. performed experiments. J.V, M.C, A.K.S analyzed data. J.V. and A.K.S wrote manuscript. A.K.S supervised the project.
References
- 1.Erlebacher A. Immunology of the Maternal-Fetal Interface. Annu Rev Immunol. 2013;31(1):387–411. doi: 10.1146/annurev-immunol-032712-100003. [DOI] [PubMed] [Google Scholar]
- 2.Triggianese P, Perricone C, Chimenti MS, De Carolis C, Perricone R. Innate Immune System at the Maternal-Fetal Interface: Mechanisms of Disease and Targets of Therapy in Pregnancy Syndromes. Am J Reprod Immunol. 2016;76(4):245–257. doi: 10.1111/aji.12509. [DOI] [PubMed] [Google Scholar]
- 3.Kahn DA, Baltimore D. Pregnancy induces a fetal antigen-specific maternal T regulatory cell response that contributes to tolerance. Proc Natl Acad Sci. 2010;107(20):9299–9304. doi: 10.1073/pnas.1003909107. [DOI] [PMC free article] [PubMed] [Google Scholar]
- 4.Hanna J, Goldman-Wohl D, Hamani Y, et al. Decidual NK cells regulate key developmental processes at the human fetal-maternal interface. Nat Med. 2006;12(9):1065–1074. doi: 10.1038/nm1452. [DOI] [PubMed] [Google Scholar]
- 5.Matson BC, Caron KM. Uterine natural killer cells as modulators of the maternal-fetal vasculature. Int J Dev Biol. 2014;58(2-3-4):199–204. doi: 10.1387/ijdb.140032kc. [DOI] [PubMed] [Google Scholar]
- 6.Zhang J, Chen Z, Smith GN, Croy BA. Natural killer cell-triggered vascular transformation: maternal care before birth? Cell Mol Immunol. 2011;8(1):1–11. doi: 10.1038/cmi.2010.38. [DOI] [PMC free article] [PubMed] [Google Scholar]
- 7.van der Maaten, Laurens, Hinton G. Visualizing Data using t-SNE. J Mach Learn Res. 2008;1:1–48. [Google Scholar]
- 8.Saeys Y, Gassen SV, Lambrecht BN. Computational flow cytometry: helping to make sense of high-dimensional immunology data. Nat Rev Immunol. 2016;16(7):449–462. doi: 10.1038/nri.2016.56. [DOI] [PubMed] [Google Scholar]
- 9.Ning F, Liu H, Lash GE. The Role of Decidual Macrophages During Normal and Pathological Pregnancy. Am J Reprod Immunol. 2016;75(3):298–309. doi: 10.1111/aji.12477. [DOI] [PubMed] [Google Scholar]
- 10.Ziegler-Heitbrock L, Ancuta P, Crowe S, et al. Nomenclature of monocytes and dendritic cells in blood. Blood. 2010;116(16):e74–e80. doi: 10.1182/blood-2010-02-258558. [DOI] [PubMed] [Google Scholar]
- 11.Guilliams M, Ginhoux F, Jakubzick C, et al. Dendritic cells, monocytes and macrophages: a unified nomenclature based on ontogeny. Nat Rev Immunol. 2014;14(8):571. doi: 10.1038/nri3712. [DOI] [PMC free article] [PubMed] [Google Scholar]
- 12.Xu Y, Plazyo O, Romero R, Hassan SS, Gomez-Lopez N. Isolation of Leukocytes from the Human Maternal-fetal Interface. J Vis Exp. 2015;(99) doi: 10.3791/52863. [DOI] [PMC free article] [PubMed] [Google Scholar]
- 13.Wong MT, Chen J, Narayanan S, et al. Mapping the Diversity of Follicular Helper T Cells in Human Blood and Tonsils Using High-Dimensional Mass Cytometry Analysis. Cell Rep. 2015;11(11):1822–1833. doi: 10.1016/j.celrep.2015.05.022. [DOI] [PubMed] [Google Scholar]
- 14.Courtot M, Meskas J, Diehl AD, et al. flowCL: ontology-based cell population labelling in flow cytometry. Bioinformatics. 2015;31(8):1337–1339. doi: 10.1093/bioinformatics/btu807. [DOI] [PMC free article] [PubMed] [Google Scholar]
- 15.Huang C, Zhang H, Chen X, et al. Association of peripheral blood dendritic cells with recurrent pregnancy loss: a case-controlled study. Am J Reprod Immunol. 2016;76(4):326–332. doi: 10.1111/aji.12550. [DOI] [PubMed] [Google Scholar]
- 16.Tang M-X, Zhang Y-H, Hu L, Kwak-Kim J, Liao A-H. CD14 ++ CD16 + HLA-DR + Monocytes in Peripheral Blood are Quantitatively Correlated with the Severity of Pre-eclampsia. Am J Reprod Immunol. 2015;74(2):116–122. doi: 10.1111/aji.12389. [DOI] [PubMed] [Google Scholar]
- 17.Bartmann C, Junker M, Segerer SE, Häusler SF, Krockenberger M, Kämmerer U. CD33 + /HLA-DR neg and CD33 + /HLA-DR +/− Cells: Rare Populations in the Human Decidua with Characteristics of MDSC. Am J Reprod Immunol. 2016;75(5):539–556. doi: 10.1111/aji.12492. [DOI] [PubMed] [Google Scholar]
- 18.Gardner L. Dendritic Cells in the Human Decidua. Biol Reprod. 2003;69(4):1438–1446. doi: 10.1095/biolreprod.103.017574. [DOI] [PubMed] [Google Scholar]
Associated Data
This section collects any data citations, data availability statements, or supplementary materials included in this article.
Supplementary Materials
Gating scheme for CD3+ and T cell subsets in technical control PBMCs. CM = Central Memory, E.M = effector memory (E.M).
Gating scheme for antigen presenting cells in technical control PBMCs.


