

SUMMARY
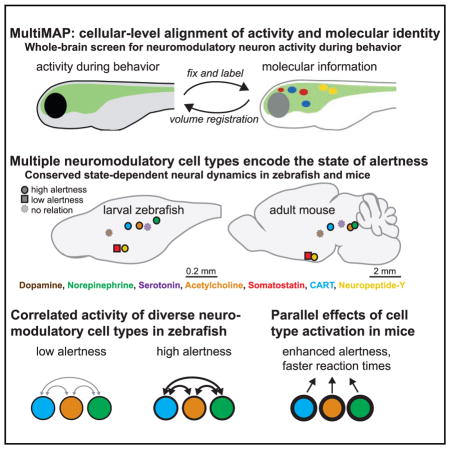
Internal states of the brain profoundly influence behavior. Fluctuating states such as alertness can be governed by neuromodulation, but the underlying mechanisms and cell types involved are not fully understood. We developed a method to globally screen for cell types involved in behavior by integrating brain-wide activity imaging with high-content molecular phenotyping and volume registration at cellular resolution. We used this method (MultiMAP) to record from 22 neuromodulatory cell types in behaving zebrafish during a reaction-time task that reports alertness. We identified multiple monoaminergic, cholinergic, and peptidergic cell types linked to alertness and found that activity in these cell types was mutually correlated during heightened alertness. We next recorded from and controlled homologous neuromodulatory cells in mice; alertness-related cell-type dynamics exhibited striking evolutionary conservation and modulated behavior similarly. These experiments establish a method for unbiased discovery of cellular elements underlying behavior and reveal an evolutionarily conserved set of diverse neuromodulatory systems that collectively govern internal state.
In Brief
Registration of brain-wide activity measurements with multiple molecular markers at cellular resolution uncovers multiple diverse neuromodulatory pathways linked to brain state.
INTRODUCTION
Internal states of the nervous system can rapidly and profoundly influence sensation, cognition, emotion, and action (Coull, 1998; Pfaff et al., 2008; Lee and Dan, 2012; Anderson and Adolphs, 2014). Circuit-level implementations of internal states, which enable brain-wide alteration of neural function on fast or slow timescales while wiring and structure remain unchanged, are not fully understood. Changes in internal state can be elicited in part by neuromodulatory systems, which are composed of cell types that project widely throughout the brain and release neurotransmitters such as biogenic amines and neuropeptides (Getting, 1989; Bargmann, 2012; Marder, 2012; Lee and Dan, 2012). These neuromodulators can potently alter the function of targeted neural circuitry through a variety of postsynaptic receptors that influence ion conductance, biochemical signaling, and gene expression (Getting, 1989; Bargmann, 2012; Marder, 2012).
Arousal is an internal state that changes dramatically over the circadian cycle and even within periods of wakefulness. Fluctuations in arousal are present throughout the animal kingdom and influence physiological processes and behaviors across many timescales (Coull, 1998; Pfaff et al., 2008; Anderson and Adolphs, 2014). Much is known about the long-timescale changes in arousal governing sleep and wakefulness involving diverse neuromodulatory systems, including neurons releasing norepinephrine, acetylcholine, histamine, dopamine, serotonin, and hypocretin/orexin, among others (Saper et al., 2010; de Lecea et al., 2012; Lee and Dan, 2012; Chiu and Prober, 2013; Richter et al., 2014). Short-timescale fluctuations in arousal are commonly referred to as alertness or vigilance (Oken et al., 2006; Lee and Dan, 2012; McGinley et al., 2015); a high-alertness state can increase sensory gain and improve behavioral performance (Harris and Thiele, 2011; Maimon, 2011; McGinley et al., 2015)—often quantified as shorter reaction times (RTs)—during stimulus-detection tasks (Freeman, 1933; Broadbent, 1971; Aston-Jones and Cohen, 2005), although hyper-arousal can be detrimental to performance in more complex tasks (Diamond et al., 2007; McGinley et al., 2015). Alertness is also an essential permissive signal for the orienting and executive aspects of attention (Robbins, 1997; Harris and Thiele, 2011; Petersen and Posner, 2012) and may influence other multifaceted internal states and behaviors (Pfaff et al., 2008; Anderson, 2016). The noradrenergic locus coeruleus has been implicated as a critical mediator of alertness (reviewed in Aston-Jones and Cohen, 2005), with some evidence for the role of basal forebrain cholinergic cells (Harris and Thiele, 2011; Lee and Dan, 2012; Pinto et al., 2013; Hangya et al., 2015; Reimer et al., 2016). However, unlike with sleep/wake states, the contributions of most other neuromodulatory systems to alertness have not yet been explored to test hypotheses for potential alternative sources of neuromodulation (Marrocco et al., 1994; Robbins, 1997).
Unbiased identification of alternative alertness systems might benefit from a brain-wide functional screening approach. However, methods that identify active cells through immediate early gene expression do not have the temporal resolution needed to capture alertness fluctuations on the order of seconds (Guenthner et al., 2013; Renier et al., 2016; Ye et al., 2016), precluding such a screen in mammals. We therefore chose larval zebrafish as a system to examine the relationship between neuromodulation and alertness; since these vertebrates are small and transparent, all neurons are optically accessible for fast-timescale activity imaging during behavior (Ahrens and Engert, 2015). Neuromodulatory systems are genetically and anatomically conserved among vertebrates, and zebrafish share a number of neuromodulatory cell types and circuits with mammals but have many fewer total cells (O’Connell, 2013; Chiu and Prober, 2013; Richter et al., 2014).
A potential limitation of this approach would be that brain-wide imaging alone does not permit real-time molecular and genetic identification of the diverse cell types that will be represented in recordings. Therefore, we developed a method to molecularly identify large numbers of involved cell types from brain-wide neural activity recordings during behavior, which we term Multi-MAP (multiplexed alignment of molecular and activity phenotypes). Application of this method led to identification of multiple neuromodulatory systems that correlate with the internal state of alertness, that exhibit highly conserved dynamics from fish to mammals, and that modulate behavioral and physiological expression of the alert brain state in mammals.
RESULTS
A Behavioral Measure of Alertness in Zebrafish
We first sought to develop a behavioral task to measure alertness in larval zebrafish. Based on studies in humans (Freeman, 1933; Eason et al., 1969; Broadbent, 1971), we developed an assay to measure alertness through sensorimotor RT. We positioned zebrafish (7–9 days post fertilization) with agarose head restraint and monitored tail movements in response to visual inputs (Figure 1A). We used looming-dot stimuli to evoke escape-or turn-like tail movements, which can be distinguished from spontaneous forward swims in these fish (Temizer et al., 2015; Dunn et al., 2016). We scored RT as the time from stimulus onset to the first large-angle turn and excluded trials in which fish executed premature movements or failed to move during the stimulus (STAR Methods). We presented fish with ~180–200 identical sensory stimuli across a behavioral session, which resulted in a distribution of RTs (Figures 1A and 1B), but no habituation between the first and second half of the session (n = 34 fish, paired t test, p = 0.988).
Figure 1. Variability in Sensorimotor Reaction Time Reflects the Internal State of Alertness in Larval Zebrafish.

(A) Schematic of behavioral apparatus and example data. Tethered zebrafish are presented with a looming dot stimulus, and tail movements are recorded with an infrared (IR) camera. (Right) Trials in an example fish. Black dots indicate escape onset.
(B) Histogram of RTs for an example fish.
(C) Schematic of combined behavior and heart-rate monitoring with two-photon cardiac imaging in Tg(cmlc2:GFP) fish. (Right) Example two-photon images of GFP+ heart when dilated and constricted (each image is an average of six frames). White brackets indicate ventricle cross section.
(D) Example of heart-rate time series together with behavior across two trials.
(E) Summary data, n = 6. See Figure S1A for individual fish example. Solid line: linear regression; shaded region: 95% confidence interval.
See also Figure S1.
In humans and other mammals, fast RTs indicate a higher alertness state than slow RTs do (Freeman, 1933; Eason et al., 1969). To test if this relationship would be present in zebrafish, we measured heart rate during behavior—a common measure of alertness and arousal in other species (Bonnet and Arand, 1997; Thayer and Lane, 2000). We used two-photon microscopy to measure contractions in the cardiac ventricle of fish expressing GFP in the heart (Tg(cmlc2:GFP)) in order to quantify the mean heart rate preceding stimulus onset (Figure 1C and STAR Methods). We found that heart rate was highest preceding fast RT trials and lowest preceding slow RT trials (Figures 1D, 1E, and S1A). Our observations suggest that RT in this task is a reliable indicator of trial-to-trial variation in alertness in zebrafish and does not simply reflect total movement rate (Figure S1B). Furthermore, we found that exogenous manipulations of alertness altered task performance; as in human subjects (Lieberman et al., 1987; Lim and Dinges, 2008), increasing alertness with acute caffeine exposure increased heart rate and decreased RTs, whereas decreasing alertness with sleep deprivation decreased heart rate and increased omissions (Figures S1C–S1J). Performance in the optomotor response (Portugues and Engert, 2009) was similarly affected by caffeine and sleep deprivation (Figure S1K and S1L). High levels of arousal did not impair performance in either task, suggesting that the simple RT behavior we examine here does not exhibit the inverted U-shaped arousal-response relationship that would be characteristic of more complex behaviors that require decision making (Diamond et al., 2007; McGinley et al., 2015). Finally, we found that variability in RT was not driven by variability in sensation; the activity of looming responsive neurons (Temizer et al., 2015; Dunn et al., 2016) was not correlated with RT (Figures S1M and S1N), suggesting that variability is driven by internal brain states. Having validated our RT behavior as a measure of alertness in larval zebrafish, we applied a brain-wide cellular-resolution imaging approach (Ahrens and Engert, 2015) to globally screen for neuromodulatory cell types correlated with this rapidly fluctuating brain state.
A Brain-wide Screen for Neuromodulatory Neuron Activity Linked to Brain State
To record cellular-resolution neural activity during RT behavior, we used two-photon microscopy to image throughout the brain of larval zebrafish expressing the genetically encoded Ca2+ indicator GCaMP6s (expressed in nearly all neurons and nuclear-localized, using Tg(elavl3:H2B-GCaMP6s); Vladimirov et al., 2014). In each fish, we recorded over 16 Z planes for ~50–60 min, capturing the activity of ~25,000–35,000 neurons across the brain at ~1.3–2.8 vol/s (STAR Methods). To identify neuromodulatory neurons from these recordings, we developed MultiMAP to classify cell type by means of post-hoc molecular labeling and volume registration. After recording neural activity during behavior, we fixed the entire fish, labeled multiple neuromodulatory cell types with fluorophore-linked antibodies, and imaged the brain again (Figure 2A). We used antibodies to specifically target proteins expressed by neuromodulatory neurons, including cholinergic, dopaminergic, noradrenergic, serotonergic, and multiple types of peptidergic neurons (STAR Methods).
Figure 2. Whole-Brain Cellular-Resolution Registration of Activity and Molecular Features with MultiMAP.

(A) Schematic of sample-handling pipeline.
(B) Schematic of data-handling pipeline.
(C) Orthogonal planes (XY, YZ, and XZ) and x, y zoom of signal overlays from a single fish. White lines indicate location of cross section. The cell types at bottom right are the cholinergic tegmentum (cyan), the serotonergic dorsal raphe nucleus (red), and the noradrenergic locus coeruleus (yellow). Scale bars: 100 μm (left) and 25 μm (right). See Figure S2 and Movie S1 for additional details and examples.
(D) Spinal projection neurons (SPNs) in Tg(elavl3:H2B-GCaMP6s) fish are back-labeled through injection of Texas Red Dextran. Scale bar: 50 μm.
(E) Schematic of data-handling pipeline, where GCaMP volumes are used for registration, and co-imaged SPN volumes are used to assess accuracy.
(F) Z-projections through the midbrain and hindbrain of live (red) and fixed (cyan) SPN samples are overlaid before (top) or after (bottom) registration of GCaMP volumes. Scale bar: 50 μm.
(G) Mean distance between matched cell centers (STAR Methods) before and after registration.
Bars are mean ± SEM. Two-tailed Wilcoxon signed-rank test, n = 4 fish. ***p < 0.001. See also Figure S2, Movie S1, and STAR Methods.
We registered the fixed GCaMP volume (associated with antibody labels) to the live GCaMP volume (associated with time-series Ca2+ recordings), using non-rigid B-splines interpolation (Figures 2B, S2A, and S2B and STAR Methods; Rohlfing and Maurer, 2003). This strategy yielded cellular-resolution alignment of GCaMP-labeled neurons in fixed and live brains (n = 34; Figures 2C, S2B, and S2E and Movie S1). We used a similar registration pipeline to assign each recorded neuron to an anatomical region from the Z-Brain Atlas (Figures 2B and S2C and STAR Methods; Randlett et al., 2015). After these steps, each neuron recorded during behavior could be classified by the overlap of its location with the location of registered antibody labels and anatomical labels (Figure S2D). We quantified this registration procedure using a held-out fluorescent channel present in both live and fixed volumes (Figures 2D and 2E and STAR Methods) and confirmed that GCaMP-based registration enables accurate cellular-resolution alignment of fixed-brain cell-type labels to live brains (Figures 2F and 2G). MultiMAP is also compatible with fluorescent in situ hybridization (Figure S2F), enabling cell identification based on gene expression.
The MultiMAP approach enables registration of large-scale activity measurements with multiple molecular markers in single animals—a feat not achievable with conventional transgenic or other targeted indicator expression strategies. This method allows for real-time neural activity to be recorded from any cell type, or from many cell types at once in the same animal, without the need for development of viral or transgenic strategies. We next used MultiMAP to screen for neuromodulatory cell types defined by activity correlated with the state of alertness.
Multiple Neuromodulators Are Correlated with Alertness
We identified neuromodulatory cell types by the intersection of antibody labeling and anatomical region (Figure S2D), resulting in delineation of 22 discrete neuromodulatory populations across the brain (Figure S3). To determine if activity patterns of identified neuromodulatory neurons were related to alertness, we measured the correlation between post-stimulus RT and mean neural activity preceding stimulus onset (Figures 3A and 3B and STAR Methods). We focused on the time period immediately preceding stimulus onset so that neural activity would approximate the animal’s internal state at the time of sensory input rather than sensory input or motor output itself. Neurons with negative correlation coefficients by definition have higher activity preceding faster (lower) RTs, indicating correlation with high-alertness states (Figure 3B). Conversely, cells with positive correlation coefficients are correlated with low-alertness states. We assessed correlations for each identified neuron (n = 2,328 classified cells across 34 fish) and grouped neurons by neuromodulatory cell type (Figure S3) to obtain summary statistics (Figure 3C and STAR Methods).
Figure 3. Diverse Neuromodulatory Cell Types Are Correlated with Alertness States.

(A) Example cart+ tegmentum neuron, with pre-stimulus time series and onset to first escape-like tail movement for each trial (black dots), ordered by RT.
(B) Example data from individual th+ locus coeruleus neuron (top) and cart+ tegmentum neuron (bottom). (Left) Overlays of antibody label (red) with live GCaMP (green) in example Z plane after volume registration (neurons identified with white arrow). Scale bars: 100 μm. (Right) Scatterplot of mean pre-stimulus neural activity and RT. Solid line: linear regression; shaded region: 95% confidence interval.
(C) Summary data from 22 neuromodulatory cell types, displaying correlation coefficients from comparison of RT and pre-stimulus neural activity. Bars are mean ± SEM, n = 34 fish. Significance values are determined by one-sample Wilcoxon signed-rank tests and false discovery rate correction for multiple comparisons. Groups are colored according to their correlations: blue (negative correlation), green (positive correlation), or black (no correlation).
See Figure S3 for details and examples of each cell type and Figure S4 for additional functional characterization. *p < 0.05, **p < 0.01, ***p < 0.001.
In agreement with studies in primates and rodents (Aston-Jones and Cohen, 2005; Joshi et al., 2016; Reimer et al., 2016), we found that noradrenergic locus coeruleus neurons were significantly correlated with alertness states, displaying greater activity prior to fast RT trials (Figures 3B and 3C). We also found several other neuromodulatory cell types correlated with high alertness states: cocaine- and amphetamine-regulated transcript (CART) neurons in the tegmentum (Figure 3B); cholinergic neurons in the tegmentum; and dopaminergic, serotonergic, and neuropeptide-Y-expressing cells in the hypothalamus (Figures 3C and S3). We also found that somatostatin-expressing cells in the hypothalamus were correlated with low-alertness states. The magnitude and variability in these correlation coefficients were comparable to previous reports linking locus coeruleus cell spiking to pupil size (a measure of arousal) in primates (Joshi et al., 2016).
We also analyzed the correlations of these neuromodulatory cell types with other behavioral variables and found that partially overlapping sets of multiple neuromodulatory cell types were correlated with distinct behavioral and internal states, including locomotion and response vigor (Figures S4A–S4F). Furthermore, we found that most alertness-correlated cell types could be recruited by exogenous induction of alertness with caffeine application (Figures S4G–S4I). Together, these findings indicate that a distributed set of neuromodulatory cell types exhibit activity modulation in concert with moment-to-moment fluctuations in alertness.
Correlated and Cooperative Activity among Neuromodulatory Subpopulations
Our observation that brain-state-encoding activity spans multiple neuromodulatory systems prompted us to search for correlations among these cell types. While many neuromodulatory cell types are anatomically interconnected (Saper et al., 2010; Lee and Dan, 2012; Chiu and Prober, 2013; Richter et al., 2014), their joint dynamics in vivo have not been directly observed. MultiMAP allowed recording of the activity of several molecularly and anatomically identified cell types simultaneously (2–16 cell types), which would be challenging with traditional transgenic or viral strategies. We used recordings from fully embedded fish deprived of sensory input in order to obtain spontaneous correlations among neuromodulatory neurons (Figures 4A and 4B). We classified neurons as belonging to the alertness-correlated group (alertness+; the six neuromodulatory cell types identified with significant negative correlation coefficients in Figure 3C) or the group not correlated to alertness (alertness−; all neuromodulatory cell types without significant correlation coefficients in Figure 3C) and assessed pairwise correlations for simultaneously recorded cell types: alertness+/alertness+ pairs, alertness+/alertness− pairs, and alertness−/alertness− pairs (magenta, blue, and gray in Figure 4A, respectively). We found greater correlations among alertness+ cell types compared to other pairs of neuromodulatory cell types (Figure 4C), suggesting that these distinct neuromodulatory systems are partially coupled. We next analyzed correlations among these neurons during the RT task and found that the correlations among alertness+ neurons were elevated during fast RT trials (Figure 4D).
Figure 4. Correlated and Cooperative Activity of Neuromodulatory Cell Types.

(A) Schematic of analysis. Correlations are assessed between time series recorded from neurons classified as alertness+ or alertness−.
(B) Simultaneous recordings from multiple neuromodulatory cell types in an example fish. d: dorsal, v: ventral. Each line is one neuron.
(C) Cumulative density plot of correlations between alertness+/alertness+ pairs (magenta), alertness+/alertness− pairs (cyan), and alertness−/alertness− pairs (gray). n = 6 fish, with bar plot of same data as inset. Two-sided Kolmogorov-Smirnov tests, +/+ versus +/−, D = 0.407, p < 0.01; +/+ versus −/−, D = 0.436, p < 0.005; +/− versus −/−, D = 0.087, p = 0.57.
(D) Correlations between cell types measured in trials with fast (bottom 25th percentile) versus slow (top 25th percentile) RTs. Mean ± SEM, paired t tests. Color scheme as in (A) and (C).
(E) Correlation between true RT and RT predicted from linear regression using simultaneously recorded alertness+ (black) and alertness− (gray) neurons (permutation tests between + and − and corrected for multiple comparisons).
(F) Correlation between true RT and RT predicted from linear regression using one to three distinct neuromodulatory cell types as inputs. Alertness+ cells: n = 34, 26, and 6 for 1, 2, and 3 cell types, respectively, one-way ANOVA, F(2,65) = 8.05, p < 0.001; alertness− cells: n = 32, 25, and 6 for 1, 2, and 3 cell types, respectively, one-way ANOVA, F(2,62) = 2.75, p > 0.05. Mean ± SEM. Color scheme as in (E).
*p < 0.05, **p < 0.01, ***p < 0.001. See also Figures S3 and S4.
While alertness+ cell types were preferentially correlated with each other, they were not completely synchronized, suggesting that the activity of each cell or cell type may carry distinct information. We used linear regression to ask whether the pre-stimulus activity of multiple neuromodulatory cells confers an advantage for predicting RT from neural activity and found that prediction of RT improved with increasing numbers of alertness+ neurons compared to alertness− neurons (Figure 4E). We next averaged neural activity within a cell type and asked whether multiple unique cell types contribute to prediction. Using fish in which at least three distinct alertness+ cell types were recorded simultaneously, we found that the joint activity of multiple cell types was better at predicting RT than single cell types (Figure 4F); this was not the case for alertness − cell types recorded in the same fish. Together, these data indicate that neuromodulatory cell types correlated with alertness are also preferentially correlated with one another—even in the absence of a behavioral task. This coupling increased during enhanced alertness states, and the joint activity of multiple distinct cell types was a more reliable indicator of upcoming alertness-related behavior.
Conserved Cell-Type-Specific Neural Dynamics in Mammals
Many neuromodulatory systems are genetically and anatomically conserved across vertebrates (O’Connell, 2013; Chiu and Prober, 2013; Richter et al., 2014), but a direct comparative study of their neural dynamics has not been conducted. We hypothesized that the brain-state-related neural dynamics we discovered in larval zebrafish may be conserved in mammals. To test this hypothesis directly, we carried out targeted recordings from neuromodulatory cell types in mice behaving in an RT task to determine whether common alertness-related dynamics are exhibited by genetically and anatomically conserved vertebrate cell types. We chose seven cell types to examine in mice (Figure S5); these cell types were identified as homologous or putatively homologous based on neurotransmitter identity, anatomical location, and gene expression (STAR Methods).
To assess alertness in behaving mice, we measured RT in a head-fixed auditory detection task (Figure 5A). We trained water-restricted mice to lick in response to an auditory cue; a drop of water was given if mice contacted the lick port within 1 s of stimulus onset, and we quantified RT as the time from stimulus onset to the first lick (STAR Methods). As in zebrafish, we observed a distribution of RTs (Figure 5B) and no habituation between the first and second half of the session (n = 29 mice, paired t test, p = 0.64). To validate that RT variability in this task reflects alertness state, we measured pupil diameter—a well-established measure of alertness and arousal in rodents and primates (Figure S6A and STAR Methods; Aston-Jones and Cohen, 2005; McGinley et al., 2015). As expected, we found that pupil diameter was largest before fast RTs and smallest before slow RTs (Figure S6B) and did not exhibit an inverted U-shaped relationship. Additionally, we found that potentiation of alertness with caffeine decreased RTs but did not increase premature responding (Figures S6C–S6E), similar to our observations in larval zebrafish (Figures S1E and S1J). Therefore, this learned RT task in mice, similar to the innate RT task in zebrafish, can be used to infer alertness state due to the linear relationship between RT and physiological measures of alertness and sensitivity to exogenous manipulations of alertness.
Figure 5. Conservation of Cell-Type-Specific State-Related Activity in Mammals.

(A) Schematic of mouse auditory RT task.
(B) Example recording from GCaMP+ CART neurons in the Edinger-Westphal nucleus of CART-IRES2-Cre mice, with pre-stimulus time series and onset to first lick for each trial, ordered by RT (black dots denote licks).
(C) Example recordings from the locus coeruleus of a TH-IRES-Cre mouse (top) and the Edinger-Westphal nucleus of a CART-IRES2-Cre mouse (bottom). (Left) Location of recording region and co-labeling of antibody label with GCaMP expression. (Right) Scatterplot of mean pre-stimulus neural activity and RT. Solid line: linear regression; shaded region: 95% confidence interval. Scale bars: 100 μm.
(D) Summary data of recordings from seven cell types displaying correlation coefficients from comparison of RT and pre-stimulus neural activity. Mean ± SEM, n = 29 mice (n = 3, 3, 3, 3, 4, 6, 3, and 4, from left to right). Significance values were determined by permutation tests with the eYFP control group and false discovery rate correction for multiple comparisons.
(E) Summary data from zebrafish neuromodulatory cell types homologous to the cell types recorded from mice in (D) (see Figure S5). Cell types are presented in the same order as (D), without the eYFP control group. Data are taken from Figure 3C.
*p < 0.05, **p < 0.01, ***p < 0.005. See also Figures S5 and S6.
To measure activity from defined neuromodulatory cell types during this task, we used deep-brain fiber photometry (Gunaydin et al., 2014) to record fluorescence from populations of neurons expressing GCaMP6m (targeted with Cre-dependent viruses in a variety of Cre-recombinase driver transgenic mice; Figures 5A and 5B and STAR Methods). In separate subjects, we recorded from noradrenergic neurons in the locus coeruleus, cholinergic neurons in the lateral dorsal tegmentum, dopaminergic neurons in the A11 nucleus, serotonergic neurons in the dorsal raphe nucleus, CART-expressing neurons in the Edinger-Westphal nucleus, neuropeptide-Y neurons in the arcuate nucleus of the hypothalamus, and somatostatin neurons in the arcuate nucleus of the hypothalamus.
We used fiber photometry recordings to quantify correlations between RT and the pre-stimulus activity of specific neuron types defined by genetics and location (Figures 5B, 5C, and S5). Using a similar analysis as in zebrafish (STAR Methods), we found multiple neuromodulatory cell types in mice that were correlated with alertness (Figure 5D). Furthermore, the alertness-related activity of each cell type was strikingly similar to that of zebrafish (Figure 5E) despite the many differences between these datasets, including phylogenetic class, developmental stage, brain size, neural recording method, and details of the species-suitable behavioral task. These findings reveal that a set of multiple specific neuromodulatory cell types exhibits internal state-dependent neural dynamics that are conserved from fish to rodents and may therefore represent a fundamental feature of the vertebrate brain.
Behavior-Dependent Effects of Cell-Type Manipulations
The correlations we observed between neural activity and brain state indicate that, for each alertness-correlated cell type, neural activity may be directly contributing to alertness or alternatively may instead passively report activity of the driving neuromodulatory cell types through direct or indirect connections. We distinguished between these alternatives using optogenetic activation of each neuromodulatory cell type in behaving mice. Following viral expression of channelrhodopsin in each of the seven neuromodulatory cell types targeted in mice, we activated neurons in the 2 s preceding stimulus onset during the RT task described above (Figure 6A and STAR Methods). We found that unilateral activation of three alertness-correlated cell types (noradrenergic neurons in the locus coeruleus, cholinergic neurons in the lateral dorsal tegmentum, or CART-expressing neurons in the Edinger-Westphal nucleus) was sufficient to decrease mean RT during light ON trials (Figure 6B), whereas stimulation of cell types not correlated to alertness had no effect. We found that activating NPY- or SST-expressing neurons in the arcuate hypothalamus did not have a behavioral effect, suggesting that these cell types passively receive alertness-correlated input but do not themselves contribute directly to the generation of alertness on short timescales.
Figure 6. Behavior-Dependent Effects of Cell-Type Manipulation.

(A) Schematic of mouse behavioral task.
(B and C) Summary data for RT behavior displaying the mean RT in light ON trials normalized to light OFF trials. Bars are mean ± SEM. (B) n = 27 mice (n = 5, 3, 3, 4, 3, 3, 3, and 3, from left to right). (C) n = 18 mice (n = 4, 3, 4, 3, and 4, from left to right).
D) Raw video images and pupil traces for an example CART-IRES2-Cre mouse, with ChR2 stimulation of the Edinger-Westphal nucleus. Mean pupil trace in black. Red dotted line indicates pupil perimeter.
(E and F) Summary data for pupil size displaying the mean size in light ON trials normalized to light OFF trials. Bars are mean ± SEM. (E) n = 27 mice (n = 5, 3, 3, 4, 3, 3, 3, and 3, from left to right). (F) n = 18 mice (n = 4, 3, 4, 3, and 4, from left to right).
For data in panels (B), (C), (E), and (F), significance values were determined by permutation tests with the eYFP control group and false discovery rate correction for multiple comparisons.
*p < 0.05. See also Figures S5 and S6.
To determine the necessity of each of the four alertness-correlated cell types for this behavior, we used bilateral optogenetic inactivation to acutely inhibit neurons for 3 s, beginning 2 s before stimulus onset (Figure 6A). Inactivation of each individual cell type did not produce a significant effect on behavior (Figure 6C), suggesting that this behavior is robust to the suppression of individual cell types. Optogenetic activation or inactivation did not increase indiscriminant licking, as none of these manipulations increased premature responses (Figures S6F and S6G). We also measured the motor behavior of mice in an open-field arena and found minimal effects of short-timescale activation or inactivation on gross measures of movement (Figure S6I) in contrast to long-timescale activation (Carter et al., 2010); the only manipulation that increased locomotion was phasic activation of cholinergic neurons in the lateral dorsal tegmentum. These data suggest that the neuromodulatory mechanisms we address here are not simply producing a general state of motor arousal.
To determine whether these patterns are present for a different measure of alertness, we also performed neural activation and inactivation in the absence of a behavioral task. We measured pupil size during cell-type activation or inactivation in resting head-fixed mice (Figure 6D and STAR Methods). We found that neural activation experiments mirrored effects of neural activation on RT behavior; activating noradrenergic neurons in the locus coeruleus, cholinergic neurons in the lateral dorsal tegmentum, or CART-expressing neurons in the Edinger-Westphal nucleus was sufficient to increase pupil size, but activating other cell types had no effect (Figure 6E). There were no significant differences in pupil-activation latency between these cell types (Figure S6H). We found that bilateral inactivation of cholinergic neurons in the lateral dorsal tegmentum or noradrenergic neurons in the locus coeruleus was sufficient to decrease pupil size (Figure 6F), indicating that these cell types are required for maintaining this physiological expression of alertness in resting mice. When contrasted with data from the RT task, these results suggest that task engagement can influence the robustness of alertness-related behaviors and physiological processes to perturbations.
DISCUSSION
Neuromodulatory systems have long been implicated in the control of global brain states (Getting, 1989; Robbins, 1997; Coull, 1998; Aston-Jones and Cohen, 2005; Oken et al., 2006; Pfaff et al., 2008; Saper et al., 2010; Harris and Thiele, 2011; Maimon, 2011; Bargmann, 2012; de Lecea et al., 2012; Lee and Dan, 2012; Marder, 2012; Anderson and Adolphs, 2014; Chiu and Prober, 2013; Richter et al., 2014; McGinley et al., 2015). Here, we used cell-type-specific neural activity recording—spanning phylogenetically distant vertebrate species—to show that variability in the internal state of alertness during behavior is encoded by a specific set of multiple distinct neuromodulatory cell types. These findings extend previous work establishing that alertness states are encoded by noradrenergic neurons in the locus coeruleus (Aston-Jones and Cohen, 2005; Joshi et al., 2016; Reimer et al., 2016). While the possibility of alternative neuromodulatory systems for control of alertness has been postulated (Marrocco et al., 1994; Robbins, 1997), here we specifically document the many relevant cell types in two vertebrate species and reveal that the set of neuromodulatory circuits encoding alertness is an ancient and fundamental feature of the vertebrate brain.
This discovery of multiple parallel neuromodulatory systems was enabled by our neural activity screening method, MultiMAP, which is based on within-animal cellular-resolution registration of fixed tissue (with its molecular cell-type information) to live tissue (with its real-time cellular-activity information). While matching of fixed labeled tissue with live imaged tissue has been conducted in small sections of neocortex and retina using manual alignment to identify small numbers of cells (Kerlin et al., 2010; O’Connor et al., 2010; Langer and Helmchen, 2012; Baden et al., 2016; Wilson et al., 2017), here, we develop an approach for the entire zebrafish brain through automated registration of tens of thousands of neurons in intact tissue volumes. MultiMAP allowed us to rapidly screen active cell types without constructing transgenic lines for each. Furthermore, by using multiple orthogonal molecular labels in single subjects, we were able to observe the activity of many molecularly defined cell types simultaneously during behavior. In larval zebrafish, this approach can be applied to study the activity of any cell type addressable with immunohistochemistry or in situ hybridization, in any brain region and in any head-restrained behavioral paradigm. Moreover, this approach can be generalized to permit cell-type-specific activity recording in other animals, a feature that may be particularly advantageous for species wherein transgenic approaches are laborious, slow, or not available. This method can also be expanded to allow recording from even more cell types in single subjects using multiple rounds of staining and elution in clarified tissue volumes (Chung et al., 2013; Sylwestrak et al., 2016).
While the noradrenergic locus coeruleus has long been known to regulate alertness, the other conserved alertness-encoding cell types examined in the work shown here have not been previously linked to fast-timescale alertness. However, some of these cell types have been implicated in other forms of arousal or brain state control. For instance, stressors activate centrally projecting neurons in the Edinger-Westphal nucleus that express CART (Kozicz, 2003; Giardino et al., 2012), and cholinergic neurons in the lateral dorsal tegmentum are involved in the regulation of sleep state (Kayama et al., 1992; Van Dort et al., 2015). Thus, cell types such as these may not only be involved in regulating alertness, but also, each may participate in elicitation of different multifaceted internal states for which alertness is recruited as one feature or useful component (as in anxiety, hunger, aggression, copulation, or attention; Aston-Jones and Cohen, 2005; Pfaff et al., 2008; Harris and Thiele, 2011; Anderson and Adolphs, 2014; Anderson, 2016). Many of these multi-feature states are likely to occur together in naturalistic circumstances (such as attention and aggression); as a consequence, naturally elicited alertness is likely to be driven by cooperative action of multiple neuromodulators and in diverse patterns conferring distinct qualities to each of the many possible complex internal states.
We found that two populations in the arcuate nucleus of the hypothalamus, NPY/AGRP-expressing neurons and SST-expressing neurons, were correlated with alertness in fish and mice; however, unlike other alertness-correlated cell types, optogenetic stimulation of these cells did not influence behavior in a manner predicted from activity—failing to enhance (NPY/AGRP) or suppress (SST) alertness. Arcuate neurons could integrate inputs related to the state of alertness without directly contributing to its implementation; such input could be mediated by direct noradrenergic projections from the locus coeruleus (Paeger et al., 2017), which activate NPY/AGRP neurons and inhibit other arcuate cell types. In addition, NPY/AGRP neurons can inhibit other local neurons, potentially including SST neurons, through GABA release (Atasoy et al., 2012). Either or both of these mechanisms could contribute to the neural activity patterns observed. As a central regulator of hunger and feeding behavior (Atasoy et al., 2012; Campbell et al., 2017), arcuate neurons may use such alertness-related input to facilitate food seeking and consumption during periods of heightened arousal.
We observed that individual activation of three alertness-correlated cell types in mice was sufficient both to increase the speed of RT and to dilate the pupil (Figures 6B and 6E), both of which are indications of enhanced alertness. In contrast, inactivation of these cell types was not sufficient to decrease performance in the RT task (Figure 6C) yet was able to decrease pupil size (Figure 6F), a physiological indicator of decreased arousal. These observations can potentially be reconciled by consideration of task demands and anatomical organization of relevant circuits. Interconnectivity among neuromodulatory cell types (Robbins, 1997; Saper et al., 2010; Lee and Dan, 2012; Chiu and Prober, 2013; Richter et al., 2014) could provide an anatomical substrate for the correlated activity we observed; in zebrafish, we observed that neuromodulatory cell types correlated with alertness were also preferentially correlated with one another (Figure 4C), and even more so during high alertness (Figure 4D). Under these circumstances, activation of any individual alertness-related cell type could recruit other alertness-related cell types via excitatory interconnectivity among the relevant correlated neuromodulatory systems, resulting in similar alertness outcomes from recruiting each cell type. Conversely, optogenetic inhibition of individual alertness-related cell types could suppress such cooperative activity below threshold for certain behavioral manifestations, potentially impairing expression of alertness as we observed in the case of pupil size in resting mice (Figure 6F). However, inhibition of individual cell types need not suffice to diminish behavioral alertness, especially for mammals wherein active task engagement can result in recruitment of additional top-down inputs to alertness circuitry from forebrain regions. For example, frontal cortex sends excitatory inputs to locus coeruleus (Jodo et al., 1998) and could compensate for reduced neuromodulatory drive during experimental inactivation in the RT task (Figure 6C), where animals are motivated to maintain alertness in order to acquire rewards. Nonlinear mechanisms in downstream action circuits receiving these modulatory inputs could also give rise to a system that is behaviorally robust to inhibition of only one contributing neuromodulatory cell type.
Hypotheses such as these may be formally tested in future explorations using intersectional genetic and viral strategies (Fenno et al., 2014) to simultaneously inactivate multiple distinct cell types in animals successively exposed to tasks with different motivational demands. Future studies will also be necessary to determine precisely how local circuits (e.g., in neocortex, thalamus, and other forebrain structures) integrate neuromodulatory signals from multiple sources to regulate their information processing dynamics in a state-dependent manner (Lee and Dan, 2012; McGinley et al., 2015). It will be highly informative to compare findings from studies of multiplexed neuromodulation of invertebrate nervous systems (Getting, 1989; Bargmann, 2012; Marder, 2012) with analogous lessons learned using Multi-MAP in larger brains of behaving vertebrates to identify shared or unique mechanisms by which each organism’s full complement of neuromodulatory systems collaborates to implement brain state.
STAR★METHODS
Detailed methods are provided in the online version of this paper and include the following:
KEY RESOURCES TABLE
| REAGENT OR RESOURCE | SOURCE | IDENTIFIER |
|---|---|---|
| Antibodies | ||
| mouse anti-tyrosine hydroxylase | Immunostar | 22941; RRID: AB_572268 |
| rabbit anti-serotonin | Immunostar | 20080; RRID: AB_572263 |
| rabbit anti-orexin | Millipore | 22941 |
| goat anti-orexin | Santa Cruz Biotechnology | sc-8070; RRID: AB_653610 |
| rabbit anti-CART | Abcam | ab192364 |
| rabbit anti-galanin | Millipore | ab5909; RRID: AB_2108517 |
| rabbit anti-neuropeptideVF | Sigma-Aldrich | HPA041733; RRID: AB_10794524 |
| rabbit anti-neuropeptideY | Sigma-Aldrich | N9528; RRID: AB_260814 |
| rat anti-somatostatin | Abcam | ab30788; RRID: AB_778010 |
| rabbit anti-dopamine beta-hydroxylase | Immunostar | 22806; RRID: AB_572229 |
| goat anti-choline acetyltransferase | Millipore | A144P |
| donkey anti-mouse Alexa647 | Jackson ImmunoResearch | 715-606-151; RRID: AB_2340866 |
| donkey anti-rabbit Alexa 594 | Jackson ImmunoResearch | 711-586-152; RRID: AB_2340622 |
| donkey anti-rat DyLight405 | Jackson ImmunoResearch | 712-475-153; RRID: AB_2340681 |
| donkey anti-rat Alexa647 | Jackson ImmunoResearch | 712-606-153; RRID: AB_2340696 |
| donkey anti-goat Alexa647 | Jackson ImmunoResearch | 712-606-147 |
| donkey anti-goat DyLight405 | Jackson ImmunoResearch | 705-475-147; RRID: AB_2340427 |
| Bacterial and Virus Strains | ||
| AAVDJ-Ef1a-DIO-GCaMP6m | Stanford Gene Vector and Virus Core | N/A |
| AAV1-Ef1a-DIO-ChR2-eYFP | Stanford Gene Vector and Virus Core | N/A |
| AAVDJ-Ef1a-DIO-eNpHR3.0-eYFP | Stanford Gene Vector and Virus Core | N/A |
| AAVDJ-Ef1a-DIO-eYFP | Stanford Gene Vector and Virus Core | N/A |
| Experimental Models: Organisms/Strains | ||
| Zebrafish: Tg(elavl3:H2B-GCaMP6s) | Vladimirov et al., 2014 | jf5 |
| Zebrafish: Tg(cmlc2:GFP) | Huang et al., 2003 | N/A |
| Mouse: TH-IRES-Cre | EMMA, Ted Ebebdal | N/A |
| Mouse: SERT-Cre, Slc6a4-Cre | MMRRC | #017260-UCD |
| Mouse: ChAT-Cre | MMRRC | #017269-UCD |
| Mouse: SST-IRES-Cre | The Jackson Laboratory | Jax stock # 013044 |
| Mouse: AGRP-IRES-Cre | The Jackson Laboratory | Jax stock: # 012899 |
| Mouse: CART-IRES2-Cre | The Jackson Laboratory | Jax stock: # 028533 |
| Software and Algorithms | ||
| Python 2.7 | Python | https://www.python.org |
| Statsmodels 0.8.0 | Seabold and Perktold, 2010 | http://www.statsmodels.org/ |
| Scikit-Learn 0.17.0 | Pedregosa et al., 2011 | http://scikit-learn.org/ |
| MATLAB | The MathWorks | https://www.mathworks.com/products/matlab |
| Fiji (ImageJ) | NIH | http://fiji.sc |
| CMTK | Rohlfing and Maurer, 2003 | https://www.nitrc.org/projects/cmtk/ |
CONTACT FOR REAGENTS AND RESOURCE SHARING
Further information and requests for reagents should be directed to and will be fulfilled by the Lead Contact, Karl Deisseroth (deissero@stanford.edu).
EXPERIMENTAL MODEL AND SUBJECT DETAILS
All procedures were approved by the Stanford University Institutional Animal Care and Use Committee.
Zebrafish
We used 7–10 days post fertilization larval zebrafish for this study, bred on a Nacre or Casper background. No statistical methods were used to predetermine sample size, and animal selection was not randomized or blinded. We used Tg(elavl3:H2B-GCaMP6s) fish (Vladimirov et al., 2014) for imaging, registration, and behavioral experiments, and Tg(cmlc2:GFP) fish (Huang et al., 2003) for heart-rate imaging. Fish were group-housed under a 14:10 light:dark cycle until the day of experiments, and were fed with paramecia (Parameciavap) twice daily from 5–6 days post fertilization onward. All testing occurred during the late morning and afternoon.
Mice
We used adult mice for this study (male and female, > P45), consisting of TH-IRES-Cre mice (EMMA, Ted Ebebdal; Lindeberg et al., 2004), SERT-Cre mice (MMRRC, Slc6a4-cre, #017260-UCD), ChAT-Cre mice (MMRRC, #017269-UCD), SST-IRES-Cre mice (The Jackson Laboratory, #013044), AGRP-IRES-Cre mice (The Jackson Laboratory, #012899), and CART-IRES2-Cre mice (The Jackson Laboratory, #028533). All mice were injected unilaterally, bilaterally, or in the midline with 400 nL of either AAVDJ-Ef1α-DIO-GCaMP6m (3 × 10¹² viral particles/ml; Chen et al., 2013), AAV1-Ef1α-DIO-ChR2-eYFP (3 × 10¹² viral particles/ml), AAVDJ-Ef1α-DIO-eYFP (3 × 10¹² viral particles/ml), or AAVDJ-Ef1α-DIO-eNpHR3.0-eYFP (3 × 10¹² viral particles/ml). GCaMP6m (Addgene plasmid # 40754) was a gift from Douglas Kim (Janelia Research Campus) and modified in our lab. No statistical methods were used to predetermine sample size, and animal selection was not randomized. For freely moving behavior in the open field test, the experimenter was blinded. We did not systematically test for differences between male and female mice in this study, due to low and/or uneven numbers of age-matched male and females in each experimental condition. Mice were either group-or singly housed and maintained under a 14:10 reverse light:dark cycle, and had ad libitum access to food and water, until water restriction began (see below). All testing occurred during the morning and early afternoon.
METHOD DETAILS
Zebrafish behavior
For all experiments, larval zebrafish were embedded in 2.5% low melting point agarose (Millipore) in the lid of a 35 mm Petri dish (E&K Scientific). Fish were embedded in agarose for 2–6 hours prior to beginning experiments. Once agarose solidified after embedding, agarose posterior to the pectoral fins was carefully removed with a scalpel, so that the tail was free to move. Petri dishes were placed on the lid of a 100 mm Petri dish (Fisher), with a diffuser screen attached to the bottom with vacuum grease (with a hole cut out for the tail). Behavioral monitoring, stimulus generation, and recording of frame times from the two-photon microscope were achieved with custom software written in MATLAB (MathWorks). Visual stimuli were projected at 60 Hz using a Laser Pico Projector (MicroVision), surrounded by three Red Wratten filters (Kodak) to prevent interference with the two-photon detection system. Visual stimuli were directed off a dichroic mirror to project on the bottom of the Petri dish with the embedded fish. The tail of the fish was illuminated by IR lights from above and behind the fish, and tail movements were filmed at 120 frames per second from below with an AVT Manta G 031 camera (Allied Vision) through a AF-S DX Micro Nikkor 85 mm f/3.5G ED VR macro lens (Nikon). Looming dot stimuli were black disks on a red background, and were presented ~0.5 mm to the right of the fish’s right eye, were initiated as ~1° (0.01 cm diameter) and expanded to ~100°(1.3 cm diameter) over the course of 3.5 s (~0.37 cm/s). Each stimulus in a behavioral session was identical, and were presented with a pseudorandom inter stimulus interval (range = 8 to 12 s). Optomotor stimuli were a black and red checkerboard pattern, presented to a fish ~0.1 cm away (squares = 0.25 cm across; ~100°), that drifted in the caudal to rostral direction (0.4 cm/s), for 10 s at a time, with a pseudorandom inter stimulus interval (range = 8 to 12 s). For exogenous manipulations of alertness, fish were either treated with caffeine (50 mg/L caffeine (Sigma), dissolved in fish water, 45 minutes prior to beginning of behavior), or one night of sleep deprivation (a Petri dish of 5–10 fish was placed on a slowly rotating shaker at room temp overnight in constant light).
Zebrafish two-photon microscopy
Two-photon imaging was performed using an Olympus FVMPE multiphoton microscope (Olympus Corporation), with a resonant scanner, in either unidirectional or bidirectional scanning mode. We used a 16x objective (0.8 NA; Nikon) for most experiments. Heart rate imaging was performed at 2x zoom in a single z-plane with 6x frame averaging, at 8.3 frames/second. Functional brain imaging was performed at 1.1x zoom in 14–16 z-planes, separated by 15 μm, at 1.3–2.8 volumes/second (5000–8000 volumes). After completion of behavior and functional brain imaging, a structural stack was obtained at 1 μm spacing and 16x frame averaging, starting 15 μm above the first z-plane, ending 15 μm below the last z-plane, and repeated 10 times. Fast axial scanning was achieved with a piezo motor coupled to the objective. Fast functional imaging of GCaMP and GFP were conducted at 920 nm. Structural scans in live fish were conducted at 860 nm, in order to obtain the structure of GCaMP+ cells independent of calcium-dependent fluorescence. Structural scans in fixed fish were conducted at 810 nm (DyLight 405 dye), 920 nm (GCaMP), and 1150 nm (Alexa594 and Alexa647 dyes), and split into four spectrally separable PMTs to detect each dye independently. Fixed samples were imaged at each wavelength at 1 μm spacing and 16x frame averaging, and repeated twice. In both live and fixed structural stacks, voxels were 1.4 × 1.4 × 1 μm in size. All images were corrected for axial chromatic aberrations induced by the objective, as determined by measurements of axial displacement from imaging multi-colored beads across each of the four detectors (data not shown). For brain imaging of caffeine-treated fish, fish were fully embedded in agarose and imaged with a 25x objective (1.05 NA; Olympus) at 2.6 volumes/second, for ~6 minutes before and 6 minutes after acute caffeine (50 mg/L) application. For heart imaging under caffeine and sleep deprivation, fish were fully embedded in agarose (right side up or upside down) and resting heart rate was imaged at 15–20 Hz. Fish were either sleep-deprived, treated with caffeine 45 minutes prior to imaging, or treated with vehicle (fish water).
Zebrafish immunohistochemistry
After completion of behavior and imaging, a small block of agarose containing the fish was cut out, submerged in ice-cold PBS, then placed into 4% PFA in phosphate-buffered saline (PBS; pH 7.4, Life Technologies) with 0.2% Triton-X (PBST) in a 1.5 mL tube, overnight on a shaker at 4 °C. Samples were then washed with PBST and left on a shaker at room temperature for 2–4 hours (repeated 2–3 times). Primary antibodies were then applied at 1:200 in PBST, and samples were left on a shaker at 4 °C for 48 hours. Samples were then washed with PBST and left on a shaker at room temperature for 2–4 hours (repeated 2–3 times). Secondary antibodies were then applied at 1:200 in PBST, and samples were left on a shaker at 4 °C for 48 hours. Samples were then washed with PBST and left on a shaker at room temperature for 2–4 hours (repeated 2–3 times). At this point, whole-mount zebrafish samples (still in their agarose block) were re-mounted in agarose on a Petri dish lid, and imaged again under the two-photon microscope.
The primary antibodies used were: mouse anti-tyrosine hydroxylase (Immunostar, 22941), rabbit anti-serotonin (Immunostar, 20080), rabbit anti-orexin (Millipore, AB3704), goat anti-orexin (Santa Cruz Biotechnology, sc-8070), rabbit anti-CART (Abcam, ab192364), rabbit anti-galanin (Millipore, ab5909), rabbit anti-neuropeptideVF (Sigma, HPA041733), rabbit anti-neuropeptideY (Sigma, N9528), rat anti-somatostatin (Abcam, ab30788), rabbit anti-dopamine beta-hydroxylase (Immunostar, 22806), and goat anti-choline acetyltransferase (Millipore, A144P). Secondary antibodies used were donkey anti-mouse Alexa647 (Jackson Immuno Research, 715-606-151), donkey anti-rabbit Alexa 594 (Jackson Immuno Research, 711-586-152), donkey anti-rat DyLight405 (Jackson Immuno Research, 712-475-153), donkey anti-rat Alexa647 (Jackson Immuno Research, 712-606-153), donkey anti-goat DyLight405 (Jackson Immuno Research, 705-475-147), and donkey anti-goat Alexa647 (Jackson Immuno Research, 705-606-147). The labeling pattern observed with these antibodies closely resembled expression patterns of genes encoding these proteins or other neurotransmitter-related proteins, as previously observed with in situ hybridization (antibody target, gene): hypocretin-hcrt (Prober et al., 2006), cocaine- and amphetamine-regulated transcript (CART)-cart2 (Thisse and Thisse, 2004), galanin-gal (Podlasz et al., 2012), neuropeptide Y-npy (Mathieu et al., 2002), neuropeptide VF-npvf (Yelin-Bekerman et al., 2015), somatostatin-sst1.1 (Herget and Ryu, 2015), serotonin-slc6a4a/b (Norton et al., 2008), tyrosine hydroxylase-th1 (Ryu et al., 2006; Filippi et al., 2010), dopamine beta-hydroxylase-dbh (Holzschuh et al., 2003; Filippi et al., 2010), and choline acetyltransferase-vachta (Hong et al., 2013).
Zebrafish in situ hybridization
After completion of live imaging (zoomed in, focused on hypothalamus), the fish was removed from agarose, submerged in ice-cold PBS, then placed into 4% PFA in PBS overnight at 4 °C. Afterward, protocols were followed as detailed in Choi et al. (2016), using the hybridization chain reaction (HCR) technique. Twelve DNA 20-mer probes were designed against hypocretin (hcrt) mRNA (Yelin-Bekerman et al., 2015) using Stellaris software (LGC Biosearch Technologies), with added ‘B1’ amplifiers to the 5′ and 3′ ends of each probe, and B1-linked Alexa 647 hairpins (Molecular Instruments, Caltech). Fish were then re-mounted in agarose on a Petri dish lid (in SSCT), and imaged again under the two-photon microscope. Endogenous GCaMP6s fluorescence was sufficiently preserved under these conditions, and therefore no anti-GFP stain was required.
Volume registration and cell-type identification
Volumes were first created by averaging across imaging cycles (2 cycles for fixed samples, 10 cycles for live samples), and saved as .nrrd files in a mm scale. These volumes were live GCaMP, fixed GCaMP, each antibody channel, Z-brain atlas Tg(elavl3:H2B-RFP) volume, and each Z-brain mask (294 in total; Randlett et al., 2015). Z-brain volumes were generated by exporting sparse MATLAB arrays as .nrrd files. Volumes were moved into Amazon Web Service’s cloud computing environment (c3.8xlarge instance), where the Computational Morphometry Toolkit (CMTK; Rohlfing and Maurer, 2003) was installed. The fixed GCaMP volume was aligned to the live GCaMP volume using rigid affine and non-rigid b-splines approaches (Figure S2A). Once the final transformation was determined, the transformation coordinates were applied to the fixed GCaMP volume and each of the antibody volumes. In a similar manner, the Z-brain atlas Tg(elavl3:H2B-RFP) volume was aligned to the live GCaMP volume, and the resulting transformation was applied to the Z-brain Tg(elavl3:H2B-RFP) volume and each of the Z-brain mask volumes. From each of these volumes now aligned to the live GCaMP volume, z-planes were extracted that correspond to the z-planes with activity recorded (every 15 μm, from 15 μm below the dorsal extent and 15 μm above the ventral extent). For each antibody channel z-plane, antibody+ cell bodies were manually selected in Fiji/ImageJ (Schindelin et al., 2012), and a binary image was saved. ROIs identified from live-imaged z-planes were identified as belonging to a neuromodulatory group by the intersection of antibody+ cells and z-brain masks (see Figure S2D). An ROI was included in a neuromodulatory group of interest if 100% of the pixels in the ROI overlapped with the relevant Z-brain mask (indicating an anatomical region) and > 75% of pixels overlapped with antibody+ cell in the relevant antibody channel. Dopaminergic and noradrenergic neurons were distinguishable within a single tyrosine hydroxylase stain, using segmentation with the Z-brain atlas (confirmed with dual tyrosine hydroxylase and dopamine beta-hydroxylase staining, data not shown). For spinal projection neuron labeling, Texas Red Dextran (10000 mW, lysine fixable; Invitrogen, D1863) was pressure-injected into the spinal cord of 6 days post fertilization zebrafish anesthetized with 0.1% MS-222 (Sigma) and fully embedded in agarose. Fish were cut out of agarose and placed in normal fish system water to recover for 24–36 hours before live imaging. Cell distance among spinal projection neurons was defined by identifying the center of each soma in eight neurons per fish (in z-projections), in cells manually identifiable in all three images (live, fixed, fixed+registered). The measured cells were the Mauthner cell, MeLr, MeLc, and CaD, on both sides (Orger et al., 2008). The x-y distance between the same cell in each image was measured in Fiji/ImageJ.
Selection of cell types in mice
We used gene expression atlases (Lein et al., 2007) and published papers to find homologous or putatively homologous cell types between larval zebrafish and mice:
Dopaminergic posterior tuberculum/A11: In both fish and mammals these nuclei contain the only dopaminergic cell type that projects to the spinal cord (Tay et al., 2011; Koblinger et al., 2014), and are specified by the expression of common transcription factors (Löhr et al., 2009).
Serotonergic dorsal raphe neurons: In both fish and mammals these cells release serotonin, reside in the midline of the hind-brain/brainstem (Abrams et al., 2004; McLean and Fetcho, 2004), express the serotonin transporter gene slc6a4 (Norton et al., 2008), and project broadly throughout the forebrain, midbrain, and hindbrain (Abrams et al., 2004; McLean and Fetcho, 2004).
Noradrenergic locus coeruleus: In both fish and mammals these cells reside in the hindbrain/brainstem, express dopamine beta hydroxylase and tyrosine hydroxylase (McLean and Fetcho, 2004), and project diffusely throughout the brain, including extensive forebrain innervation (McLean and Fetcho, 2004; Aston-Jones and Cohen, 2005; Tay et al., 2011).
Somatostatin neurons in the hypothalamus: Somatostatin neurons with interesting functional properties were found in the zebrafish hypothalamus (Figures 3C and S3), and therefore we searched for somatostatin-expressing neurons in the mammalian hypothalamus. We found the highest levels of expression in the arcuate nucleus (Palkovits et al., 1976; Herget and Ryu, 2015), and therefore chose to investigate these cells as a putative homologous cell type. We also noted that NPY cells and somatostatin cells were close to one another in fish (Figure S3), and are both localized to the arcuate nucleus in mammals (Palkovits et al., 1976; Atasoy et al., 2012; Campbell et al., 2017),.
Cholinergic tegmentum/lateral dorsal tegmentum: In both fish and mammals, these cells are nearby but medial to the noradrenergic locus coeruleus and lateral to the midline serotonergic dorsal raphe in the hindbrain/brainstem (Figures 2C and S3; Clemente et al., 2004; Wang and Morales, 2009; Lee and Dan, 2012).
Neuropeptide-Y (NPY) cells in the hypothalamus: In both fish and mammals, NPY-expressing cells can be found in the hypothalamus (Figure S3; Mathieu et al., 2002; Atasoy et al., 2012). While NPY cells can be found in multiple hypothalamic nuclei in mammals (in addition to other areas), we targeted the area of densest expression, the arcuate nucleus, where these neurons also express agouti-related protein (AGRP) and GABA (Atasoy et al., 2012).
Cocaine and amphetamine-related transcript (CART) cells in the tegmentum/Edinger-Westphal nucleus: In fish, we found prominent expression of CART in a small midbrain cluster of midline neurons in the tegmentum (Figures 3B and S3). While CART is expressed in many regions of the mammalian brain (Couceyro et al., 1997), it is prominent in the small midline Edinger-Westphal nucleus in the midbrain (Giardino et al., 2012). In both fish and mice, this region of CART expression is relatively close to the cholinergic tegmentum, noradrenergic locus coeruleus, and serotonergic dorsal raphe (Figure S3). CART neurons in the mammalian Edinger-Westphal nucleus are centrally projecting, in contrast to the preganglionic ChAT+ neurons in this nucleus that mediate premotor pupillary responses (Giardino et al., 2012).
Mouse surgery
Mice were anesthetized under 3% isofluorane, and maintained with 1%–2% isofluorane in a stereotactic frame. Ophthalmic ointment was applied to prevent eyes from drying. The skull was exposed under aseptic conditions, and a small craniotomy was performed over the injection site. 300–400 nL virus was injected with a 10 μL syringe and a beveled metal needle (World Precision Instruments), at a rate of 150 nl/min, controlled by an injection pump (Harvard Apparatus). The syringe was slowly withdrawn 5–10 minutes after completion of injection. Following virus injection a 400 μm (for photometry) or 200 μm (for optogenetics) fiber (Doric) was slowly lowered to within 50–100 μm of the injection site and, together with a custom stainless steel headplate extending in the medial-lateral orientation, was fixed in place using tissue adhesive (3M Vetbond) and adhesive cement (C&B Metabond, Parkell). For mice used in optogenetic inactivation studies, viral injections and 200 μm fiber implants were performed bilaterally, with the exception of the midline Edinger-Westphal nucleus, where a single midline fiber sufficed. Mice were administered 0.05 mg/Kg Buprenorphine for analgesia, and placed on a warming pad to recover from isofluorane anesthesia. After recovery of coordinated locomotion, mice were returned to a clean home cage, and their health was monitored daily for the subsequent week. Mice begin water restriction one to two weeks after surgery. Injection coordinates were: −2.0 A/P, 0.5 M/L, −4.2 D/V (nucleus A11), −5.45 A/P, 1.0 M/L, −3.2 D/V (locus coeruleus), −5.0 A/P, 0.6 M/L, −3.0 D/V (lateral dorsal tegmentum), −4.35 A/P, 0.2 M/L, −2.1 D/V (dorsal raphe nucleus), −1.5 A/P, 0.1 M/L, −5.6 D/V (arcuate nucleus), −3.65 A/P, 0.0 M/L, −3.0 D/V (Edinger-Westphal nucleus). eYFP control mice were derived from multiple genotypes; GCaMP controls: 1 TH-IRES-Cre (locus coeruleus), and 2 SST-IRES-Cre (arcuate nucleus); head-fixed ChR2 controls: 3 ChAT-Cre (lateral dorsal tegmentum), 1 TH-IRES-Cre (locus coeruleus), and 1 CART-IRES2-Cre (Edinger-Westphal nucleus); open field test ChR2 controls: 2 ChAT-Cre (lateral dorsal tegmentum) 1 TH-IRES-Cre (locus coeruleus), and 1 CART-IRES2-Cre (Edinger-Westphal nucleus); NpHR controls: 3 TH-IRES-Cre (locus coeruleus) and 1 CART-IRES2-Cre (Edinger-Westphal nucleus).
Mouse behavior
Mice were water restricted for 1 day prior to beginning training, and were maintained at > 90% of their pre-deprivation weight throughout training. Mice were habituated to head fixation and trained to obtain auditory stimulus-triggered water rewards by contacting a lick port with their tongue, over the course of 4–5 days. Mice were head-fixed in a plastic tube using the implanted custom stainless steel headplate and mounting system. Behavioral responses were recorded using a custom lickometer built using a capacitive touch sensor (TinkerKit). The behavioral protocol was run on a real-time microcontroller (Arduino Due) using software communicating with MATLAB (MathWorks). The behavioral protocols were implemented using Bpod (courtesy of Josh Sanders, Cold Spring Harbor Lab). Sounds were delivered using a calibrated electrostatic speaker (Tucker Davis Technology, ES1) positioned ~10 cm from the mouse’s head, and were generated by custom MATLAB software and played through a data acquisition board (National Instruments, NI PCIe-6321). Tones were 5 kHz, 68 dB, 500 ms in duration, and presented at a pseudorandom inter-stimulus interval (range = 2.1–5 s). For caffeine experiments, trained mice were injected with caffeine (20 mg/Kg, i.p., Sigma) dissolved in saline or saline alone 20 min before behavioral testing.
For head-fixed optogenetic experiments, mice received 20 Hz stimulation for 2 s prior to stimulus onset, delivered with a 473 nm DPSS laser (OEM Laser Systems) or constant illumination for 3 s (beginning 2 s prior to stimulus onset) with a 589 nm DPSS laser (OEM Laser Systems) and a Master-8 pulse generator (A.M.P.I.). Stimulation occurred on 50% of the trials in pseudorandom order. Light intensity was 7–10 mW from fiber tip.
For freely moving optogenetic experiments, the experimenter was blinded to the condition. Mice acclimated to the behavior room for 1 hour before testing. Mice were connected to patch cords, allowed to recover for 3–5 minutes, then placed in the center of the open field chamber (50 cm × 50 cm, white). After a 5-minute acclimation period, 5-minute serial laser OFF and ON epochs commenced (OFF, tonicON, OFF, phasicON, OFF). For ChR2 animals, a 473 nm laser was pulsed (5 ms pulse with) tonically (5 Hz) or phasically (20 Hz for 500 ms every 2 s), during the 1st and 2nd stimulate epochs, respectively (with 5 minute laser off trials interspersed). For NpHR animals, the 589 nm laser constantly illuminated during the single stimulation epoch, with laser off epochs before and after (OFF, ON, OFF). Light intensity was 7–10 mW from the fiber tip. Behavior was recorded and automatically scored using BiObserve Viewer software.
Mouse pupil tracking
A high-speed camera (AVT Manta, G-032B) with a 24 mm/F1.4 lens (Edmund Optics #59871) was focused on the eye. Fiber-coupled infrared illumination (Thorlabs M780F2) was positioned near the eye so as to maximize contrast of the imaged pupil and to eliminate or minimize the size of the spectral reflection. In most cases, the single spectral reflection spot could not be eliminated and was instead positioned at the center of the eye, such that it was almost always contained within the pupil (and thus served only as a DC bias on the computed area of the pupil). Video was acquired at 60 Hz using pymba, a Python wrapper for AVT camera control, and frame times were recorded and synchronized to the behavioral task using a National Instruments DAQ (NI PCIe-6323). Video data were analyzed in MATLAB to extract time series corresponding to pupil area versus time during task. Manual calibration was used to crop a region-of-interest around the eye and to determine a threshold intensity value that distinguished between the inside and outside of the pupil. The size of the pupil at each time point was computed as the total number of pixels within the pupil divided by the total number of pixels covering the eye. For optogenetic experiments, mice received 20–30 trials of laser stimulation (ChR2 experiments: 20 Hz 473 nm stimulation for 2 s; NpHR experiments: constant 589 nm stimulation for 2 s) while recording the eye. A black rubber tube was wrapped around the fiber implant on the head to limit the pupillary dilation response to light from the fiber implant. We restricted our analyses to trials where the pupil was between the 5th and 90th percentile of all pupil values recorded in that mouse to avoid ceiling and floor effects. Change in pupil was quantified as the mean pupil size in the 0.5–2.0 s after laser onset, divided by the mean pupil size the −2.0-0 s prior to laser onset.
Mouse fiber photometry
The fiber photometry setup was similar to that described in Gunaydin et al. (2014). Briefly, a fiber-coupled 470 nm LED (Thorlabs, M470F3) was reflected off of a dichroic mirror (Semrock, FF495) into a 600 μm, 0.48 NA optical fiber patch-cord (Doric). The patch-cord was then coupled to a 400 μm, 0.48 NA fiber (Doric, MFC_400/430-0.48_MF2.5_FLT) implanted in the mouse’s brain. The resulting GCaMP or GFP fluorescence was transmitted through the dichroic mirror and band-pass filter (Semrock, FF01-F20/35), and focused via a convex lens (Thorlabs, LA1255A) onto a photo-detector (Newport, 2151). A lock-in amplifier (Stanford Research Systems, SR810) was used to modulate the LED at 400 Hz, and then demodulate the resulting signal collected from the photo-detector. The demodulated signal was digitized at 1 kHz using a data acquisition board (National Instruments, NI PCIe-6321).
Mouse immunohistochemistry
Mice were deeply anesthetized and transcardially perfused with ice-cold PBS, followed by 4% PFA in PBS. Brains were removed and placed in 4% PFA in PBS for post-fixation. Brains were then placed in a 30% sucrose solution for 24 hours at 4 °C. Brains were then mounted, and placed on a freezing microtome for sectioning into 60 μm coronal sections. Sections were placed into PBS in 24 well plates, and washed at room temperature in PBST. Sections were incubated with primary antibodies (1:500 in PBST) overnight at 4 °C on a shaker, washed in PBST for 1 hour at room temperature on a shaker (repeated 4–5 times), then incubated with secondary antibodies (1:500 in PBST) overnight at 4 °C on a shaker. Sections were washed in PBST for 1 hour at room temperature on a shaker (repeated 4–5 times) then mounted on slides using PVA-DABCO, and imaged using an SP5 confocal microscope (Leica). The primary antibodies used were: mouse anti-tyrosine hydroxylase (Immunostar, 22941), rabbit anti-serotonin (Immunostar, 20080), rabbit anti-dopamine beta-hydroxylase (Immunostar, 22806), rat anti-somatostatin (Millipore, MAB354), rabbit anti-CART (Abcam, ab192364), rabbit anti-neuropeptideY (Sigma, N9528), and goat anti-choline acetyltransferase (Millipore, A144P). Secondary antibodies used were donkey anti-mouse Alexa647 (Jackson Immuno Research, 715-606-151), donkey anti-rabbit Alexa 594 (Jackson Immuno Research, 711-586-152), donkey anti-rat Alexa647 (Jackson Immuno Research, 712-606-153), and donkey anti-goat Alexa647 (Jackson Immuno Research, 705-606-147).
QUANTIFICATION AND STATISTICAL ANALYSIS
All analyses and visualizations were performed with custom code written in Python, using NumPy, Scipy, Matplotlib, IPython, Seaborn, Statsmodels, Pandas, Scikit-image, and Scikit-learn libraries (Jones et al., 2001; Hunter, 2007; Perez and Granger, 2007; McKinney, 2010; Seabold and Perktold, 2010; Pedregosa et al., 2011; van der Walt et al., 2011; van der Walt et al., 2014).
Zebrafish analyses
The pixels containing the fish tail were determined in each frame of the tail monitoring videos using adaptive thresholding and blob detection algorithms in Scikit-image (van der Walt et al., 2014; Madelaine et al., 2017). Tail movements were identified by analyzing the number of tail-containing pixels that did not overlap between adjacent frames. The mean and standard deviation of this value when the tail was motionless was estimated as the median of these statistics within all 300 ms time bins. Tail movements were identified as frames when this value remained 4 standard deviations above baseline for at least 40 ms. Tail movements that were separated by less than 50 ms were merged. To classify movement types, the orientation of the tail was computed for every frame as the angle between neutral tail position and the major-axis of the ellipse fit to second-moment of the pixels containing the tail. Movements were then classified as large-angle turns or escape-like if the maximum angle of deflection exceeded 23 degrees and the maximum velocity of deflection exceeded 1.4 degrees/ms. These movements were also classified in terms of their peak tail angle (95th percentile of all measured angles within movement) and peak tail velocity (95th percentile of tail orientation changes between frames, divided by the inter-frame interval (8 ms)). Further analyses were conducted on a binary array that spanned the entire behavioral session, with the times of turns/escape onsets noted as ones. RTs were defined as the time to first large angle tail turn after stimulus onset, within 3 s of stimulus onset. Trials were excluded if fish made any movement within the 500 ms prior to stimulus onset. Trials between the 2.5th and 97.5th percentile of RTs were used. For analysis of coarser trial response types, trials were defined as responses (all trials included for RT analysis, as described above), omissions (all trials with no movement of any kind from 3 s prior to stimulus onset until 6 s after stimulus onset), or premature responses (all trials with any kind of movement in the 500 ms prior to stimulus onset).
Heart rate was obtained from heart recordings by extracting fluorescence time series from the center of the ventricle, where GFP+ cardiac tissue moved in and out with each beat. This resulting time series contained peaks at regular intervals—approximately 1.5–3 peaks per second. Peaks were identified, and a time series of heart rate was generated by smoothing instantaneous heart rate signal by a moving average with a width of 20 s. A correlation coefficient was defined using the RTs and the mean of the heart rate for 1.2 s before each stimulus onset, pooled for all fish tested. Correlation between total movement rate and heart rate were conducted by collecting mean movement rate values (for all types of movement) and mean heart rate in 20 s bins spanning the imaging session.
Live GCaMP brain imaging was corrected for x-y motion using affine corrections in MoCo (Dubbs et al., 2016), running in Fiji/ImageJ (Schindelin et al., 2012). Fish were excluded if there was drift in the z-direction. From motion corrected frames, regions of interest (ROIs) were identified by segmenting nuclei from the 90th percentile image of each plane taken across the entire imaging session. These images were auto-leveled and template-matched to a nucleus-sized disk before using local peak finding and the watershed algorithm to extract ROIs. Raw fluorescence from each ROI was extracted, turned into a dF/F trace (baseline F = 5th percentile of fluorescence), and converted to a z-score. Pearson’s correlation coefficients were defined for the trials that were not excluded, using the RT (or peak tail angle, or peak tail velocity) and the mean of the neural activity for 1.2 s before stimulus onset. Correlations of neurons to visual or motor stimuli were performed by obtaining the Pearson’s correlation coefficient between the activity trace of a cell over the entire behavioral session and a constructed behavioral regressor. Regressors were constructed by convolving a binary array of event onsets for sensory stimuli or turning behavior with a 4 s decay to approximate GCaMP6s fluorescence decays. For analysis of cell types in visual regions, we analyzed neurons identified with the Z-brain atlas (Randlett et al., 2015). Within visual areas (AF6, AF8, tectum), we analyzed neurons classified as being looming stimulus-tuned, as defined by cells with a significant (p < 0.05) correlation to visual regressors. These cells were then used to assess the correlation between RT and the peak neural response in the 4 s after stimulus onset.
Prediction of trial type from neural activity was assessed using logistic regression. Behavioral trials were assigned as responses or omissions (as described above). For each fish, an array of binary values was generated to denote trials that did (1) or did not (0) fit into each category, resulting in two behavior classification arrays. For prediction, we used the mean of the neural activity for 1.2 s before stimulus onset. Data were randomly split into training and testing sets (training set = 50% of trials), and neurons were classified as predictive of trial type if the area under the ROC curve exceeded chance (0.5).
For analysis of caffeine-activated cells, the mean and standard deviation of the time series was determined for the 3 minutes before caffeine application and 3 minutes during caffeine exposure (starting 3 minutes after initial caffeine application).
For analysis of correlations between neuromodulatory cell types, we used the spontaneous activity recordings from fully embedded fish in the absence of sensory stimulation (5–6 minute recording at 3 Hz). For analysis of correlation during the task, we used fish with greater than 20 RTs (n = 18) to analyze the difference between fast RTs (bottom 25th percentile of RTs) and slow RTs (top 25th percentile of RTs). For each trial type, we assessed correlations between cell types from 4 s prior to stimulus onset until 6 s after stimulus onset.
For prediction analyses using individual neurons, we used fish with at least 35 RTs and greater than 20 alertness+ and greater than 20 alertness− neurons simultaneously recorded (n = 4). For prediction analysis using unique cell classes, we used fish where at least three alertness+ cell types were simultaneously recorded, and all neurons within a group were averaged to generate one time series per neuromodulatory group. The pre-stimulus neural activity (1.2 s) was used to predict the RT, using one to 15 simultaneously recorded cells, or one to three simultaneously recorded mean cell types, as inputs. Data were randomly split into training and testing sets (training set = 80% of trials), and the accuracy of prediction was assessed by the Pearson’s correlation coefficient of the true and predicted RT values. As a control, a matched number of alertness− neuromodulatory cells or cell types recorded from the same fish were subjected to the same analysis.
Mouse analyses
Mouse behavior was determined from the licks recorded on the lickometer, and the timing of auditory stimulus onset. RTs were defined as the time to first lick after stimulus onset, within 800 ms of stimulus onset. Mouse photometry datasets were comprised of two consecutive days of recording, and optogenetic experiments comprised one day. For each type of experiment, the first 10 trials and final 20 trials of each daily session were excluded to mitigate the effects of experimenter presence at the beginning of the session and satiation at the end. Trials were also excluded if mice initiated licking in the 150 ms before, and 100 ms after stimulus onset. For analysis of coarser trial response types, trials were defined as responses (all trials included for RT analysis, as described above) or omissions (all trials with no licks from 500 ms prior to stimulus onset until 1 s after stimulus onset). For freely moving optogenetics experiments, behavioral variables were scored as the mean of first 3 minutes of each behavioral epoch. For each mouse, values were established as the differences between the light ON trial and the preceding light OFF epoch. Neural activity was quantified as dF/F for each trial. Baseline F was defined for each trial as the 10th percentile of all activity in a sliding window of five trials. Pearson’s correlation coefficients were defined between the RT and the max of the neural activity for 1.2 s before stimulus onset. Pupil area was also analyzed in the 1.2 before a stimulus, to determine the correlations with RT.
Statistical tests
Statistical tests were conducted using NumPy, Scipy, Statsmodels, and Scikit-learn packages in Python. Distributions were tested for normality using the Shapiro-Wilk test and equality of variance using Levene’s test. For data with normal distributions and equal variance, one-way ANOVAs, two-sided Student’s t tests, paired t tests, or permutation tests (10,000 permutations) were used. Otherwise, non-parametric tests were used for comparing multiple groups (Kruskal-Wallis test), two independent groups (two-sided Mann-Whitney rank test), two related groups (two-sided Wilcoxon signed-rank test), or assessing the difference of single groups from zero (one-sample Wilcoxon signed-rank test). To correct for multiple comparisons (multiple one-way tests or multiple comparisons with a common control group), p values were subjected to a false discovery rate correction.
Supplementary Material
Highlights.
MultiMAP: registering brain-wide cellular-resolution dynamics with molecular identity
Diverse neuromodulatory cell types across the zebrafish brain correlate with alertness
Neuromodulator-specific brain-state-dependent dynamics are conserved from fish to mouse
Activation of diverse neuromodulators similarly modulates alertness-related behavior
Acknowledgments
We thank Philippe Mourrain for Tg(cmlc2:GFP) zebrafish, Misha Ahrens for Tg(elavl3:H2B-GCaMP6s) zebrafish, and Owen Randlett for access to the Z-Brain Atlas. We thank Adelaida Chibukhchyan for assistance with mouse breeding and perfusions; Michael Chen for assistance with mouse habituation; Connie Lee, Nandini Pichamoorthy, Alice Shi On Hong, Dave Schumacher, and Susan Murphy for assistance with zebrafish husbandry; and Sally Pak, Charu Ramakrishnan, Ai-Chi Wang, and Cynthia Delacruz for administrative support. We thank Luis de Lecea, Christine Constantinople, Robert Froemke, Priya Rajasethupathy, Felicity Gore, Joe Viviano, and Tim Machado for advice and comments on an earlier version of the manuscript and the entire Deisseroth lab for feedback and support. M.L.-B. is supported by a Howard Hughes Medical Institute (HHMI) fellowship from the Helen Hay Whitney Foundation (HHWF) and a NARSAD Young Investigator Award from the Brain and Behavior Research Foundation (BBRF). A.S.A. is supported by a fellowship from the HHWF and a NARSAD Young Investigator Award from the BBRF. W.E.A. is supported by a Fannie and John Hertz Foundation Fellowship and an NSF Graduate Research Fellowship. K.D. is supported by NIMH (R01MH099647), NIDA (P50DA042012), DARPA (NeuroFAST program, W911NF-14-2-0013), the NOMIS Foundation, the Else Kroner Fresenius Foundation, the Wiegers Family Fund, the James Grosfeld Foundation, the Sam and Betsy Reeves Foundation, the HL Snyder Foundation, and the Tarlton Foundation.
Footnotes
SUPPLEMENTAL INFORMATION
Supplemental information includes six figures and one movie and can be found with this article online at https://doi.org/10.1016/j.cell.2017.10.021.
AUTHOR CONTRIBUTIONS
M.L.-B. and K.D. designed the experiments. M.L.-B. developed MultiMAP and conducted experiments in zebrafish and head-fixed mice. M.L.-B. analyzed the data, with software contributions from A.S.A. and V.M.B. A.S.A. and W.E.A. developed hardware and software for conducting behavioral experiments. S.V. conducted mouse open-field tests. I.K. developed mouse pupil-tracking methods. M.L.-B. and K.D. wrote the paper with input from all authors. K.D. supervised all aspects of the project.
References
- Abrams JK, Johnson PL, Hollis JH, Lowry CA. Anatomic and functional topography of the dorsal raphe nucleus. Ann N Y Acad Sci. 2004;1018:46–57. doi: 10.1196/annals.1296.005. [DOI] [PubMed] [Google Scholar]
- Ahrens MB, Engert F. Large-scale imaging in small brains. Curr Opin Neurobiol. 2015;32:78–86. doi: 10.1016/j.conb.2015.01.007. [DOI] [PMC free article] [PubMed] [Google Scholar]
- Anderson DJ. Circuit modules linking internal states and social behaviour in flies and mice. Nat Rev Neurosci. 2016;17:692–704. doi: 10.1038/nrn.2016.125. [DOI] [PubMed] [Google Scholar]
- Anderson DJ, Adolphs R. A framework for studying emotions across species. Cell. 2014;157:187–200. doi: 10.1016/j.cell.2014.03.003. [DOI] [PMC free article] [PubMed] [Google Scholar]
- Aston-Jones G, Cohen JD. An integrative theory of locus coeruleus-norepinephrine function: adaptive gain and optimal performance. Annu Rev Neurosci. 2005;28:403–450. doi: 10.1146/annurev.neuro.28.061604.135709. [DOI] [PubMed] [Google Scholar]
- Atasoy D, Betley JN, Su HH, Sternson SM. Deconstruction of a neural circuit for hunger. Nature. 2012;488:172–177. doi: 10.1038/nature11270. [DOI] [PMC free article] [PubMed] [Google Scholar]
- Baden T, Berens P, Franke K, Román Rosón M, Bethge M, Euler T. The functional diversity of retinal ganglion cells in the mouse. Nature. 2016;529:345–350. doi: 10.1038/nature16468. [DOI] [PMC free article] [PubMed] [Google Scholar]
- Bargmann CI. Beyond the connectome: how neuromodulators shape neural circuits. BioEssays. 2012;34:458–465. doi: 10.1002/bies.201100185. [DOI] [PubMed] [Google Scholar]
- Bonnet MH, Arand DL. Heart rate variability: sleep stage, time of night, and arousal influences. Electroencephalogr Clin Neurophysiol. 1997;102:390–396. doi: 10.1016/s0921-884x(96)96070-1. [DOI] [PubMed] [Google Scholar]
- Broadbent DE. Decision and Stress. Academic Press; 1971. [Google Scholar]
- Campbell JN, Macosko EZ, Fenselau H, Pers TH, Lyubetskaya A, Tenen D, Goldman M, Verstegen AM, Resch JM, McCarroll SA, et al. A molecular census of arcuate hypothalamus and median eminence cell types. Nat Neurosci. 2017;20:484–496. doi: 10.1038/nn.4495. [DOI] [PMC free article] [PubMed] [Google Scholar]
- Carter ME, Yizhar O, Chikahisa S, Nguyen H, Adamantidis A, Nishino S, Deisseroth K, de Lecea L. Tuning arousal with optogenetic modulation of locus coeruleus neurons. Nat Neurosci. 2010;13:1526–1533. doi: 10.1038/nn.2682. [DOI] [PMC free article] [PubMed] [Google Scholar]
- Chen TW, Wardill TJ, Sun Y, Pulver SR, Renninger SL, Baohan A, Schreiter ER, Kerr RA, Orger MB, Jayaraman V, et al. Ultra-sensitive fluorescent proteins for imaging neuronal activity. Nature. 2013;499:295–300. doi: 10.1038/nature12354. [DOI] [PMC free article] [PubMed] [Google Scholar]
- Chiu CN, Prober DA. Regulation of zebrafish sleep and arousal states: current and prospective approaches. Front Neural Circuits. 2013;7:58. doi: 10.3389/fncir.2013.00058. [DOI] [PMC free article] [PubMed] [Google Scholar]
- Choi HM, Calvert CR, Husain N, Huss D, Barsi JC, Deverman BE, Hunter RC, Kato M, Lee SM, Abelin AC, et al. Mapping a multiplexed zoo of mRNA expression. Development. 2016;143:3632–3637. doi: 10.1242/dev.140137. [DOI] [PMC free article] [PubMed] [Google Scholar]
- Chung K, Wallace J, Kim SY, Kalyanasundaram S, Andalman AS, Davidson TJ, Mirzabekov JJ, Zalocusky KA, Mattis J, Denisin AK, et al. Structural and molecular interrogation of intact biological systems. Nature. 2013;497:332–337. doi: 10.1038/nature12107. [DOI] [PMC free article] [PubMed] [Google Scholar]
- Clemente D, Porteros A, Weruaga E, Alonso JR, Arenzana FJ, Aijón J, Arévalo R. Cholinergic elements in the zebrafish central nervous system: Histochemical and immunohistochemical analysis. J Comp Neurol. 2004;474:75–107. doi: 10.1002/cne.20111. [DOI] [PubMed] [Google Scholar]
- Couceyro PR, Koylu EO, Kuhar MJ. Further studies on the anatomical distribution of CART by in situ hybridization. J Chem Neuroanat. 1997;12:229–241. doi: 10.1016/s0891-0618(97)00212-3. [DOI] [PubMed] [Google Scholar]
- Coull JT. Neural correlates of attention and arousal: insights from electrophysiology, functional neuroimaging and psychopharmacology. Prog Neurobiol. 1998;55:343–361. doi: 10.1016/s0301-0082(98)00011-2. [DOI] [PubMed] [Google Scholar]
- de Lecea L, Carter ME, Adamantidis A. Shining light on wakefulness and arousal. Biol Psychiatry. 2012;71:1046–1052. doi: 10.1016/j.biopsych.2012.01.032. [DOI] [PMC free article] [PubMed] [Google Scholar]
- Diamond DM, Campbell AM, Park CR, Halonen J, Zoladz PR. The temporal dynamics model of emotional memory processing: a synthesis on the neurobiological basis of stress-induced amnesia, flashbulb and traumatic memories, and the Yerkes-Dodson law. Neural Plast. 2007;2007:60803. doi: 10.1155/2007/60803. [DOI] [PMC free article] [PubMed] [Google Scholar]
- Dubbs A, Guevara J, Yuste R. moco: Fast Motion Correction for Calcium Imaging. Front Neuroinform. 2016;10:6. doi: 10.3389/fninf.2016.00006. [DOI] [PMC free article] [PubMed] [Google Scholar]
- Dunn TW, Gebhardt C, Naumann EA, Riegler C, Ahrens MB, Engert F, Del Bene F. Neural circuits underlying visually evoked escapes in larval zebrafish. Neuron. 2016;89:613–628. doi: 10.1016/j.neuron.2015.12.021. [DOI] [PMC free article] [PubMed] [Google Scholar]
- Eason RG, Harter MR, White CT. Effects of attention and arousal on visually evoked cortical potentials and reaction time in man. Physiol Behav. 1969;4:283–289. [Google Scholar]
- Fenno LE, Mattis J, Ramakrishnan C, Hyun M, Lee SY, He M, Tucciarone J, Selimbeyoglu A, Berndt A, Grosenick L, et al. Targeting cells with single vectors using multiple-feature Boolean logic. Nat Methods. 2014;11:763–772. doi: 10.1038/nmeth.2996. [DOI] [PMC free article] [PubMed] [Google Scholar]
- Filippi A, Mahler J, Schweitzer J, Driever W. Expression of the paralogous tyrosine hydroxylase encoding genes th1 and th2 reveals the full complement of dopaminergic and noradrenergic neurons in zebrafish larval and juvenile brain. J Comp Neurol. 2010;518:423–438. doi: 10.1002/cne.22213. [DOI] [PMC free article] [PubMed] [Google Scholar]
- Freeman GL. The facilitative and inhibitory effects of muscular tension upon performance. Am J Psychol. 1933;45:17–52. [Google Scholar]
- Getting PA. Emerging principles governing the operation of neural networks. Annu Rev Neurosci. 1989;12:185–204. doi: 10.1146/annurev.ne.12.030189.001153. [DOI] [PubMed] [Google Scholar]
- Giardino WJ, Cote DM, Li J, Ryabinin AE. Characterization of genetic differences within the centrally projecting Edinger–Westphal nucleus of C57BL/6J and DBA/2J mice by expression profiling. Front Neuroanat. 2012;6:5. doi: 10.3389/fnana.2012.00005. [DOI] [PMC free article] [PubMed] [Google Scholar]
- Guenthner CJ, Miyamichi K, Yang HH, Heller HC, Luo L. Permanent genetic access to transiently active neurons via TRAP: targeted recombination in active populations. Neuron. 2013;78:773–784. doi: 10.1016/j.neuron.2013.03.025. [DOI] [PMC free article] [PubMed] [Google Scholar]
- Gunaydin LA, Grosenick L, Finkelstein JC, Kauvar IV, Fenno LE, Adhikari A, Lammel S, Mirzabekov JJ, Airan RD, Zalocusky KA, et al. Natural neural projection dynamics underlying social behavior. Cell. 2014;157:1535–1551. doi: 10.1016/j.cell.2014.05.017. [DOI] [PMC free article] [PubMed] [Google Scholar]
- Hangya B, Ranade SP, Lorenc M, Kepecs A. Central cholinergic neurons are rapidly recruited by reinforcement feedback. Cell. 2015;162:1155–1168. doi: 10.1016/j.cell.2015.07.057. [DOI] [PMC free article] [PubMed] [Google Scholar]
- Harris KD, Thiele A. Cortical state and attention. Nat Rev Neurosci. 2011;12:509–523. doi: 10.1038/nrn3084. [DOI] [PMC free article] [PubMed] [Google Scholar]
- Herget U, Ryu S. Coexpression analysis of nine neuropeptides in the neurosecretory preoptic area of larval zebrafish. Front Neuroanat. 2015;9 doi: 10.3389/fnana.2015.00002. [DOI] [PMC free article] [PubMed] [Google Scholar]
- Holzschuh J, Barrallo-Gimeno A, Ettl AK, Dürr K, Knapik EW, Driever W. Noradrenergic neurons in the zebrafish hindbrain are induced by retinoic acid and require tfap2a for expression of the neurotransmitter phenotype. Development. 2003;130:5741–5754. doi: 10.1242/dev.00816. [DOI] [PubMed] [Google Scholar]
- Hong E, Santhakumar K, Akitake CA, Ahn SJ, Thisse C, Thisse B, Wyart C, Mangin JM, Halpern ME. Cholinergic left-right asymmetry in the habenulo-interpeduncular pathway. Proc Natl Acad Sci USA. 2013;110:21171–21176. doi: 10.1073/pnas.1319566110. [DOI] [PMC free article] [PubMed] [Google Scholar]
- Huang CJ, Tu CT, Hsiao CD, Hsieh FJ, Tsai HJ. Germ-line transmission of a myocardium-specific GFP transgene reveals critical regulatory elements in the cardiac myosin light chain 2 promoter of zebrafish. Dev Dyn. 2003;228:30–40. doi: 10.1002/dvdy.10356. [DOI] [PubMed] [Google Scholar]
- Hunter JD. Matplotlib: A 2D graphics environment. Comput Sci Eng. 2007;9 [Google Scholar]
- Jodo E, Chiang C, Aston-Jones G. Potent excitatory influence of prefrontal cortex activity on noradrenergic locus coeruleus neurons. Neuroscience. 1998;83:63–79. doi: 10.1016/s0306-4522(97)00372-2. [DOI] [PubMed] [Google Scholar]
- Jones E, Oliphant T, Peterson P. SciPy: Open source scientific tools for Python. 2001 https://www.scipy.org.
- Joshi S, Li Y, Kalwani RM, Gold JI. Relationships between pupil diameter and neuronal activity in the locus coeruleus, colliculi, and cingulate cortex. Neuron. 2016;89:221–234. doi: 10.1016/j.neuron.2015.11.028. [DOI] [PMC free article] [PubMed] [Google Scholar]
- Kayama Y, Ohta M, Jodo E. Firing of ‘possibly’ cholinergic neurons in the rat laterodorsal tegmental nucleus during sleep and wakefulness. Brain Res. 1992;569:210–220. doi: 10.1016/0006-8993(92)90632-j. [DOI] [PubMed] [Google Scholar]
- Kerlin AM, Andermann ML, Berezovskii VK, Reid RC. Broadly tuned response properties of diverse inhibitory neuron subtypes in mouse visual cortex. Neuron. 2010;67:858–871. doi: 10.1016/j.neuron.2010.08.002. [DOI] [PMC free article] [PubMed] [Google Scholar]
- Koblinger K, Füzesi T, Ejdrygiewicz J, Krajacic A, Bains JS, Whelan PJ. Characterization of A11 neurons projecting to the spinal cord of mice. PLoS ONE. 2014;9:e109636. doi: 10.1371/journal.pone.0109636. [DOI] [PMC free article] [PubMed] [Google Scholar]
- Kozicz T. Neurons colocalizing urocortin and cocaine and amphetamine-regulated transcript immunoreactivities are induced by acute lipopoly-saccharide stress in the Edinger-Westphal nucleus in the rat. Neuroscience. 2003;116:315–320. doi: 10.1016/s0306-4522(02)00772-8. [DOI] [PubMed] [Google Scholar]
- Langer D, Helmchen F. Post hoc immunostaining of GABAergic neuronal subtypes following in vivo two-photon calcium imaging in mouse neocortex. Pflugers Arch. 2012;463:339–354. doi: 10.1007/s00424-011-1048-9. [DOI] [PMC free article] [PubMed] [Google Scholar]
- Lee SH, Dan Y. Neuromodulation of brain states. Neuron. 2012;76:209–222. doi: 10.1016/j.neuron.2012.09.012. [DOI] [PMC free article] [PubMed] [Google Scholar]
- Lein ES, Hawrylycz MJ, Ao N, Ayres M, Bensinger A, Bernard A, Boe AF, Boguski MS, Brockway KS, Byrnes EJ, et al. Genome-wide atlas of gene expression in the adult mouse brain. Nature. 2007;445:168–176. doi: 10.1038/nature05453. [DOI] [PubMed] [Google Scholar]
- Lieberman HR, Wurtman RJ, Emde GG, Roberts C, Coviella ILG. The effects of low doses of caffeine on human performance and mood. Psychopharmacology (Berl) 1987;92:308–312. doi: 10.1007/BF00210835. [DOI] [PubMed] [Google Scholar]
- Lim J, Dinges DF. Sleep deprivation and vigilant attention. Ann N Y Acad Sci. 2008;1129:305–322. doi: 10.1196/annals.1417.002. [DOI] [PubMed] [Google Scholar]
- Lindeberg J, Usoskin D, Bengtsson H, Gustafsson A, Kylberg A, Söder-ström S, Ebendal T. Transgenic expression of Cre recombinase from the tyrosine hydroxylase locus. Genesis. 2004;40:67–73. doi: 10.1002/gene.20065. [DOI] [PubMed] [Google Scholar]
- Löhr H, Ryu S, Driever W. Zebrafish diencephalic A11-related dopaminergic neurons share a conserved transcriptional network with neuroendocrine cell lineages. Development. 2009;136:1007–1017. doi: 10.1242/dev.033878. [DOI] [PubMed] [Google Scholar]
- Madelaine R, Lovett-Barron M, Halluin C, Andalman AS, Liang J, Skariah GM, Leung LC, Burns VM, Mourrain P. The hypothalamic NPVF circuit modulates ventral raphe activity during nociception. Sci Rep. 2017;7:41528. doi: 10.1038/srep41528. [DOI] [PMC free article] [PubMed] [Google Scholar]
- Maimon G. Modulation of visual physiology by behavioral state in monkeys, mice, and flies. Curr Opin Neurobiol. 2011;21:559–564. doi: 10.1016/j.conb.2011.05.001. [DOI] [PubMed] [Google Scholar]
- Marder E. Neuromodulation of neuronal circuits: back to the future. Neuron. 2012;76:1–11. doi: 10.1016/j.neuron.2012.09.010. [DOI] [PMC free article] [PubMed] [Google Scholar]
- Marrocco RT, Witte EA, Davidson MC. Arousal systems. Curr Opin Neurobiol. 1994;4:166–170. doi: 10.1016/0959-4388(94)90067-1. [DOI] [PubMed] [Google Scholar]
- Mathieu M, Tagliafierro G, Bruzzone F, Vallarino M. Neuropeptide tyrosine-like immunoreactive system in the brain, olfactory organ and retina of the zebrafish, Danio rerio, during development. Brain Res Dev Brain Res. 2002;139:255–265. doi: 10.1016/s0165-3806(02)00577-1. [DOI] [PubMed] [Google Scholar]
- McGinley MJ, Vinck M, Reimer J, Batista-Brito R, Zagha E, Cadwell CR, Tolias AS, Cardin JA, McCormick DA. Waking state: rapid variations modulate neural and behavioral responses. Neuron. 2015;87:1143–1161. doi: 10.1016/j.neuron.2015.09.012. [DOI] [PMC free article] [PubMed] [Google Scholar]
- McKinney W. Data structures for statistical computing in python. Proceedings of the 9th Python in Science Conference; 2010. pp. 51–56. [Google Scholar]
- McLean DL, Fetcho JR. Ontogeny and innervation patterns of dopaminergic, noradrenergic, and serotonergic neurons in larval zebrafish. J Comp Neurol. 2004;480:38–56. doi: 10.1002/cne.20280. [DOI] [PubMed] [Google Scholar]
- Norton WH, Folchert A, Bally-Cuif L. Comparative analysis of serotonin receptor (HTR1A/HTR1B families) and transporter (slc6a4a/b) gene expression in the zebrafish brain. J Comp Neurol. 2008;511:521–542. doi: 10.1002/cne.21831. [DOI] [PubMed] [Google Scholar]
- O’Connell LA. Evolutionary development of neural systems in vertebrates and beyond. J Neurogenet. 2013;27:69–85. doi: 10.3109/01677063.2013.789511. [DOI] [PubMed] [Google Scholar]
- O’Connor DH, Peron SP, Huber D, Svoboda K. Neural activity in barrel cortex underlying vibrissa-based object localization in mice. Neuron. 2010;67:1048–1061. doi: 10.1016/j.neuron.2010.08.026. [DOI] [PubMed] [Google Scholar]
- Oken BS, Salinsky MC, Elsas SM. Vigilance, alertness, or sustained attention: physiological basis and measurement. Clin Neurophysiol. 2006;117:1885–1901. doi: 10.1016/j.clinph.2006.01.017. [DOI] [PMC free article] [PubMed] [Google Scholar]
- Orger MB, Kampff AR, Severi KE, Bollmann JH, Engert F. Control of visually guided behavior by distinct populations of spinal projection neurons. Nat Neurosci. 2008;11:327–333. doi: 10.1038/nn2048. [DOI] [PMC free article] [PubMed] [Google Scholar]
- Paeger L, Karakasilioti I, Altmüller J, Frommolt P, Brüning J, Kloppenburg P. Antagonistic modulation of NPY/AgRP and POMC neurons in the arcuate nucleus by noradrenalin. eLife. 2017;6 doi: 10.7554/eLife.25770. [DOI] [PMC free article] [PubMed] [Google Scholar]
- Palkovits M, Brownstein MJ, Arimura A, Sato H, Schally V, Kizer JS. Somatostatin content of the hypothalamic ventromedial and arcuate nuclei and the circumventricular organs in the rat. Brain Res. 1976;109:430–434. doi: 10.1016/0006-8993(76)90549-7. [DOI] [PubMed] [Google Scholar]
- Pedregosa F, Varoquaux G, Gramfort A, Michel V, Thirion B, Grisel O, Blondel M, Prettenhofer P, Weiss R, Dubourg V, et al. Scikit-learn: Machine learning in Python. J Mach Learn Res. 2011;12:2825–2830. [Google Scholar]
- Perez F, Granger BE. IPython: a system for interactive scientific computing. Comput Sci Eng. 2007;9:21–29. [Google Scholar]
- Petersen SE, Posner MI. The attention system of the human brain: 20 years after. Annu Rev Neurosci. 2012;35:73–89. doi: 10.1146/annurev-neuro-062111-150525. [DOI] [PMC free article] [PubMed] [Google Scholar]
- Pfaff D, Ribeiro A, Matthews J, Kow LM. Concepts and mechanisms of generalized central nervous system arousal. Ann N Y Acad Sci. 2008;1129:11–25. doi: 10.1196/annals.1417.019. [DOI] [PubMed] [Google Scholar]
- Pinto L, Goard MJ, Estandian D, Xu M, Kwan AC, Lee SH, Harrison TC, Feng G, Dan Y. Fast modulation of visual perception by basal forebrain cholinergic neurons. Nat Neurosci. 2013;16:1857–1863. doi: 10.1038/nn.3552. [DOI] [PMC free article] [PubMed] [Google Scholar]
- Podlasz P, Sallinen V, Chen YC, Kudo H, Fedorowska N, Panula P. Galanin gene expression and effects of its knock-down on the development of the nervous system in larval zebrafish. J Comp Neurol. 2012;520:3846–3862. doi: 10.1002/cne.23131. [DOI] [PubMed] [Google Scholar]
- Portugues R, Engert F. The neural basis of visual behaviors in the larval zebrafish. Curr Opin Neurobiol. 2009;19:644–647. doi: 10.1016/j.conb.2009.10.007. [DOI] [PMC free article] [PubMed] [Google Scholar]
- Prober DA, Rihel J, Onah AA, Sung RJ, Schier AF. Hypocretin/orexin overexpression induces an insomnia-like phenotype in zebrafish. J Neurosci. 2006;26:13400–13410. doi: 10.1523/JNEUROSCI.4332-06.2006. [DOI] [PMC free article] [PubMed] [Google Scholar]
- Randlett O, Wee CL, Naumann EA, Nnaemeka O, Schoppik D, Fitzgerald JE, Portugues R, Lacoste AM, Riegler C, Engert F, Schier AF. Whole-brain activity mapping onto a zebrafish brain atlas. Nat Methods. 2015;12:1039–1046. doi: 10.1038/nmeth.3581. [DOI] [PMC free article] [PubMed] [Google Scholar]
- Reimer J, McGinley MJ, Liu Y, Rodenkirch C, Wang Q, McCormick DA, Tolias AS. Pupil fluctuations track rapid changes in adrenergic and cholinergic activity in cortex. Nat Commun. 2016;7:13289. doi: 10.1038/ncomms13289. [DOI] [PMC free article] [PubMed] [Google Scholar]
- Renier N, Adams EL, Kirst C, Wu Z, Azevedo R, Kohl J, Autry AE, Kadiri L, Umadevi Venkataraju K, Zhou Y, et al. Mapping of Brain Activity by Automated Volume Analysis of Immediate Early Genes. Cell. 2016;165:1789–1802. doi: 10.1016/j.cell.2016.05.007. [DOI] [PMC free article] [PubMed] [Google Scholar]
- Richter C, Woods IG, Schier AF. Neuropeptidergic control of sleep and wakefulness. Annu Rev Neurosci. 2014;37:503–531. doi: 10.1146/annurev-neuro-062111-150447. [DOI] [PubMed] [Google Scholar]
- Robbins TW. Arousal systems and attentional processes. Biol Psychol. 1997;45:57–71. doi: 10.1016/s0301-0511(96)05222-2. [DOI] [PubMed] [Google Scholar]
- Rohlfing T, Maurer CR., Jr Nonrigid image registration in shared-memory multiprocessor environments with application to brains, breasts, and bees. IEEE Trans Inf Technol Biomed. 2003;7:16–25. doi: 10.1109/titb.2003.808506. [DOI] [PubMed] [Google Scholar]
- Ryu S, Holzschuh J, Mahler J, Driever W. Genetic analysis of dopaminergic system development in zebrafish. J Neural Transm Suppl. 2006;70:61–66. doi: 10.1007/978-3-211-45295-0_11. [DOI] [PubMed] [Google Scholar]
- Saper CB, Fuller PM, Pedersen NP, Lu J, Scammell TE. Sleep state switching. Neuron. 2010;68:1023–1042. doi: 10.1016/j.neuron.2010.11.032. [DOI] [PMC free article] [PubMed] [Google Scholar]
- Schindelin J, Arganda-Carreras I, Frise E, Kaynig V, Longair M, Pietzsch T, Preibisch S, Rueden C, Saalfeld S, Schmid B, et al. Fiji: an open-source platform for biological-image analysis. Nat Methods. 2012;9:676–682. doi: 10.1038/nmeth.2019. [DOI] [PMC free article] [PubMed] [Google Scholar]
- Seabold S, Perktold J. Statsmodels: Econometric and statistical modeling with python. Proceedings of the 9th Python in Science Conference; 2010. pp. 57–61. [Google Scholar]
- Sylwestrak EL, Rajasethupathy P, Wright MA, Jaffe A, Deisseroth K. Multiplexed intact-tissue transcriptional analysis at cellular resolution. Cell. 2016;164:792–804. doi: 10.1016/j.cell.2016.01.038. [DOI] [PMC free article] [PubMed] [Google Scholar]
- Tay TL, Ronneberger O, Ryu S, Nitschke R, Driever W. Comprehensive catecholaminergic projectome analysis reveals single-neuron integration of zebrafish ascending and descending dopaminergic systems. Nat Commun. 2011;2:171. doi: 10.1038/ncomms1171. [DOI] [PMC free article] [PubMed] [Google Scholar]
- Temizer I, Donovan JC, Baier H, Semmelhack JL. A visual pathway for looming-evoked escape in larval zebrafish. Curr Biol. 2015;25:1823–1834. doi: 10.1016/j.cub.2015.06.002. [DOI] [PubMed] [Google Scholar]
- Thayer JF, Lane RD. A model of neurovisceral integration in emotion regulation and dysregulation. J Affect Disord. 2000;61:201–216. doi: 10.1016/s0165-0327(00)00338-4. [DOI] [PubMed] [Google Scholar]
- Thisse B, Thisse C. Fast release clones: a high throughput expression analysis. ZFIN Direct Data Submiss. 2004;2 [Google Scholar]
- van der Walt S, Colbert SC, Varoquaux G. The NumPy array: a structure for efficient numerical computation. Comput Sci Eng. 2011;13:22–30. [Google Scholar]
- van der Walt S, Schönberger JL, Nunez-Iglesias J, Boulogne F, Warner JD, Yager N, Gouillart E, Yu T scikit-image contributors. scikit-image: image processing in Python. PeerJ. 2014;2:e453. doi: 10.7717/peerj.453. [DOI] [PMC free article] [PubMed] [Google Scholar]
- Van Dort CJ, Zachs DP, Kenny JD, Zheng S, Goldblum RR, Gelwan NA, Ramos DM, Nolan MA, Wang K, Weng FJ, et al. Optogenetic activation of cholinergic neurons in the PPT or LDT induces REM sleep. Proc Natl Acad Sci USA. 2015;112:584–589. doi: 10.1073/pnas.1423136112. [DOI] [PMC free article] [PubMed] [Google Scholar]
- Vladimirov N, Mu Y, Kawashima T, Bennett DV, Yang CT, Looger LL, Keller PJ, Freeman J, Ahrens MB. Light-sheet functional imaging in fictively behaving zebrafish. Nat Methods. 2014;11:883–884. doi: 10.1038/nmeth.3040. [DOI] [PubMed] [Google Scholar]
- Wang HL, Morales M. Pedunculopontine and laterodorsal tegmental nuclei contain distinct populations of cholinergic, glutamatergic and GABAergic neurons in the rat. Eur J Neurosci. 2009;29:340–358. doi: 10.1111/j.1460-9568.2008.06576.x. [DOI] [PMC free article] [PubMed] [Google Scholar]
- Wilson DE, Smith GB, Jacob AL, Walker T, Dimidschstein J, Fishell G, Fitzpatrick D. GABAergic Neurons in Ferret Visual Cortex Participate in Functionally Specific Networks. Neuron. 2017;93:1058–1065. e4. doi: 10.1016/j.neuron.2017.02.035. [DOI] [PMC free article] [PubMed] [Google Scholar]
- Ye L, Allen WE, Thompson KR, Tian Q, Hsueh B, Ramakrishnan C, Wang AC, Jennings JH, Adhikari A, Halpern CH, et al. Wiring and Molecular Features of Prefrontal Ensembles Representing Distinct Experiences. Cell. 2016;165:1776–1788. doi: 10.1016/j.cell.2016.05.010. [DOI] [PMC free article] [PubMed] [Google Scholar]
- Yelin-Bekerman L, Elbaz I, Diber A, Dahary D, Gibbs-Bar L, Alon S, Lerer-Goldshtein T, Appelbaum L. Hypocretin neuron-specific transcriptome profiling identifies the sleep modulator Kcnh4a. eLife. 2015;4:e08638. doi: 10.7554/eLife.08638. [DOI] [PMC free article] [PubMed] [Google Scholar]
Associated Data
This section collects any data citations, data availability statements, or supplementary materials included in this article.