Abstract
Background
The tumor promoting or counteracting effects of the immune response to cancer development are thought to be mediated to some extent by the infiltration of regulatory T cells (Tregs). In the present study we evaluated the prevalence of Treg populations in stromal and epithelial compartments of normal, post atrophic hyperplasia (PAH), prostatic intraepithelial neoplasia (PIN), and tumor lesions in men with and without prostate cancer.
Methods
Study subjects were 102 men consecutively diagnosed with localized prostate cancer undergoing radical prostatectomy and 38 men diagnosed with bladder cancer undergoing cystoprostatectomy without prostate cancer at the pathological examination. Whole mount sections from all patients were evaluated for the epithelial and stromal expression of CD4+ Tregs and CD8+ Tregs in normal, PAH, PIN, and tumor lesions. A Friedmańs test was used to investigate differences in the mean number of Tregs across histological lesions. Logistic regression was used to estimate crude and adjusted odds ratios (OR) for prostate cancer for each histological area.
Results
In men with prostate cancer, similarly high numbers of stromal CD4+ Tregs were identified in PAH and tumor, but CD4+ Tregs were less common in PIN. Greater numbers of epithelial CD4+ Tregs in normal prostatic tissue were positively associated with both Gleason score and pT‐stage. We observed a fourfold increased risk of prostate cancer in men with epithelial CD4+ Tregs in the normal prostatic tissue counterpart.
Conclusions
Our results may suggest a possible pathway through which PAH develops directly into prostate cancer in the presence of CD4+ Tregs and indicate that transformation of the anti‐tumor immune response may be initiated even before the primary tumor is established.
Keywords: CD4+FOXP3+ Tregs, Lag‐3+ Tregs, prostate carcinoma
1. INTRODUCTION
Prostate cancer is the most frequently diagnosed malignant neoplasm among men worldwide, accounting for approximately 15% of all newly diagnosed male cancers worldwide.1 Despite the high incidence, the underlying pathogenic mechanisms of the disease are still largely unknown.
The repressive or promotional effects of the immune response to the emergence of primary tumors could be mediated in part by the infiltration of regulatory T cells (Tregs). Recent studies have shown that Tregs (CD4+ Tregs and CD8+ Tregs), suppress a wide range of anti‐tumor immune responses. Immune suppression could occur either through secretion of anti‐inflammatory cytokines, such as Interleukin‐10 and transforming growth factor beta (TGF‐β) or directly via cell‐cell contact.2 Tregs modulate the aggressiveness of the cellular immune response and the relation between CD3+ T cells and Tregs is responsible of the immune response and immune tolerance. High infiltration of Tregs seems to facilitate cancer development, due to the critical role of the immune tolerance in the cancer development process. Furthermore high levels of Tregs are associated with higher tumor aggressiveness in different types of cancers.3 Increased numbers of Tregs have been observed in a variety of malignancies such as melanoma,4 ovarian cancer,5 breast cancer,6 and renal cancer.7 A higher prevalence of Tregs has also been observed in prostate cancer tissue when compared to normal prostate tissue and has been associated with worse clinical outcome.8, 9, 10, 11 We recently reported that men with greater number of CD4+ Tregs in their prostate tumor environment have an increased risk of dying of prostate cancer.12
Lymphocyte Activation Gene 3 (LAG‐3) has emerged as a marker for CD4+ Tregs with potential to suppress anti‐tumor activity. Camisaschi et al13 showed that inside the suppressor CD4+CD25highFOXP3+ T cell population; LAG‐3 expression identified a discrete subset of cells that displayed a terminal‐effector phenotype. They also revealed that this subset of Tregs was expanded in peripheral blood and from patients with different types of cancer among them prostate cancer.
Inflammatory cells are hypothesized to influence normal prostate epithelia to transform into postatrophic hyperplasia (PAH), which in turn could give rise to prostate cancer either directly or indirectly via progression to prostatic intraepithelial neoplasia (PIN).14 Consequently, the presence of Tregs in normal prostate tissue and in prostate cancer precursor lesions could influence tumor development. To our knowledge no previous studies have performed a comprehensive examination of the infiltration of Tregs in histological lesions suggested to be prostate cancer precursors.
In this study, we evaluated the prevalence of Treg populations in stromal and epithelial compartments of normal prostate, PAH, PIN, and prostate cancer using whole mount prostate tissue sections from men with and without prostate cancer.
2. MATERIALS AND METHODS
2.1. Patients
Cases in our study were comprised of 102 men consecutively diagnosed with localized prostate cancer undergoing radical prostatectomy. Controls were 38 men diagnosed with bladder cancer undergoing cystoprostatectomy without prostate cancer at the pathological examination. Six of the bladder cancer patients were treated with BCG. None of the patients were on antibiotics prior to treatment. All surgical procedures were conducted between January 2009 and March 2013. A dedicated genito‐urinary pathologist evaluated all the prostate specimens. The pathologists in the study selected tissue blocks including prostate cancer, normal tissue, PIN, and PAH in the same slide when was possible, otherwise in the two most representative slides. The different areas were selected and circled as follows: the areas of cancer have been chosen according to the index nodule, the areas of PIN, and PAH have been selected in the same slide of the index nodule or in a slide its closest proximity.0.
Gleason grading was assessed in accordance with the 2016 WHO guidelines15 and PAH was selected according to the atrophy classification, proposed by the Working Group for Histologic Classification of Prostate Atrophy Lesions in 2006.16 Staging was evaluated according to the American Joint Committee on Cancer criteria.17 The pathologist also confirmed that the controls were free from prostate cancer. Controls with histological findings of prostate cancer were excluded.
All specimens were acquired under an Ethical Review Board in Uppsala‐Örebro‐approved protocol (2008/293) with written informed consent was obtained from each patient.
2.2. Immunohistochemistry
Whole mount sections (4 μm) were used for all immunohistochemical analysis. Deparaffination, rehydration, and antigen retrieval was performed using Borg Decloaker (BioCare Medical, Concord, CA) using a pressure cooker (BioCare Medical) for 15 min at 110°C, followed by slow cooling. The rest of the procedure was performed in an automated stainer instrument (intelliPATH FLX Automated Slide Stainer, BioCare Medical).
To identify CD4+FOXP3+ Tregs and CD8+FOXP3+ Tregs, we used a triple staining protocol previously described in detail.12 Briefly, we used as primary antibodies a mouse monoclonal and rabbit monoclonal ready‐to‐use multiplex cocktail against CD4 and CD8 (clone BC/1F6+SP16, BioCare Medical, Concord) and a mouse monoclonal antibody against FOXP3 (clone 236A/E7, eBioscience, San Diego) at 1:100 dilution. After primary antibody incubation, slides were treated with secondary antibodies and chromogen for detection. To identify CD4 and CD8, Mach 2 double stain and diaminobenzidin (DAB) and Warp Red Chromogen kit were used, respectively. To detect FOXP3, Mach 2 mouse HRP‐Polymer served as secondary antibody followed by Vina Green Chromogen kit for visualization. To identify LAG‐3+FOXP3+ Tregs we optimized a double staining protocol. Primary antibodies were a mouse monoclonal antibody against FOXP3 (clone 236A/E7, eBioscience, San Diego) and a rabbit polyclonal antibody against LAG‐3 (HPA013967, Atlas) at 1:100 and 1:200 dilution, respectively. After primary antibody incubation for 30 min at room temperature, slides were treated with secondary antibodies and chromogen for detection. For visualization of FOXP3 and LAG‐3, Mach 2 double stain 2 (BioCare Medical), and Vina Green Chromogen kit (BioCare Medical) and Warp Red Chromogen kit (Biocare Medical) were used, respectively. Slides were counterstained with haemotoxylin.
For each case two study dedicated uro‐pathologists (MF and GF) selected one slide where normal glands, PAH, PIN, and tumor areas were included in the same section. These slides underwent triple stain protocol for CD4+/CD8+/FOXP3+ Tregs and double stain protocol for LAG‐3+FOXP3+ Tregs. Triple‐stained slides were then scanned and acquired using a Hamamatsu Nanozoomer 2.0RS instrument. The system converted the glass slides into digital slides at high resolutions using the software NDP.scan V2.3.1. In all the slides each area of interest (normal, PAH, PIN, and tumor) was circled with the surrounding stromal tissue and the digital selection was saved in an external hard disk for immunohistochemical scoring.
2.3. Evaluation of CD4/FOXP3, CD8/FOXP3, and LAG‐3/FOXP3
We quantified CD4+ Tregs by simultaneous CD4 and FOXP3 expression, CD8+ Tregs by simultaneous CD8 and FOXP3 expression, and LAG‐3+ Tregs by simultaneous LAG‐3 and FOXP3 expression using NDP.view 2 software at ×20 magnification. Ten randomly selected fields views were evaluated and the CD4+ Tregs, CD8+ Tregs, and LAG‐3+ Tregs, were counted separately in the epithelial compartment and in the stromal compartment within the normal, PAH, PIN, and tumor histological lesions. When less than 10 field views were available for a given area, the total number of counted fields was noted. The positive cells across all slides for a given patient were summed and divided by the total number of field views across all slides for that patient. Given that one high power field at 20× magnification is approximately 1 mm2, the mean number of positive cells per patient can be interpreted as the mean number of cells per 1 mm2. The observers (SD and A‐LO) were blinded to all clinical data and conducted evaluations independently.
2.4. Statistical analyses
In each area of interest (normal stroma, normal epithelium, PAH stroma, PAH epithelium, PIN stroma, PIN epithelium, tumor stroma, and tumor epithelium) the total number of CD4+FOP3+ Tregs identified by positive staining were summed across all of the slides and then divided by the number of field views to obtain a ratio of positive cells per field view. A Friedmańs test was used in order to investigate differences in the mean number of CD4+FOXP3+ Tregs between histological lesions. We evaluated Pearson correlation coefficients between positive staining in each of the eight areas. For subsequent analyses, we dichotomized CD4+FOXP3+ expression at the median in controls. We evaluated associations between CD4+FOXP3+ Tregs with Gleason score (categories of 2‐6, 7, 8‐10) and tumor stage (pT2 and pT3). We estimated crude and smoking‐adjusted odds ratios for prostate cancer using logistic regression separately for each of the eight histological areas. Smoking was categorized as ever versus never exposure. All statistical analyses were undertaken in SAS 9.1.3.
3. RESULTS
We evaluated prostate whole mount sections from 102 men with prostate cancer (cases) and 38 men without the disease (controls). All prostate cancer samples showed histopathological evidence of carcinoma with a differentiation grade according to Gleason of 2‐6 in 34%, 7 in 60%, and 8‐10 in 6%. The tumor stage of investigated prostate cancer patients were pT2 in 86% and pT3 in 14%.
First we evaluated the prevalence of CD4+FOXP3+ Tregs, CD8+FOXP3+ Tregs, and LAG3+FOXP3+ Tregs in different histological lesions involved in prostate carcinogenesis. When immunohistochemistry was used for visualization, FOXP3 expression was localized in the nuclei of the T cells, whereas CD4, CD8, and LAG‐3 expression were localized in the cell membrane. The majority of the FOXP3+ cells were also positive for CD4. Our investigation revealed scarce FOXP3+CD8+ expression; only four patients had CD8+FOXP3+ Tregs present in their prostate tissue. Infrequent expression was also found for LAG‐3+FOXP3+. In the majority of the 18 patients with LAG‐3FOXP3 positivity, the expression was observed on a single T cell. Due to the low expression of CD8+FOXP3+ and LAG‐3+FOXP3+, these two Treg populations were not evaluated further.
3.1. CD4+FOXP3+ Tregs in epithelial versus stromal cells in men with prostate cancer
We investigated the localization of CD4+FOXP3+ Tregs in tumor‐adjacent normal, PAH, PIN, and tumor areas in men with prostate cancer (cases), and found that the mean number of Tregs was significantly higher in the stroma compared to the epithelia in all compartments, normal (P < 0.001), PAH (P < 0.001), PIN (P < 0.001), and tumor (P < 0.001).
3.2. CD4+FOXP3+ Tregs in stroma and epithelia in normal, PAH, PIN, and tumor in men with prostate cancer
The prevalence of CD4+FOXP3+ Tregs was evaluated in the stromal and the epithelial compartment of tumor‐adjacent normal, PAH, PIN, and tumor histological lesions in cases. In the stroma, the mean number of CD4+FOXP3+ Tregs differed significantly between tumor‐adjacent normal and PAH (P < 0.001), tumor‐adjacent normal and tumor (P < 0.001), PAH and PIN (P < 0.001), PIN and tumor (P < 0.001). No significant difference was found between tumor‐adjacent normal and PIN (Table 1). An increase in mean number of Tregs was found in stromal PAH compared to tumor‐adjacent normal, tumor compared to tumor‐adjacent normal, and tumor compared to PIN. A decreased number of Tregs was found in PIN compared to in PAH (Figures 1, 2, 3, 4, 5). In the epithelium, the only significant difference between CD4+FOXP3+ Tregs was when comparing between tumor‐adjacent normal and tumor (P < 0.001) where an increase in mean number of Tregs were found in tumor lesions. The presence of Tregs was not specifically associated with basal or luminal cells within the tumor area (Figure 6).
Table 1.
The mean number of CD4+FOXP3+ Tregs in normal, PAH, PIN, and tumor histological lesions
| Cell | Histological lesion | N | Mean |
|---|---|---|---|
| CD4+FOXP3+ Tregs | Normal stroma | 61 | 0.19 |
| CD4+FOXP3+ Tregs | PAH stroma | 61 | 0.67 |
| CD4+FOXP3+ Tregs | PIN stroma | 61 | 0.24 |
| CD4+FOXP3+ Tregs | Tumor stroma | 61 | 0.65 |
| CD4+FOXP3+ Tregs | Normal epithelium | 60 | 0.08 |
| CD4+FOXP3+ Tregs | PAH epithelium | 60 | 0.11 |
| CD4+FOXP3+ Tregs | PIN epithelium | 60 | 0.10 |
| CD4+FOXP3+ Tregs | Tumor epithelium | 60 | 0.15 |
Figure 1.
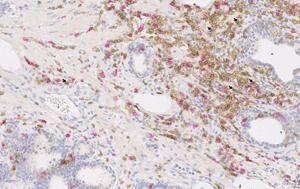
CD4 (brown), CD8 (red), and FOXP3 (green) expression in prostate tissue. Arrows indicate CD4+FOXP3+ Tregs in post‐atrophic hyperplasia at 20× magnification
Figure 2.
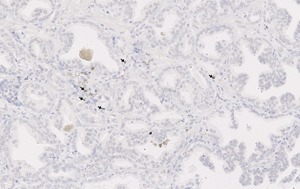
CD4 (brown), CD8 (red), and FOXP3 (green) expression in prostate tissue. Arrows indicate CD4+FOXP3+ Tregs in prostate tumor tissue at 20× magnification
Figure 3.
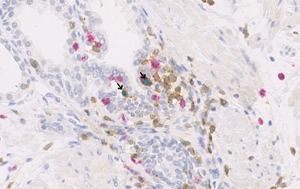
CD4 (brown), CD8 (red), and FOXP3 (green) expression in prostate tissue. Arrows indicate CD4+FOXP3+ Tregs in post‐atrophic hyperplasia at 40× magnification
Figure 4.
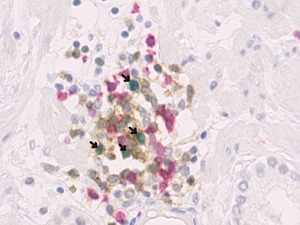
CD4 (brown), CD8 (red), and FOXP3 (green) expression in prostate tissue. Arrows indicate CD4+FOXP3+ Tregs in prostate tumor tissue at 40× magnification
Figure 5.
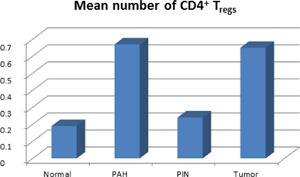
The mean number of CD4+FOXP3+ Tregs in stromal compartment of normal, PAH, PIN, and tumor histological lesions
Figure 6.
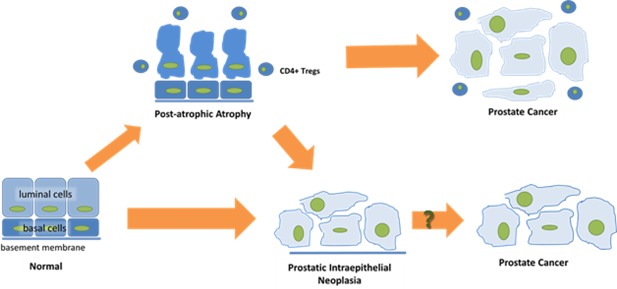
A schematic picture of early prostate cancer development in the presence of CD4+ Tregs. Exposure of normal prostate epithelial cells to infection, ischemia or a toxin can result in an influx of inflammatory cells and subsequent histological changes such as post‐atrophic hyperplasia (PAH). In the presence of CD4+ Tregs, PAH may progress to prostate cancer directly. Alternatively, progression of PIN to prostate cancer independently of Treg infiltration can occur
3.3. Correlation between CD4+FOXP3+ Tregs in different compartments in men with and without prostate cancer
The correlations between CD4+FOXP3+ Tregs in various histological lesions are shown in Table 2. In the combined group of cases and controls, the number of CD4+FOXP3+ Tregs in analogous lesion types between stromal and epithelial compartments were positively and statistically significantly correlated in areas of normal (r = 0.45; P < 0.0001) and PAH (r = 0.44; P < 0.0001) but not for PIN. The number of CD4+FOXP3+ Tregs in normal stroma was positively correlated with the number of CD4+FOXP3+ Tregs cells in all other stromal lesions except PIN. CD4+FOXP3+ Tregs cells in stromal PAH lesions were associated with CD4+FOXP3+ Tregs counts in all other stromal lesions. The number of CD4+FOXP3+ Tregs in normal epithelium was not associated with counts in PAH or PIN. CD4+FOXP3+ Tregs in PAH and PIN in the epithelium were also not correlated. In the cases, the number of positive CD4+FOXP3+ Tregs in both tumor stroma and tumor epithelial were positively associated with the number of positive cells in all other lesion types. The number of CD4+FOXP3+ Tregs in tumor stroma and tumor epithelium was also positively correlated.
Table 2.
Correlations between CD4+FOXP3+Tregs in different histological lesions in cases and controls
| Stroma | Epithelium | |||||||
|---|---|---|---|---|---|---|---|---|
| Normal | PAH | PIN | Tumor | Normal | PAH | PIN | Tumor | |
| Normal | 1.00 | 0.36 | 0.15 | 0.37 | 0.45 | 0.28 | 0.07 | 0.26 |
| Stroma | (<0.0001) | (0.07) | (<0.0001) | (<0.0001) | (0.001) | (0.43) | (0.002) | |
| PAH | − | 1.00 | 0.31 | 0.31 | 0.04 | 0.44 | 0.14 | 0.23 |
| Stroma | (0.0002) | (0.0002) | (0.66) | (<0.0001) | (0.10) | (0.007) | ||
| PIN | − | − | 1.00 | −0.01 | 0.09 | |||
| Stroma | (0.89) | (0.30) | ||||||
| Tumor | − | − | − | 1.00 | 0.22 | 0.38 | ||
| Stroma | (0.01) | (<0.0001) | ||||||
| Normal | − | − | − | − | 1.00 | 0.07 | 0.03 | 0.19 |
| Epithelium | (0.44) | (0.74) | (0.02) | |||||
| PAH | − | − | − | − | − | 1.00 | 0.11 | 0.28 |
| Epithelium | (0.22) | (0.001) | ||||||
| PIN | ‐ | − | − | − | − | − | 1.00 | |
| Epithelium | ||||||||
| Tumor | ‐ | − | − | − | − | − | − | 1.00 |
| Epithelium | ||||||||
3.4. CD4+FOXP3+ Tregs and tumor characteristics in men with prostate cancer
When we assessed if the presence of CD4+FOXP3+ Tregs were associated with clinical characteristics we found that a greater number of epithelial CD4+FOXP3+ Tregs in normal tissue was associated with higher Gleason score (P < 0.006). No association with Gleason score was found for other histological lesions. We found that only 6.4% of cases with low CD4+FOXP3+ Tregs in tumor stroma were in stage pT‐3 compared to 22% with high numbers of CD4+FOXP3+ Tregs (P < 0.03) and that more epithelial or stromal CD4+FOXP3+ Tregs in tumor‐adjacent normal were positively associated with pT‐stage (P < 0.03 and P < 0.018, respectively).
3.5. CD4+FOXP3+ Tregs and prostate cancer risk
We also explored whether stromal or epithelial CD4+FOXP3+ Tregs in any of the histological lesions were associated with an increased risk of prostate cancer (Table 3). We summed together all of the counts of positive cells over all the field views for each area of interest (normal stroma, normal epithelia, PAH stroma, PAH epithelia, PIN stroma, PIN epithelia) and divided the total count of cells by the number of field views. Using the mean, we observed that the presence of epithelial CD4+FOXP3+ Tregs in normal histological lesions was associated with a more than fourfold greater odds of developing prostate cancer (odds ratio:4.25; 95% confidence interval: 1.39‐12.95). This association remained statistically significant after adjustment for smoking status (odds ratio:4.67; 95% confidence interval: 1.50‐14.60). After adjustment for smoking status we also found a statistically significant increased odds of prostate cancer in men with stromal CD4+FOXP3+ Tregs in normal lesions (odds ratio:2.50; 95% confidence interval: 1.02‐6.09). No association was observed between infiltration of CD4+FOXP3+ Tregs in other compartments and risk of prostate cancer.
Table 3.
Odds ratios and 95% confidence intervals relating number of Tregs per field view with respect to prostate cancer
| Histological lesion | Unadjusted OR (95% CI) | Smoking adjusted OR (95% CI) |
|---|---|---|
| CD4+FOXP3+Tregs normal stroma | 2.17 (0.93‐5.05) | 2.50 (1.02‐6.09) |
| CD4+FOXP3+Tregs normal epithelium | 4.25 (1.39‐12.95) | 4.67 (1.50‐14.60) |
| CD4+FOXP3+ Tregs PAH stroma | 1.64 (0.75‐3.62) | 2.00 (0.88‐4.55) |
| CD4+FOXP3+ Tregs PAH epithelium | 1.76 (0.70‐4.44) | 1.82 (0.71‐4.64) |
| CD4+FOXP3+ Tregs PIN stroma | 1.82 (0.69‐4.86) | 1.97 (0.73‐5.31) |
| CD4+FOXP3+ Tregs PIN epithelium | 4.39 (0.97‐19.78) | 4.46 (0.98‐20.37) |
4. DISCUSSION
Accumulating evidence suggests that Tregs are able to suppress anti‐tumor immune responses, and contribute to an immunosuppressive microenvironment, thereby promoting immune evasion and cancer progression.18, 19 Modulation of Tregs has been recently linked to the IDO pathway with the demonstration of an active role of IDO in driving the differentiation of CD4+ T cells into FOXP3 inducible Tregs. These properties make also inhibition of Tregs as a cornerstone of anti‐cancer immunotherapy and cancer immune‐prevention. In the present study we provide one of the first comprehensive assessments of the prevalence of Treg populations in normal, PAH, PIN, and tumor tissue in men with and without prostate cancer.
Our study was performed for the first time in prostate macro whole cross‐sections of the entire prostate that provide a wider histological recognition of the histological prostate lesions and of the relationships among them. For instance, the assessment of the normal tissue actually adjacent to cancer is trivial in macro cross sections while it may be difficult or almost impossible in other prostate samples such as biopsies or TURPs. Our Tregs quantification method utilized a previously described triple staining protocol. Because we applied immunohistochemical staining instead of determining transcript levels and we used whole mount macro cross‐section instead of tissue micro arrays, we were able to reveal the prevalence of Tregs and define their location within a large amount of prostate tissues.
Our results provide important insights in both the phases of prostate cancer development and progression. In fact we have found in men with prostate cancer a statistically significant increase in the mean number of CD4+FOXP3+ Tregs in tumor stroma compared to normal stroma (P < 0.001). In addition, when we investigated whether Tregs were associated with an increased risk of developing prostate cancer we observed that the presence of epithelial CD4+ Tregs in normal tissues was associated with more than fourfold greater odds (odds ratio: 4.25; 95% confidence interval: 1.39‐12.95). This is in line with previous investigations addressing the presence of Tregs in prostate cancer which have reported higher numbers of Tregs in areas of tumor compared to normal.8, 9, 10, 20 To our knowledge, this is the first comprehensive study to also investigate the infiltration of Tregs in hypothesized prostate precursor lesions. Our investigation revealed that CD4+FOXP3+ Tregs are equally common in PAH as in tumor lesions (0.67 and 0.65, respectively) in men with prostate cancer. In a prior study investigating the distribution of cells positive for FOXP3 in benign, malignant, and atrophic prostate tissue obtained from 36 men undergoing radical prostatectomy, similar findings were reported. The authors reported no difference in cell count between prostate tumor and atrophy lesions. However, in contrast to our study, the Valdman et al9 study utilized immunohistochemistry on tissue micro arrays rather than on triple‐stained whole mount macro cross‐sections and atrophy lesions were not further classified as either simple atrophy or PAH.
The equal prevalence of CD4+FOXP3+ Tregs in PAH and tumor lesions supports the link between inflammation and prostate cancer.14, 21 In the prostate gland, chronic inflammation is associated with focal atrophy, especially PAH and simple atrophy. Several reports have suggested PAH, in particular, as a precancer lesion.22, 23, 24 We have previously reported that chronic inflammation in the presence of PAH is associated with greater likelihood of prostate cancer death.25 The present study identified similarly high numbers of CD4+FOXP3+ Tregs in areas of PAH and tumor, but lower numbers in PIN. This may reflect a possible pathway by which PAH develops directly into prostate cancer in the presence of Tregs (Figure 5). Altogether, these data support a role for the imbalance of Tregs in prostate cancer development.
To investigate the clinical impact of Tregs in prostate cancer we analyzed the association of CD4+FOXP3+ Tregs with clinical parameters. Our results showed that epithelial CD4+FOXP3+ Tregs in normal tissues were positively associated with both Gleason score and pT‐stage. In addition, we found that stromal CD4+FOXP3+ Tregs in normal tissues may be associated with higher pT‐stage. In fact, previous studies investigating the relationship of Tregs and clinical outcomes are inconsistent. Flammiger et al found a significant association between higher number of intratumoral Tregs and tumor‐stage, higher proliferation index, and decreased prostate specific antigen (PSA) recurrence‐free survival.11 In line with these results we previously reported that men with greater numbers of CD4+FOXP3+ Tregs in their prostate tumor environment have an increased risk of dying of prostate cancer.12 On the other hand, some studies have failed to identify an association between intratumoral Tregs and clinical variables such as Gleason score, tumor‐stage, or time to prostate specific antigen recurrence.10, 11, 26 The mechanism behind this association is still unclear and further studies are required to shed light on the potential role of Tregs as prognostic biomarkers in prostate cancer.
Finally, we found that CD8+FOXP3+ and LAG‐3+FOXP3+ expression in men with and without prostate cancer was rare. The low CD8+FOXP3+ immunoreactivity is consistent with our data in a previous study, where CD8+FOXP3+ Tregs were identified in only 3 out of 735 prostate cancer patients.12 Here we also investigated the prevalence of LAG‐3+FOXP3+ Tregs since previous studies have reported that LAG‐3 expression identifies a discrete population of Tregs that is expanded in peripheral blood and tumor sites of melanoma and colon cancer patients. Although Sfanos et al27 noted up‐regulation of LAG‐3 when performing microarray analysis on pooled Tregs obtained from the prostate gland of 11 patients we observed low LAG‐3FOXP3 positivity in our material. To our knowledge this is the first study to investigate the LAG‐3FOXP3 expression on protein level, which could explain the discrepancy between study results.
Prostate cancer is a multifactorial disease with a minority of cases with demonstrated inheritance and early onset. Unlike other epithelial malignancies prostate cancer harbors few driver mutations (SPOP), with the most frequent genetic alterations being fusions (TMPRSS2‐ERG FOXA1, CHD1), or altered regulation of the androgen receptor (mutations or splice variants) and the PI3 K signal transduction pathway. All these genetic alterations are involved in prostate cancer progression and transition to androgen resistance but do not seem self‐sufficient to drive early prostate carcinogenesis. The mean age of diagnosis for prostate cancer is about 65 with most patients harboring a non‐aggressive disease. Therefore, co‐factors other than genetic alterations are required for prostate transformation. Inflammation is a well‐known background condition favoring cancer development in many human epithelial malignancies, including the prostate. Although not bringing to definitive conclusions, our study provides evidence of a mechanism defining Tregs as potential co‐activators of prostate carcinogenesis.
5. CONCLUSIONS
Our data provide evidence that men with prostate cancer have more infiltration of CD4+FOXP3+ Tregs in their tumor lesions compared to normal tissues, but a similar distribution of these cells in PAH and tumor. The scarce presence of CD4+ Tregs in PIN indicates a pathway from normal to prostate cancer via PIN independently of Tregs. Moreover, our study shows that the presence of CD4+FOXP3+ Tregs in both tumor‐adjacent normal stroma and tumor‐adjacent normal epithelium is more common in prostate cancer tissue compared to healthy prostate tissue. To determine the prognostic value of CD4+FOXP3+ Tregs, future studies should investigate whether infiltration occurs prior to or following prostate tumor development. In the meantime, our results disclose potential chemo‐preventive applications targeting Tregs in patients with inherited risk of developing prostate cancer or known predisposing genetic alterations.
CONFLICTS OF INTEREST
The authors declare no conflict of interest.
ACKNOWLEDGMENTS
This research was supported by the Örebro County Council Research Committee, the Foundation for Medical Research at Örebro University Hospital and the Lions cancer foundation, Sweden.
Davidsson S, Andren O, Ohlson A‐L, et al. FOXP3+ regulatory T cells in normal prostate tissue, postatrophic hyperplasia, prostatic intraepithelial neoplasia, and tumor histological lesions in men with and without prostate cancer. The Prostate. 2018;78: 40–47. https://doi.org/10.1002/pros.23442
Sabina Davidsson, Ove Andren, Jessica Carlsson, Swen‐Olof Andersson, Francesca Giunchi, Jennifer R. Rider, and Michelangelo Fiorentino are a member of the Transdisciplinary Prostate Cancer Partnership (TopCaP).
Jennifer R. Ride, Michelangelo Fiorentino, Sabina Davidsson and Ove Andren contributed equally to this work.
REFERENCES
- 1. Ferlay J, Soerjomataram I, Dikshit R, et al. Cancer incidence and mortality worldwide: sources, methods and major patterns in GLOBOCAN 2012. Int J Cancer. 2015; 136:E359–E386. [DOI] [PubMed] [Google Scholar]
- 2. Nishikawa H, Sakaguchi S. Regulatory T cells in tumor immunity. Int J Cancer. 2010; 127:759–767. [DOI] [PubMed] [Google Scholar]
- 3. Barth SD, Schulze JJ, Kuhn T, et al. Treg‐mediated immune tolerance and the risk of solid cancers: findings from EPIC‐Heidelberg. J Natl Cancer Inst. 2015; 107. [DOI] [PubMed] [Google Scholar]
- 4. Javia LR, Rosenberg SA. CD4+CD25+ suppressor lymphocytes in the circulation of patients immunized against melanoma antigens. J immunother. 2003; 26: 85–93. [DOI] [PMC free article] [PubMed] [Google Scholar]
- 5. Curiel TJ, Coukos G, Zou L, et al. Specific recruitment of regulatory T cells in ovarian carcinoma fosters immune privilege and predicts reduced survival. Nat Med. 2004; 10:942–949. [DOI] [PubMed] [Google Scholar]
- 6. DeLong P, Carroll RG, Henry AC, et al. Regulatory T cells and cytokines in malignant pleural effusions secondary to mesothelioma and carcinoma. Cancer Biol Ther. 2005; 4:342–346. [DOI] [PubMed] [Google Scholar]
- 7. Dannull J, Su Z, Rizzieri D, et al. Enhancement of vaccine‐mediated antitumor immunity in cancer patients after depletion of regulatory T cells. J Clin Invest. 2005; 115:3623–3633. [DOI] [PMC free article] [PubMed] [Google Scholar]
- 8. Miller AM, Lundberg K, Ozenci V, et al. CD4+CD25high T cells are enriched in the tumor and peripheral blood of prostate cancer patients. J Immunol. 2006; 177:7398–7405. [DOI] [PubMed] [Google Scholar]
- 9. Valdman A, Jaraj SJ, Comperat E, et al. Distribution of Foxp3‐, CD4‐ and CD8‐positive lymphocytic cells in benign and malignant prostate tissue. APMIS. 2010; 118:360–365. [DOI] [PubMed] [Google Scholar]
- 10. Ebelt K, Babaryka G, Frankenberger B, et al. Prostate cancer lesions are surrounded by FOXP3+, PD‐1+ and B7‐H1+ lymphocyte clusters. Eur J Cancer. 2009; 45:1664–1672. [DOI] [PubMed] [Google Scholar]
- 11. Flammiger A, Weisbach L, Huland H, et al. High tissue density of FOXP3+ T cells is associated with clinical outcome in prostate cancer. Eur J Cancer. 2012; 49:1273–1279. [DOI] [PubMed] [Google Scholar]
- 12. Davidsson S, Ohlson AL, Andersson SO, et al. CD4 helper T cells, CD8 cytotoxic T cells, and FOXP3(+) regulatory T cells with respect to lethal prostate cancer. Mod Pathol. 2013; 26:448–455. [DOI] [PubMed] [Google Scholar]
- 13. Camisaschi C, Casati C, Rini F, et al. LAG‐3 expression defines a subset of CD4(+)CD25(high)Foxp3(+) regulatory T cells that are expanded at tumor sites. J Immunol. 2010; 184:6545–6551. [DOI] [PubMed] [Google Scholar]
- 14. De Marzo AM, Marchi VL, Epstein JI, Nelson WG. Proliferative inflammatory atrophy of the prostate: implications for prostatic carcinogenesis. Am J Pathol. 1999; 155: 1985–1992. [DOI] [PMC free article] [PubMed] [Google Scholar]
- 15. Humphrey PA, Moch H, Cubilla AL, Ulbright TM, Reuter VE. The 2016 WHO Classification of Tumours of the Urinary System and Male Genital Organs‐Part B: Prostate and Bladder Tumours. Eur Urol. 2016; 70: 106–119. [DOI] [PubMed] [Google Scholar]
- 16. De Marzo AM, Platz EA, Epstein JI, et al. A working group classification of focal prostate atrophy lesions. Am J Surg Pathol. 2006; 30:1281–1291. [DOI] [PubMed] [Google Scholar]
- 17. Edge SB, Compton CC. The American Joint Committee on Cancer: the 7th edition of the AJCC cancer staging manual and the future of TNM. Ann Surg Oncol. 2010; 17: 1471–1474. [DOI] [PubMed] [Google Scholar]
- 18. Elkord E, Alcantar‐Orozco EM, Dovedi SJ, Tran DQ, Hawkins RE, Gilham DE. T regulatory cells in cancer: recent advances and therapeutic potential. Expert Opin Biol Ther. 2010; 10: 1573–1586. [DOI] [PubMed] [Google Scholar]
- 19. Nishikawa H, Sakaguchi S. Regulatory T cells in cancer immunotherapy. Current Opin Immunol. 2014; 27:1–7. [DOI] [PubMed] [Google Scholar]
- 20. Miller AM, Pisa P. Tumor escape mechanisms in prostate cancer. Cancer Immunol Immunother. 2007; 56:81–87. [DOI] [PMC free article] [PubMed] [Google Scholar]
- 21. De Marzo AM, DeWeese TL, Platz EA, et al. Pathological and molecular mechanisms of prostate carcinogenesis: implications for diagnosis, detection, prevention, and treatment. J Cell Biochem. 2004; 91:459–477. [DOI] [PubMed] [Google Scholar]
- 22. Shah R, Mucci NR, Amin A, Macoska JA, Rubin MA. Postatrophic hyperplasia of the prostate gland: neoplastic precursor or innocent bystander? Am J Pathol. 2001; 158:1767–1773. [DOI] [PMC free article] [PubMed] [Google Scholar]
- 23. Ruska KM, Sauvageot J, Epstein JI. Histology and cellular kinetics of prostatic atrophy. Am J Surg Pathol. 1998; 22:1073–1077. [DOI] [PubMed] [Google Scholar]
- 24. Anton RC, Kattan MW, Chakraborty S, Wheeler TM. Postatrophic hyperplasia of the prostate: lack of association with prostate cancer. Am J Surg Pathol. 1999; 23:932–936. [DOI] [PubMed] [Google Scholar]
- 25. Davidsson S, Fiorentino M, Andren O, et al. Inflammation, focal atrophic lesions, and prostatic intraepithelial neoplasia with respect to risk of lethal prostate cancer. Cancer Epidemiol Biomarkers Prev. 2011; 20:2280–2287. [DOI] [PMC free article] [PubMed] [Google Scholar]
- 26. Fox SB, Launchbury R, Bates GJ, et al. The number of regulatory T cells in prostate cancer is associated with the androgen receptor and hypoxia‐inducible factor (HIF)‐2alpha but not HIF‐1alpha. Prostate. 2007; 67:623–629. [DOI] [PubMed] [Google Scholar]
- 27. Sfanos KS, Bruno TC, Maris CH, et al. Phenotypic analysis of prostate‐infiltrating lymphocytes reveals TH17 and Treg skewing. Clin Cancer Res. 2008; 14:3254–3261. [DOI] [PMC free article] [PubMed] [Google Scholar]


