

Abstract
Objective
Mucopolysaccharidosis IIIA or Sanfilippo disease type A is a progressive neurodegenerative disorder presenting in early childhood, caused by an inherited deficiency of the lysosomal hydrolase sulfamidase. New missense mutations, for which genotype–phenotype correlations are currently unknown, are frequently reported, hampering early prediction of phenotypic severity and efficacy assessment of new disease‐modifying treatments. We aimed to design a method to determine phenotypic severity early in the disease course.
Methods
Fifty‐three patients were included for whom skin fibroblasts and data on disease course and mutation analysis were available. Patients were phenotypically characterized on clinical data as rapidly progressing or slowly progressing. Sulfamidase activity was measured in fibroblasts cultured at 37 °C and at 30 °C.
Results
Sulfamidase activity in fibroblasts from patients homozygous or compound heterozygous for a combination of known severe mutations remained below the limit of quantification under both culture conditions. In contrast, sulfamidase activity in fibroblasts from patients homozygous or compound heterozygous for a known mild mutation increased above the limit of quantification when cultured at 30 °C. With division on the basis of the patients' phenotype, fibroblasts from slowly progressing patients could be separated from rapidly progressing patients by increase in sulfamidase activity when cultured at 30 °C (p < 0.001, sensitivity = 96%, specificity = 93%).
Interpretation
Phenotypic severity strongly correlates with the potential to increase sulfamidase activity in fibroblasts cultured at 30 °C, allowing reliable distinction between patients with rapidly progressing or slowly progressing phenotypes. This method may provide an essential tool for assessment of treatment effects and for health care and life planning decisions. Ann Neurol 2017;82:686–696
Mucopolysaccharidosis type III (MPS III) or Sanfilippo syndrome is an autosomal recessive lysosomal storage disorder primarily characterized by central nervous system degeneration leading to progressive neurocognitive impairment. Generally, MPS III manifests at 2 to 3 years of age with developmental delays, initially appearing as language deficits followed by behavioral problems, sleep difficulties, progressive cognitive and motor function regression, and early demise.1, 2 Currently, no disease‐modifying treatment is available. The estimated birth prevalence of MPS III is 0.28 to 1.89 per 100,000 live births.3, 4, 5 Four subtypes (A–D) are recognized; each subtype is caused by a defect in a different enzyme required for lysosomal degradation of the glycosaminoglycan heparan sulfate (HS).6 MPS IIIA (Online Mendelian Inheritance in Man database #252900) is due to a deficiency of the enzyme sulfamidase (SGSH; also known as N‐sulfoglucosamine sulfohydrolase or heparan‐N‐sulfatase; E.C.3.10.1.1)7 and is the most common of the 4 subtypes. It is increasingly recognized that the progression of the disease varies considerably from patient to patient. In contrast to the classical severe phenotype, a more attenuated phenotype has been observed in some patients, characterized by cognitive and motor functions that remain stable for many years.8, 9 In a recent study, MPS IIIA patients were sorted into 2 phenotypic groups: rapidly progressing (RP) and slowly progressing (SP).2
The variability in disease progression is related to variations in residual SGSH activity due to different missense mutations and allelic heterogeneity, and strong genotype–phenotype correlations have been shown in several studies.1, 10, 11 However, new missense mutations are frequently reported, hampering the early assessment of phenotypic severity in these patients.12, 13 As a disease‐modifying treatment of MPS IIIA is imminent, with gene therapy now in trials,14, 15 early diagnosis will be paramount, for example, by newborn screening (NBS), to allow timely initiation of treatment. Early assessment of the phenotype, even before the onset of clinical signs and symptoms, will thus be crucial both for the selection of patients for trials and for the assessment of treatment effects.
Based on previous studies of MPS IIIB,16 we aimed to determine a method for predicting phenotypic severity in MPS IIIA patients using temperature sensitivity of residual SGSH activity in cultured fibroblasts.16
Subjects and Methods
Patients
All known MPS IIIA patients at our center for whom skin fibroblasts, disease course data, and mutation analysis data were available were included in this study (Tables 1 and 2). Patients were phenotypically characterized as either RP or SP by consensus among 4 clinicians with long‐standing experience in the diagnosis and follow‐up of patients with MPS III (F.A.W. [author] and J.d.R., M.J.V., and L.W. [Acknowledgment]). This classification was holistically based on the following clinical information: age at loss of meaningful verbal communication, age at loss of independent walking, and age at death. Patients who still maintained these functions were assigned as not applicable in Tables 1 and 2. Classification was done by taking these retained functions into account and solely based on clinical information. During classification, clinicians were unaware of patients' genotypes. Cognitive test results were taken into account when available. Patients who had received experimental treatment (enzyme replacement therapy, high‐dose synthetic genistein, or hematopoietic stem cell transplantation) were only included if sufficient clinical data were available before the start of therapy. The rating clinicians were unaware of the results of the mutation analysis and of the biochemical assays performed within the scope of this study before and during phenotyping.
Table 1.
Clinical Characteristics and Genotypes of Rapidly Progressing Mucopolysaccharidosis Type IIIA Patients
| ID/Gender | Mutation 1 | Mutation 2 | Age at Loss of Speech/Walking, yr | Current Age (age at death), yr |
|---|---|---|---|---|
| 1/M | p.R245H | p.R245H | 5/12 | (17) |
| 2/F | p.R245H | p.Q380R | 11/19 | 20 |
| 3/M | p.R245H | c.1080delC | 5/NA | (14) |
| 4/F | c.1080delC | c.1080delC | 5/9 | (18) |
| 5/M | p.R433W | p.R433W | 6/NA | 6 |
| 6/F | p.S66W | p.S66W | 5/NA | 4 |
| 7/F | c.376insG | c.1080delC | NA/NA | 4 |
| 8/M | p.Q380R | p.R245H | 2/7 | (14) |
| 9/F | p.R245H | p.R245H | 6/12 | (18) |
| 10/M | p.R245H | p.R245H | 5/10 | (16) |
| 11/F | p.R245H | p.R245H | 7/17 | (18) |
| 12/M | p.Q380R | p.R245H | 4/7 | (14) |
| 13/F | p.S298P | c.1080delC | 10/11 | (12) |
| 14/M | p.R245H | p.R245H | 4/5 | (7) |
| 15/F | p.R245H | p.R245H | 5/10 | (11) |
| 16/M | p.R245H | p.R245H | 5/11 | (21) |
| 17/M | p.R74C | p.G191R | 7/10 | (19) |
| 18/F | p.S66W | p.Q380R | 9/12 | (17) |
| 19/F | p.S66W | p.Q380R | 6/9 | (14) |
| 20/M | p.R245H | p.Q380R | 7/16 | (19) |
| 21/M | p.R245H | p.Q380R | 6/11 | (14) |
| 22/F | p.R245H | p.R245H | 5/9 | (15) |
| 23/F | p.R245H | p.R245H | 3/12 | (14) |
| 24/M | p.R245H | p.R245H | 6/15 | (18) |
| 25/M | p.R245H | p.R245H | 4/17 | (25) |
| 26/M | p.R245H | p.Q380R | 8/10 | (20) |
Current age represents the age at the time of phenotyping.
F = female; M = male; NA = not applicable.
Table 2.
Clinical Characteristics and Genotypes of Slowly Progressing Mucopolysaccharidosis Type IIIA Patients
| ID/Gender | Mutation 1 | Mutation 2 | Age at Loss of Speech/Walking, yr | Current Age (age at death), yr |
|---|---|---|---|---|
| 27/F | p.R245H | p.S298P | 8/NA | 22 |
| 28/M | p.S298P | p.T421R | 10/NA | 18 |
| 29/M | p.S298P | p.T421R | NA/NA | 16 |
| 30/M | p.S298P | p.R245H | 19/23 | (26) |
| 31/F | p.S298P | p.S298P | NA/NA | 26 |
| 32/M | p.S298P | p.S298P | NA/NA | 9 |
| 33/F | p.S298P | p.S298P | NA/NA | 28 |
| 34/M | p.R245H | p.S298P | 11/42 | NK |
| 35/F | p.R245H | p.S298P | 6/25 | (52) |
| 36/F | p.R245H | p.S298P | 15/25 | (33) |
| 37/M | p.S66W | p.S298P | 47/47 | (60) |
| 38/F | p.S298P | c.1080delC | 22/NA | 22 |
| 39/M | p.S298P | p.R377H | 8/17 | 32 |
| 40/M | p.R245H | p.S298P | 32/32 | NK |
| 41/F | p.R245H | p.S298P | 11/21 | 28 |
| 42/M | p.S298P | p.R245H | 21 /24 | NK |
| 43/M | p.R245H | p.S298P | 25 /28 | NK |
| 44/F | p.R245H | p.S298P | 10/29 | (36) |
| 45/M | p.R245H | p.S298P | 18/28 | (28) |
| 46/F | p.S298P | p.L411R | 16/20 | 43 |
| 47/M | p.R245H | p.S298P | 18/26 | (50) |
| 48/F | p.R245H | p.S298P | 10/20 | (34) |
| 49/M | p.R245H | p.S298P | 5/23 | (26) |
| 50/M | p.R245H | p.Q380R | 9/18 | (23) |
| 51/F | p.S298P | p.S298P | 25/25 | NK |
| 52/M | p.R245H | p.S298P | 5/25 | 48 |
| 53/F | p.R74C | p.N274D | NA/NA | 12 |
Current age represents the age at the time of phenotyping.
F = female; M = male; NA = not applicable; NK = not known.
For the use of the cultured skin fibroblasts, written informed consent was obtained from the parents or legal guardians of the patients. Alternatively, when fibroblasts were acquired before 1996, they were used according to the Dutch Human Tissue and Medical Research Code of Conduct for Responsible Use 2011. Ethical approval was sought from the medical ethical committee of the Academic Medical Center. Ethical approval was waived because of the noninvasive, retrospective nature of the study and because all fibroblast cultures were previously collected and stored in the context of patient care.
Fibroblast Cultures
Cultured skin fibroblasts were obtained from the cell banks of the Laboratory of Genetic Metabolic Diseases at the Academic Medical Center, Amsterdam, and from the Department of Clinical Genetics at the Erasmus Medical Center, Rotterdam, the Netherlands. Control and patient fibroblasts were cultured in a humidified atmosphere containing 5% CO2 at 37 °C in Dulbecco Modified Eagle Medium (Lonza, Walkersville, MD) supplemented with 10% fetal bovine serum (Gibco, Rockville, MD), 100U/ml−1 penicillin, 100 µg/ml−1 streptomycin, and 250 µg/ml−1 amphotericin. All cell lines were grown at both 37 °C and 30 °C until confluency, and the medium was refreshed once per week. One week after confluency, the medium was removed, and the cell layers were washed in phosphate‐buffered saline (PBS; Fresenius Kabi, Graz, Austria). Then, the cells were harvested and stored as pellets at −80 °C until further use. For addition of bortezomib (Bio‐Connect, Huissen, the Netherlands), stock solutions were prepared in dimethylsulfoxide (DMSO) and diluted in culture medium to a final DMSO concentration of 0.1%.
Residual SGSH Activity
Experimenters measuring SGSH activity were blinded to the phenotypic classification of each patient (RP or SP). Cell pellets were resuspended in Milli‐Q (Millipore, Bedford, MA) and disrupted by sonication using a Vibra Cell sonicator (Sonics Materials, Newton, CT). The protein concentrations in the cell lysates were determined by using a bicinchoninic acid assay as described by Smith et al.17 Bovine serum albumin diluted in Milli‐Q was used as a standard.
For measuring residual SGSH activity, the fluorometric assay described by Karpova et al18 was optimized for incubation time and protein concentration. As SGSH activity was linear up to at least 24 hours of incubation time and up to a final protein concentration of 0.33mg/ml−1 (Fig 1), these conditions were chosen for the assay. The normal SGSH activity in fibroblasts of healthy controls ranges from 2 to 8nmol/h−1/mg−1. We found that SGSH activity could be measured in fibroblasts with a limit of detection of 0.019nmol/h−1/mg−1 (0.95% of lower limit of normal [LLN]) and a limit of quantification of 0.062nmol/h−1/mg−1 (3.1% LLN), defined as 3 and 10 times the standard deviation of 10 blank sample measurements, respectively. Intra‐ and interassay variation measured in control fibroblast lysates (n = 10) were 3% and 7%, respectively.
Figure 1.
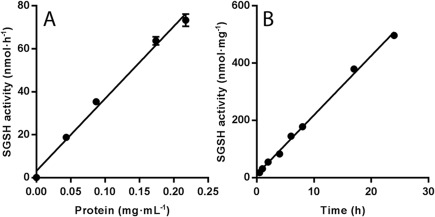
Linearity of (A) protein concentration and (B) incubation time in sulfamidase (SGSH) activity assay in cultured fibroblasts of control cell line.
4‐Methylumbelliferyl 2‐deoxy‐2‐sulfamino‐α‐D‐glucopyranoside (4‐MU‐GlcNS; Carbosynth, Compton, UK) was used as a substrate. Residual SGSH activity was determined using a 2‐step assay. The assay mixture (30 µl final volume, pH = 6.5, adjusted with HCl) contained 3.3mM 4‐MU‐GlcNS, 19.3mM sodium barbital, 19.3mM sodium acetate, and 77.3mM NaCl. The reaction was initiated by the addition of the cell lysates (10 µg protein). After 24 hours of incubation at 37 °C, 6 µl of 0.4M sodium phosphate, 0.2M citrate (pH = 6.7), and 10 µl of α‐glucosidase (10U/ml−1, dissolved in 2g/l−1 heat‐inactivated [20 minutes at 60 °C] bovine serum albumin [BSA]) were added followed by a 24‐hour incubation at 37 °C to release the fluorochrome 4‐MU. The reaction was stopped by adding 454 µl of 0.2M Na2CO3, 0.5M glycine (pH = 10.5). The amount of 4‐MU was quantified using a fluorometer (Perkin Elmer, Waltham, MA; excitation = 360nm, emission = 450nm) and an external 4‐MU standard curve (Glycosynth, Warrington, Cheshire, UK). All enzyme activity assays were performed in duplicate.
Western Blotting
Cell lysates were diluted with NuPAGE 4 × lithium dodecyl sulfate sample buffer and NuPAGE Reducing Agent (Invitrogen, San Diego, CA). A total of 40 µg of protein was loaded on a 4 to 12% Bis‐Tris gel for electrophoresis at 200V for 75 minutes and then transferred to a nitrocellulose membrane. The membranes were blocked for 1 hour with 30g/l−1 BSA in PBS and incubated overnight at 4?C with monoclonal anti‐SGSH (EPR17312, ab 200346, Abcam, Cambridge, UK) diluted to 1:1,000 in PBS containing 1g/l−1 Tween‐20 (PBSt). The membranes were washed 5 times in PBSt and incubated with goat–antirabbit IgG (1:10,000 in PBSt; IRDye 800CW, LI‐COR, Lincoln, NE) for 1 hour at room temperature. Subsequently, the membranes were washed 5 times in PBSt, and the SGSH bands were visualized using an Odyssey Infrared Imaging System and software (LI‐COR).
GAG Analysis
Cell lysates were diluted to 0.5mg/ml−1. HS levels were measured as described previously19 with minor modifications. In the final deproteination step, samples were loaded on an Amicon Ultra 10kD centrifugal filter (Millipore) instead of using a 30kD filter.
Immunofluorescence Microscopy
For immunofluorescence microscopy, fibroblasts were grown on glass coverslips in 6‐well plates (Sigma‐Aldrich, St Louis, MO) for 24 hours after culturing as described for the SGSH activity assay. The cells were washed in PBS and fixed with methanol for 5 minutes. Then, the cells were washed again and blocked for 30 minutes with PBSt containing 20g/l−1 BSA and 0.3M glycine. The cells were incubated with anti‐SGSH (EPR17312, ab200346, Abcam) diluted to 1:250 in PBSt containing 10gl−1 BSA (PBSt+BSA) for 45 minutes at room temperature. Subsequently, the cells were washed in PBSt and incubated for 45 minutes with Alexa Fluor 555 goat–antirabbit secondary antibody (Thermo Fisher Scientific, Waltham, MA) diluted to 1:1,000 in PBSt+BSA. Coverslips were washed 3 times in PBSt+BSA and once in Milli‐Q before they were mounted with Prolong Gold Antifade Mountant with DAPI (Thermo Fisher Scientific). The cells were imaged using a TCS SP8 confocal microscope (Leica, Wetzlar, Germany).
Statistical Analysis
Data were analyzed using SPSS software for Windows (v23.0, SPSS, Chicago, IL). Descriptive statistics were used to describe gender, phenotype, and frequency of death and to calculate the median age at loss of meaningful verbal communication and loss of independent walking. Because most of the SGSH activities remained below the limit of quantification, categorical analysis was used to analyze the relationships between residual SGSH activities under different culture conditions and phenotypes as assessed by the clinical experts. Fisher exact test was used to compare binary SGSH activities (below or above the limit of quantification) between the phenotypic groups and to determine sensitivity and specificity. Mann–Whitney U test was used to investigate the distribution of HS levels between the phenotypic groups. A probability value of <0.05 was considered statistically significant.
Quantitative Real‐Time Polymerase Chain Reaction
For total RNA isolation from human fibroblasts, TRI Reagent (Sigma‐Aldrich) was used, and cDNA was produced using Quantitect Reverse Transcription Kit (Qiagen, Hilden, Germany). Real‐time polymerase chain reaction (PCR) analysis for SGSH was performed using LightCycler 480 SYBR Green I Master, and cDNA samples were run on the LightCycler480 Instrument (Roche, Mannheim, Germany). Data were analyzed using linear regression calculations. All analyses were performed in triplicate.
SGSH mRNA was normalized using the geometric mean derived from the reference genes cyclophilin B (PPIB) and H3 histone family member 3A (H3F3A). Primer sequences were ctctttcgcaatgccttcac (hSGSH2cdna175F) and tgtcgaaggagttgaagtgg (hSGSH2cdna288R).
Results
Patients
Fifty‐three confirmed MPS IIIA patients from 42 families were included in this study. Twenty‐nine were male (54.7%), and 24 were female (45.3%; see Tables 1 and 2). Twenty‐six patients were classified by the expert panel as having the RP phenotype (49%), and 27 patients were classified by the expert panel as having the SP phenotype (51%). At the time of this study, 32 of the 53 patients (60.4%) were deceased. The median age of death was significantly younger for the RP patients (n = 22, median = 16.5 years, range = 7–25 years) than for the SP patients (n = 10, median = 33.5 years, range = 23–60 years; p < 0.001). The median age at loss of speech was 6 years for the RP patients (range = 4–10 years) and 15 years for the SP patients (range = 5–47 years; p < 0.001). The median age at loss of walking was 11 years in the RP group (range = 5–19 years) and 25 years in the SP group (range = 17–47 years; p < 0.001).
Mutations
To date, 137 different mutations have been reported in the Human Gene Mutation Database (www.hgmd.cf.ac.uk), of which the majority are missense mutations.20, 21 The patients in this study carried 14 different mutations in the SGSH gene, which included all but 1 previously reported as pathogenic.11, 22, 23, 24 The c.820A>G (p.N274D) mutation found in Patient 53 (see Table 2) was not previously reported but was predicted to be pathogenic by SIFT, Mutation Taster, and Polyphen‐2 prediction software.
SGSH Activity in Fibroblasts after Culturing at 37 °C and at 30 °C
Residual SGSH activity was measured in skin fibroblasts cultured at 37 °C and at 30 °C to determine the relationship between both genotype (divided into 3 groups based on previous studies1, 10, 11 and phenotype (divided into 2 groups by the experts) and the potential to upregulate SGSH activity at low temperature. The genotypic groups were based on previously described genotype–phenotype correlations.11 Group 1 consisted of patients homozygous or compound heterozygous for a combination of the common severe mutations p.R245H, p.Q380R, p.S66W, and c.1080delC (23 patients). Group 2 consisted of patients heterozygous for a known mild and a known severe mutation (18 patients). Group 3 consisted of patients homozygous for the known mild mutation p.S298P (4 patients).
Residual SGSH activity in cell lines from patients in Group 1 (23 patients) remained below the limit of quantification at both culture temperatures (Fig 2). In contrast, homozygosity for the previously reported “mild” mutation p.S298P (4 patients in Group 3) resulted in an increase in residual SGSH activity in fibroblasts cultured at 30 °C up to a median of 0.6nmol/h−1/mg−1 (30% LLN). Fibroblasts from all 18 patients who were compound heterozygous for p.S298P and 1 of the severe mutations (Group 2) exhibited an intermediate response with a median residual activity of 0.29nmol/h−1/mg−1 (14.5% LLN; see Fig 2). Subsequently, we looked at the relation between SGSH activity and phenotype as classified by the clinicians. SGSH activity in fibroblasts from all patients classified as RP (26 patients) except 1 remained below the limit of quantification under both culture conditions. In strong contrast, fibroblasts from patients classified as SP (27 patients) exhibited a significant increase in median SGSH activity when cultured at 30 °C (all patients but 2 increased above the limit of quantification, median SGSH activity = 0.30nmol/h−1/mg−1 [15% LLN], upper limit = 0.85nmol/h−1/mg−1 [43% LLN]) compared to the activity at 37 °C (all below the limit of quantification; Fisher exact test, p < 0.001 with a sensitivity and specificity of 96% and 93%, respectively; Fig 3). The increase in residual activity of SP fibroblasts was up to 43% of the lower limit of normal SGSH activity.
Figure 2.
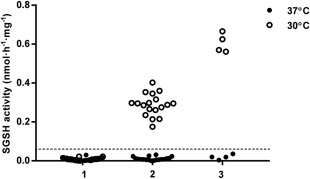
Residual sulfamidase (SGSH) enzyme activity in fibroblasts at 37 °C and at 30 °C. Group 1 (n = 23) was homozygous or compound heterozygous for the common severe mutations p.R245H, p.Q380R, p.S66W, or c.1080delC. Group 2 (n = 18) was compound heterozygous for 1 of the severe mutations and the mild p.S298P mutation. Group 3 (n = 4) was homozygous for the mild p.S298P mutation. The limit of quantification is indicated as a dashed line.
Figure 3.
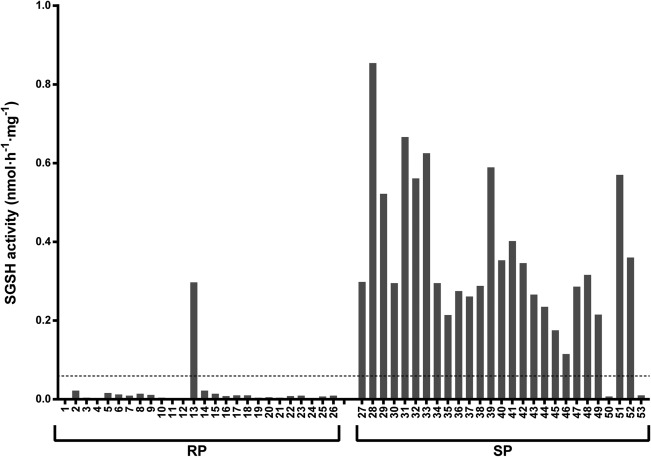
Residual sulfamidase (SGSH) enzyme activity in fibroblasts obtained from 53 mucopolysaccharidosis type IIIA patients and cultured at 30 °C. The patients are divided into 2 phenotypic group: rapidly progressing (RP) and slowly progressing (SP). The numbers correspond to the patient numbers as listed in Tables 1 and 2. The limit of quantification is indicated as a dashed line.
Western Blot and Quantitative PCR
Western blot analysis for SGSH showed an immunoreactive band at 56kDa in control cell lines, in accordance with previous publications (Fig 4).25, 26 In line with the very low to absent enzyme activity, no SGSH protein was detected in fibroblasts from patients homozygous or compound heterozygous for common severe mutations under both culture conditions. However, in cell lines carrying the attenuated genotypes p.S298P/p.S298P (Patient 32) and p.S298P/p.T421R (Patient 28), a clear band was visible at 56kDa after culturing at 30 °C, corresponding to the increase in SGSH activity observed at the lower temperature. The influence of increased protein synthesis was marginal, because mRNA levels as measured by Quantitative PCR (qPCR) of the SGSH gene were not significantly different for both culture temperatures (data not shown). These results suggest that enhanced enzyme activity corresponds to improved protein folding and/or decreased breakdown of the mutant protein. This was further evaluated by adding the proteasome inhibitor bortezomib to cell culture medium during 48 hours. Bortezomib increased the band representing the precursor of SGSH; however, the mature 56kDa active form did not increase (Fig 5). These findings were confirmed by the lack of increase, and even decrease, in SGSH activity after addition of bortezomib. The fibroblasts of Patient 53, who has an attenuated phenotype and carries a previously unreported mutation (p.N274D) in combination with a common severe mutation, showed increased SGSH protein concentration after being cultured at 30 °C. Remarkably, SGSH activity was not increased by culturing fibroblasts at 30 °C (see Fig 3).
Figure 4.
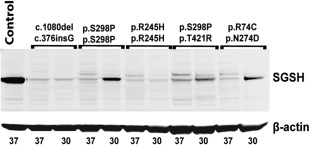
Western blot of patient fibroblast cell lysates. An immunoreactive 56kDa band was observed in samples from control cells and from slowly progressing mucopolysaccharidosis type IIIA patient cells cultured at 30 °C. ß‐actin was used as a protein loading control. Culture temperatures in °C are indicated below the lanes. SGSH = sulfamidase.
Figure 5.
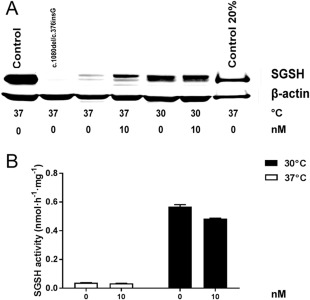
Western blot (A) and sulfamidase (SGSH) enzyme activity (B) in fibroblast cell lysate with addition of bortezomib at 2 concentrations (0 and 10nM) for 48 hours. Mucopolysaccharidosis type IIIA (lane 2: c.1080delC/c.376insG; lanes 3–6: p.S298P/p.S298P) and control fibroblasts (lane 1) were cultured at 37 °C and 30 °C for 48 hours instead of 1 week. To show the location of the mature SGSH band more accurately a diluted control sample was loaded in lane 7. SGSH activity was measured in p.S298P/p.S298P cell lysates.
Heparan Sulfate Concentration in Fibroblasts Cultured at 37 °C and at 30 °C
HS levels were measured in fibroblasts from 8 RP and 9 SP patients under different culture conditions to verify whether the increase in SGSH activity in SP fibroblasts cultured at 30 °C led to a decrease in its substrate (Fig 6). No significant difference in HS levels between RP and SP patients was found when cells were cultured at 37 °C. Consistent with the increased SGSH activity in fibroblasts cultured at 30 °C, a significant difference in HS levels was observed between RP and SP patients; significantly lower HS levels were observed in fibroblasts from SP patients than in those from RP patients (Mann–Whitney U test, p < 0.001). Fibroblasts from patients with the SP phenotype had HS levels comparable to those of control fibroblasts.
Figure 6.
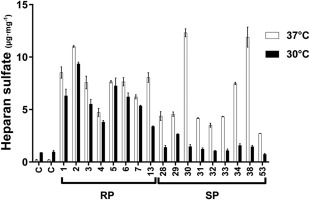
Heparan sulfate levels measured in control cells (C) and in patient cell lines cultured at 37 °C and at 30 °C. The samples were measured in duplicate. The data are represented as medians and ranges. The numbers correspond to patient numbers as listed in Tables 1 and 2. RP = rapidly progressing; SP = slowly progressing.
Immunofluorescence
To confirm the results obtained by Western blot and to verify the lysosomal localization of the increased SGSH concentration, we analyzed the cellular distribution of SGSH by immunofluorescence microscopy using a monoclonal antibody for SGSH. A punctate pattern was observed in both cell lines carrying p.S298P/p.T421R (Patient 29) and cell lines carrying p.R74C/p.N274D (Patient 53) when cultured at 30 °C, indicating that SGSH is likely localized to lysosomes (Fig 7).
Figure 7.
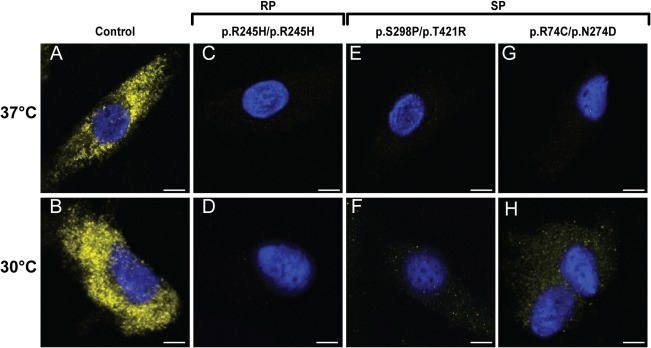
Immunofluorescence microscopy using a monoclonal antibody directed at sulfamidase (stained yellow). Upper panels: Fibroblasts cultured at 37 °C. Lower panels: Fibroblasts cultured at 30 °C. (A, B) Fibroblasts from a healthy control. (C–H) Fibroblasts from mucopolysaccharidosis type IIIA patients (rapidly progressing [RP], Patient 1; slowly progressing [SP], Patients 29 and 53). Scale bars indicate 20 μm.
Discussion
We show that the ability to increase residual enzyme activity in fibroblasts cultured at 30 °C is strongly associated with the SP phenotype in MPS IIIA. In addition, we show that the increased enzyme activity corresponded to an increase in the concentration of the SGSH protein and a decrease in its substrate, HS, confirming its biological activity. These results are in line with the lysosomal localization of SGSH demonstrated by immunofluorescence. Because these findings are based on a Dutch patient population containing a homogenous set of mutations, it would be expedient to repeat our studies in populations with different genotypes to confirm our findings. The potential to increase residual enzyme activity in fibroblasts cultured at a low temperature has been reported previously in the context of other genetic diseases, including MPS IIIB.16, 27, 28 The increase in SGSH activity in the fibroblasts of SP patients was up to 43% of the lower limit of normal activity. Previous studies of other lysosomal enzymes, including glucosylceramide β‐glucosidase and β‐hexosaminidase A, did show that 10 to 15% of the residual lysosomal enzyme activity prevented the accumulation of metabolites.29, 30 This, in combination with the observation that HS levels even normalized in some fibroblast cell lines at 30 °C, suggests that this effect might be of clinical relevance if the same effect were induced, for example, by pharmacological chaperones. However, the underlying mechanism of this upregulation of residual enzyme activity at a low temperature in the fibroblasts of patients with the attenuated SP phenotype has not yet been elucidated. We hypothesize that certain missense mutations may result in improved protein folding and/or a decrease in protein degradation at lower temperatures and that these characteristics are related to higher residual activity in vivo, leading to a less severe phenotype. With addition of bortezomib, the precursor of SGSH increased; however, the 56kD band representing the mature protein did not. These findings show that inhibiting proteosomal degradation of mutant protein does not result in more active protein. Also, SGSH activity did not increase with bortezomib. To investigate involvement of protein synthesis, a qPCR was performed on cells cultured at both temperatures. No significant increase in mRNA expression was found at 30 °C (data not shown). These results reinforce that the increase in SGSH activity found at 30 °C is more likely a result of improved processing/folding than of an increased synthesis and/or decreased degradation.
Currently, a number of clinical trials are investigating different disease‐modifying treatment options for MPS IIIA, including gene therapy and high‐dose synthetic genistein.14, 15 The prediction of untreated disease progression (in RP or SP patients) is crucial for the inclusion of patients in trials, as the assessment of treatment effects must be related to the expected natural history of the disease. A recently published prospective natural history study provided essential data and showed that patients with the RP phenotype plateaued in cognitive development by 30 months, followed by a rapid regression after 40 to 50 months, whereas children with an SP phenotype had a similar but more prolonged course.2 In that publication, patients were separated post hoc into those with the RP and SP phenotypes based on the age at diagnosis (before or after 6 years of age) and/or a known severe genotype. We feel that the age at diagnosis cannot be used as a universal criterion, as it will depend on the availability and structure of the health care system in different countries. Furthermore, there is no doubt that the efficacy of any disease‐modifying therapy for MPS IIIA will depend on the timing of the start of treatment and that early and even presymptomatic treatment is likely to result in the best outcome. Early diagnosis will thus be essential and can only be achieved by increasing awareness for MPS III and, probably best, by NBS. Earlier studies showed that NBS for MPS IIIA is feasible, for example, by measuring HS concentrations or lysosomal protein concentrations in dried blood spots.22, 31, 32 Early diagnosis, especially through NBS, will make reliable assessment of the phenotype crucial, either by genotyping or, if that is inconclusive, by other methods such as the method reported here. Classification using our newly developed in vitro method did not match the clinical classification for only a few patients.
Fibroblasts from 1 patient classified as RP (Patient 13) exhibited an increase in SGSH activity and a decrease in HS when cultured at 30 °C (see Figs 3 and 6). However, this patients’ sibling, Patient 38, with the same p.S298P/c.1080delC genotype and the same responses in the biochemical assays, was classified as SP. The more severe course of the disease in Patient 13 might be related to the frequent occurrence of severe intermittent illnesses during childhood, which illustrates that disease severity is dependent not only on genotype but also, at least in part, on external factors.
Furthermore, fibroblasts from 2 patients clinically classified as SP (Patients 50 and 53) did not exhibit increases in SGSH activity levels at 30 °C. Patient 50 was compound heterozygous for 2 classic severe mutations. However, the phenotypic classification of this patient was probably influenced by maintaining the ability to walk longer and dying at an older age than most RP patients. This illustrates that the MPS IIIA phenotype occurs on a spectrum that cannot be fully separated within 2 categories. This spectrum of severity is also supported by the intermediate response of SGSH activity at 30 °C observed in fibroblasts from patients who are compound heterozygous for a classical severe mutation and a classical mild mutation (see Fig 2). Patient 53 has a remarkably attenuated phenotype; therefore, she was classified as SP. She is compound heterozygous for a severe (p.R74C) mutation and a previously unreported mutation (p.N274D). Cultured fibroblasts exhibited increase in protein concentration, as measured by Western blotting, and decrease in HS when cultured at 30 °C. Surprisingly, SGSH activity level in the in vitro assay was not increased when fibroblasts were cultured at 30 °C. It appears that the p.N274D mutation does not change substrate affinity, because a 5‐fold increase in substrate concentration did not reveal any residual activity (data not shown). One possible explanation might be instability of the mutant protein in the in vitro assay medium. Therefore, the sensitivity of the prediction tool might be improved by combining enzyme activity at 30 °C with the measurement of HS levels and/or Western blotting.
In conclusion, we demonstrate a significant distinction between RP and SP MPS IIIA patients when assessing SGSH activity in skin fibroblasts cultured at 30 °C, and we suggest that this method can be used to predict phenotypic severity in MPS IIIA, which will be essential for trial design and for the future inclusion of MPS III in NBS panels. Furthermore, in the absence of a disease‐modifying treatment, reliable prediction of the phenotype will help parents and caregivers with health care and life planning decisions.
Author Contributions
Conception and design of the study: S.J.G.K., S.C.M.N., N.v.V., and F.A.W. Data acquisition and analysis: all authors. Drafting the manuscript: S.J.G.K., S.C.M.N., N.v.V., and F.A.W. All authors reviewed and accepted the final draft of the manuscript.
Potential Conflicts of Interest
Nothing to report.
Acknowledgment
This study was funded by grants from the private foundations Zabawas, Zeldzame Ziekten Fonds, and Kinderen en Kansen, the Netherlands.
We thank J. de Ruijter, M. J. Valstar, and L. Welling for their help with phenotyping the patients; and G. J. G. Ruijter from Erasmus Medical Center, Rotterdam, for providing the cultured skin fibroblasts.
References
- 1. Buhrman D, Thakkar K, Poe M, Escolar ML. Natural history of Sanfilippo syndrome type A. J Inherit Metab Dis 2014;37:431–437. [DOI] [PubMed] [Google Scholar]
- 2. Shapiro EG, Nestrasil I, Delaney KA, et al. A prospective natural history study of mucopolysaccharidosis type IIIA. J Pediatr 2016;170:278–287. [DOI] [PMC free article] [PubMed] [Google Scholar]
- 3. Heron B, Mikaeloff Y, Froissart R, et al. Incidence and natural history of mucopolysaccharidosis type III in France and comparison with United Kingdom and Greece. Am J Med Genet A 2011;155A:58–68. [DOI] [PubMed] [Google Scholar]
- 4. Valstar MJ, Ruijter GJ, van Diggelen OP, et al. Sanfilippo syndrome: a mini‐review. J Inherit Metab Dis 2008;31:240–252. [DOI] [PubMed] [Google Scholar]
- 5. Poorthuis BJ, Wevers RA, Kleijer WJ, et al. The frequency of lysosomal storage diseases in the Netherlands. Hum Genet 1999;105:151–156. [DOI] [PubMed] [Google Scholar]
- 6. Muenzer J. Overview of the mucopolysaccharidoses. Rheumatology (Oxford) 2011;50(suppl 5):v4–v12. [DOI] [PubMed] [Google Scholar]
- 7. Scott HS, Blanch L, Guo XH, et al. Cloning of the sulphamidase gene and identification of mutations in Sanfilippo A syndrome. Nat Genet 1995;11:465–467. [DOI] [PubMed] [Google Scholar]
- 8. Meyer A, Kossow K, Gal A, et al. Scoring evaluation of the natural course of mucopolysaccharidosis type IIIA (Sanfilippo syndrome type A). Pediatrics 2007;120:e1255–e1261. [DOI] [PubMed] [Google Scholar]
- 9. Muschol N, Pohl S, Meyer A, et al. Residual activity and proteasomal degradation of p.Ser298Pro sulfamidase identified in patients with a mild clinical phenotype of Sanfilippo A syndrome. Am J Med Genet A 2011;155A:1634–1639. [DOI] [PubMed] [Google Scholar]
- 10. Yogalingam G, Hopwood JJ. Molecular genetics of mucopolysaccharidosis type IIIA and IIIB: diagnostic, clinical, and biological implications. Hum Mutat 2001;18:264–281. [DOI] [PubMed] [Google Scholar]
- 11. Valstar MJ, Neijs S, Bruggenwirth HT, et al. Mucopolysaccharidosis type IIIA: clinical spectrum and genotype‐phenotype correlations. Ann Neurol 2010;68:876–887. [DOI] [PubMed] [Google Scholar]
- 12. Gabrielli O, Coppa GV, Bruni S, et al. An adult Sanfilippo type A patient with homozygous mutation R206P in the sulfamidase gene. Am J Med Genet A 2005;133A:85–89. [DOI] [PubMed] [Google Scholar]
- 13. Jones SA, Breen C, Heap F, et al. A phase 1/2 study of intrathecal heparan‐N‐sulfatase in patients with mucopolysaccharidosis IIIA. Mol Genet Metab 2016;118:198–205. [DOI] [PubMed] [Google Scholar]
- 14. ClinicalTrials.gov . Identifier: NCT02716246. Available at: https://clinicaltrials.gov/ct2/show/NCT02716246?term=NCT02716246&rank=1.
- 15. Tardieu M, Zerah M, Husson B, et al. Intracerebral administration of adeno‐associated viral vector serotype rh.10 carrying human SGSH and SUMF1 cDNAs in children with mucopolysaccharidosis type IIIA disease: results of a phase I/II trial. Hum Gene Ther 2014;25:506–516. [DOI] [PubMed] [Google Scholar]
- 16. Meijer OL, Welling L, Valstar MJ, et al. Residual N‐acetyl‐alpha‐glucosaminidase activity in fibroblasts correlates with disease severity in patients with mucopolysaccharidosis type IIIB. J Inherit Metab Dis 2016;39:437–445. [DOI] [PMC free article] [PubMed] [Google Scholar]
- 17. Smith PK, Krohn RI, Hermanson GT, et al. Measurement of protein using bicinchoninic acid. Anal Biochem 1985;150:76–85. [DOI] [PubMed] [Google Scholar]
- 18. Karpova EA, Voznyi YaV, Keulemans JL, et al. A fluorimetric enzyme assay for the diagnosis of Sanfilippo disease type A (MPS IIIA). J Inherit Metab Dis 1996;19:278–285. [DOI] [PubMed] [Google Scholar]
- 19. Kingma SDK, Wagemans T, IJlst L, et al. Altered interaction and distribution of glycosaminoglycans and growth factors in mucopolysaccharidosis type I bone disease. Bone 2016;88:92–100. [DOI] [PubMed] [Google Scholar]
- 20. Pollard LM, Jones JR, Wood TC. Molecular characterization of 355 mucopolysaccharidosis patients reveals 104 novel mutations. J Inherit Metab Dis 2013;36:179–187. [DOI] [PubMed] [Google Scholar]
- 21. Ugrinov KG, Freed SD, Thomas CL, Lee SW. A multiparametric computational algorithm for comprehensive assessment of genetic mutations in mucopolysaccharidosis type IIIA (Sanfilippo syndrome). PLoS One 2015;10:e0121511. [DOI] [PMC free article] [PubMed] [Google Scholar]
- 22. de Ruijter J, de Ru MH, Wagemans T, et al. Heparan sulfate and dermatan sulfate derived disaccharides are sensitive markers for newborn screening for mucopolysaccharidoses types I, II and III. Mol Genet Metab 2012;107:705–710. [DOI] [PubMed] [Google Scholar]
- 23. Delgadillo V, O'Callaghan Mdel M, Gort L, et al. Natural history of Sanfilippo syndrome in Spain. Orphanet J Rare Dis 2013;8:189. [DOI] [PMC free article] [PubMed] [Google Scholar]
- 24. Weber B, Guo XH, Wraith JE, et al. Novel mutations in Sanfilippo A syndrome: implications for enzyme function. Hum Mol Genet 1997;6:1573–1579. [DOI] [PubMed] [Google Scholar]
- 25. Muschol N, Storch S, Ballhausen D, et al. Transport, enzymatic activity, and stability of mutant sulfamidase (SGSH) identified in patients with mucopolysaccharidosis type III A. Hum Mutat 2004;23:559–566. [DOI] [PubMed] [Google Scholar]
- 26. Sidhu NS, Schreiber K, Propper K, et al. Structure of sulfamidase provides insight into the molecular pathology of mucopolysaccharidosis IIIA. Acta Crystallogr D Biol Crystallogr 2014;70(pt 5):1321–1335. [DOI] [PMC free article] [PubMed] [Google Scholar]
- 27. Houten SM, Frenkel J, Rijkers GT, et al. Temperature dependence of mutant mevalonate kinase activity as a pathogenic factor in hyper‐IgD and periodic fever syndrome. Hum Mol Genet 2002;11:3115–3124. [DOI] [PubMed] [Google Scholar]
- 28. Diekman EF, Ferdinandusse S, van der Pol L, et al. Fatty acid oxidation flux predicts the clinical severity of VLCAD deficiency. Genet Med 2015;17:989–994. [DOI] [PubMed] [Google Scholar]
- 29. Schueler UH, Kolter T, Kaneski CR, et al. Correlation between enzyme activity and substrate storage in a cell culture model system for Gaucher disease. J Inherit Metab Dis 2004;27:649–658. [DOI] [PubMed] [Google Scholar]
- 30. Leinekugel P, Michel S, Conzelmann E, Sandhoff K. Quantitative correlation between the residual activity of beta‐hexosaminidase A and arylsulfatase A and the severity of the resulting lysosomal storage disease. Hum Genet 1992;88:513–523. [DOI] [PubMed] [Google Scholar]
- 31. Meikle PJ, Ranieri E, Simonsen H, et al. Newborn screening for lysosomal storage disorders: clinical evaluation of a two‐tier strategy. Pediatrics 2004;114:909–916. [DOI] [PubMed] [Google Scholar]
- 32. Fuller M, Tucker JN, Lang DL, et al. Screening patients referred to a metabolic clinic for lysosomal storage disorders. J Med Genet 2011;48:422–425. [DOI] [PubMed] [Google Scholar]