

Abstract
CCCTC‐binding factor (CTCF) is a DNA‐binding protein that interacts with a large number of highly divergent target sequences throughout the genome. It is implicated in a variety of functions, including chromatin organization and transcriptional control. The functional role of CTCF in tumour pathogenesis remains elusive. We showed that CTCF is frequently upregulated in a subset of primary hepatocellular carcinomas (HCCs) as compared with non‐tumoural liver. Overexpression of CTCF was associated with shorter disease‐free survival of patients. Short hairpin RNA (shRNA)‐mediated suppression of CTCF inhibited cell proliferation, motility and invasiveness in HCC cell lines; these effects were correlated with prominent reductions in the expression of telomerase reverse transcriptase (TERT), the shelterin complex member telomerase repeat‐binding factor 1, and forkhead box protein M1 (FOXM1). In contrast, upregulation of CTCF was positively correlated with FOXM1 and TERT expression in clinical HCC biopsies. Depletion of CTCF resulted in reduced motility and invasiveness in HCC cells that could be reversed by ectopic expression of FOXM1, suggesting that FOXM1 is one of the important downstream effectors of CTCF in HCC. Reporter gene analysis suggested that depletion of CTCF is associated with reduced FOXM1 and TERT promoter activity. Chromatin immunoprecipitation (ChIP)–polymerase chain reaction (PCR) analysis further revealed occupancy of the FOXM1 promoter by CTCF in vivo. Importantly, depletion of CTCF by shRNA significantly inhibited tumour progression and metastasis in HCC mouse models. Our work uncovered a novel functional role of CTCF in HCC pathogenesis, which suggests that targeting CTCF could be further explored as a potential therapeutic strategy for HCC. © 2017 The Authors. The Journal of Pathology published by John Wiley & Sons Ltd on behalf of Pathological Society of Great Britain and Ireland.
Keywords: CTCF, HCC, FOXM1, TERT, chromatin immunoprecipitation, metastasis
Introduction
Hepatocellular carcinoma (HCC) is one of the most common malignancies and the third leading cause of cancer death worldwide 1. The prognosis for HCC is poor, because the tumour is usually diagnosed at an advanced inoperable stage when it can no longer be eradicated by surgical resection. Non‐surgical treatments such as transarterial chemoembolization, systemic therapy and targeted therapy 2 for patients with advanced‐stage HCC can only modestly extend their lifespan. Therefore, a thorough understanding of the underlying mechanisms regarding tumour growth and metastasis is critical for the development of effective therapeutic targets against HCC.
CCCTC‐binding factor (CTCF) is a ubiquitously expressed 11 zinc‐finger protein involved in a plethora of functions, including genome isolation, enhancer blocking, transcriptional regulation, imprinting, and long‐range transcriptional control 3. There are ∼14 000–30 000 CTCF‐binding sites diversely located in the intergenic, promoter, exon and intron regions in the genome 4. Through the combinatorial use of different zinc fingers, CTCF can bind to a wide range of variant sequences and differentially interact with coregulatory proteins to perform a versatile role in genome regulation 5. Among other functions, CTCF is best known as a chromatin organizer 3, maintaining DNA topology, and as an insulator to block enhancer–promoter interactions 6. The role of CTCF in tumourigenesis remains elusive 7, 8, 9, 10. Analysis of CTCF‐binding sites in a panel of reference cell lines designated by the Encyclopedia of DNA Elements (ENCODE) consortium has identified ubiquitous and cell type‐specific CTCF‐binding sites 11, and has revealed different CTCF‐binding landscapes in normal and tumour cells 12. These findings suggest divergent and complex functional roles of CTCF in different cell types and cell states. At present, the functional significance of differential interactions between CTCF and its binding sites in different cell types remains largely unexplored. More importantly, the functional role of CTCF in HCC pathogenesis remains unknown.
In this study, we found that CTCF expression is upregulated in a subset of HCCs, and that CTCF overexpression is associated with a poorer prognosis of HCC patients. We characterized the functional role of CTCF in HCC by using cell and mouse models, and showed that it contributes to HCC tumourigenesis and metastasis.
Materials and methods
Plasmids, reagents, and antibodies
Lentivirus plasmids, i.e. pLKO.1‐puro vectors containing non‐targeting short hairpin RNA (shRNA) and shRNAs targeting CTCF (TRCN0000014549 and TRCN0000014551), were from Thermo Fisher Scientific (Waltham, MA, USA). CTCF SMARTpool small interfering RNA (siRNA) (L‐20165‐00‐0020) was from Dharmacon (Lafayette, CO,USA) . Anti‐CTCF antibody for chromatin immunoprecipitation (ChIP) was from Millipore (Billerica, MA, USA); anti‐TERT (1:1000, clone no. H‐231), anti‐telomerase repeat‐binding factor 1 (TRF1) (1:1000, clone no. H‐242), anti‐Ki67 (1:500, clone no. MIB‐1) and anti‐p21 (1:1000, clone no. N‐20) antibodies were from Santa Cruz Biotechnology (Santa Cruz, CA, USA); anti‐CTCF (1:2000, clone no. D31H2), anti‐poly(1:1000, ADP‐ribose) polymerase (PARP), anti‐cleaved PARP (1:1000, clone no. D64E10), anti‐phospho‐ATM (Ser1981) (clone no. D25E5), anti‐phospho‐checkpoint kinase 2 (CHK2) (Thr68) (1:1000, clone no. C13C1) and anti‐phospho‐H2A.X (Ser139) antibodies were from Cell Signaling Technology (Beverly, MA, USA); anti‐p27 (1:1000, clone no. SX53G8) antibody was from Dako (Glostrup, Denmark); anti‐TRF1 (1:200, clone no. TRF‐78) and anti‐telomerase repeat‐binding factor 2 (TRF2) (1:200, clone no. 4A794) antibodies for immunofluorescence were from Abcam (Cambridge, MA, USA); and anti‐β‐actin antibody (1:5000, clone no. AC‐15) was from Sigma‐Aldrich (St Louis, MO, USA). The pcDNA3‐HA‐FOXM1C plasmid was a kind gift from K. M. Yau of The University of Hong Kong.
Cell culture
SK‐HEP‐1, HepG2, PLC5 and Hep3B cells from the American Type Culture Collection. Huh7 cells were from the Health Science Research Resources Bank (Osaka, Japan). BEL‐7402 cells were from the Shanghai Institutes for Biological Sciences, Chinese Academy of Science. MHCC97L and HepG2.2.15 cells were from Z. Y. Tang of Fudan University and A. L. Huang of Chongqing Medical University, PR China, respectively. Cells were cultured in growth medium supplemented with 10% fetal bovine serum (Gibco BRL, Grand Island, NY, USA), and maintained in a humidified incubator at 37 °C with 5% CO2. All cells were authenticated by short tandem repeat profiling analysis.
Human HCC specimens
Tumorous liver tissues and the corresponding adjacent non‐tumorous liver tissues were collected from 47 patients who had undergone curative surgery for HCC at the Prince of Wales Hospital, Hong Kong. Frozen normal liver tissues were obtained from patients who had undergone liver resection for hepatic metastasis of colorectal cancer. Baseline clinical and laboratory parameters were retrieved from the hospital database and reviewed. The histological diagnosis of HCC was reviewed and confirmed by two pathologists (A.W.H.C. and K.F.T.). Informed consent was obtained from each recruited patient. The study protocol conformed to the ethical guidelines of the 1975 Declaration of Helsinki, and was approved by the Clinical Research Ethics Committee of the Chinese University of Hong Kong (CREC#2013.688). Clinicopathological parameters of these patients are summarized in supplementary material, Table S1.
After liver resection, all patients with HCC were followed up with measurement of serum α‐fetoprotein every 6 months, and with ultrasound or contrast computed tomography every 6–12 months. Overall survival was defined as the time from surgery to HCC‐related death or the last follow‐up if death had not occurred. Disease‐free survival was defined as the time from surgery to radiological evidence of tumour relapse.
Human gene expression microarray analysis
Quality‐controlled RNA samples were labelled with cyanine‐3 dCTP (Agilent Technologies, Santa Clara, CA, USA), and hybridized on Agilent Whole Human Genome 4 × 44 K Microarrays according to the manufacturer's protocol. The arrays were washed and scanned with an Agilent scanner, and the image was digitized with Agilent Feature Extraction 11.0. Data were analysed with GeneSpringGX 12.0 (Agilent Technologies) for ‘75th percentile shift’ and ‘baseline to median of all samples’ normalization. Normalized gene expression signals were used for fold‐change analysis. Gene expression array data have been submitted to the GEO (accession number GSE100533).
Lentivirus production and transduction
Lentiviruses expressing shRNAs against CTCF, i.e. shCTCF‐1 (GCAAGGCAAGAAATGCCGTTA) and shCTCF‐2 (GCGGAAAGTGAACCCATGATA), and non‐targeting shRNA, i.e. shCont (CAACAAGATGAAGAGCACCAA), were produced with the BLOCK‐iT Lentiviral RNAi Expression System (Invitrogen, Carlsbad, CA, USA). Cell transduction was carried out as described previously 13.
RNA extraction and reverse transcription quantitative polymerase chain reaction (RT‐qPCR)
cDNA was synthesized from RNA by the use of PrimeScript RT Master Mix (TaKaRa), and subjected to quantitative polymerase chain reaction (qPCR) analysis with SYBR Premix Ex Taq II kits (TaKaRa Shuzo Co., Ltd., Kyoto, Japan) and the ABI PRISM 7900 Fast Real‐Time PCR System. The primers used in RT‐qPCR experiments are shown in supplementary material, Table S2.
Cell growth, senescence and motility assays
Senescence‐associated β‐galactosidase (SA‐β‐gal) assays, colony formation assays and soft agar assays were performed as described previously 14. Cell migratory and invasive abilities were determined by the use of Transwell (Corning Life Sciences, Bedford, MA, USA). Matrigel (BD Biosciences, San Jose, CA, USA) invasion assays were performed as described previously 13.
Quantification of telomere dysfunction‐induced foci (TIFs)
TIF immunofluorescence assays were performed as described previously 14. Cells were analysed by use of a Zeiss (Jena, Germany) Axiovert 200 M fluorescence microscope, and images were captured with a CoolSNAP ES2 (Photometrics, Tucson, AZ, USA) camera. Cells with five or more phosphorylated H2AX (γH2AX) foci colocalizing with TRF2 foci were considered to be TIF‐positive.
Luciferase assays
Luciferase activity measurement was performed as described previously 15. Measurements were conducted in cells coexpressing the indicated shRNAs and luciferase reporter, with Renilla luciferase reporter as a normalization control.
Chromatin immunoprecipitation
Assays were performed as described previously 16. The primers used in ChIP–qPCR experiments are shown in supplementary material, Table S3. Binding of CTCF was normalized to input, and expressed as a percentage of the input DNA (% input). IgG was used as a negative control. Data were obtained from at least three independent experiments.
Xenograft and orthotopic tumour models in nude mice
The protocol for the xenograft tumour model experiments was approved by the Institutional Animal Care and Use Committee of Nanjing Drum Tower Hospital, Medical School of Nanjing University. MHCC97L cells (2 × 10⁶) transduced with lentivirus expressing shCont or shCTCF‐2 were mixed with the same volume of ice‐cold Matrigel, and then injected subcutaneously into the left flanks of 6‐week‐old female BALB/c nu/nu mice (n = 6 for each group). Tumour size was measured every 3 days. Mice were killed when the size of the control group tumours reached 1000 mm3. Tumours were fixed and then embedded in paraffin for sectioning. Tissue sections were subjected to haematoxylin and eosin (H&E) and immunohistochemical staining. The protocol for the orthotopic tumour model experiments was approved by the Committee of the Use of Live Animals in Teaching and Research at Hong Kong Polytechnic University (15‐16/79‐ABCT‐R‐GRF). Luciferase‐labelled BEL‐7402 cells (1 × 10⁶), transduced with lentivirus expressing either shCont or shCTCF‐2, were injected into the left lobes of the livers of BALB/c nu/nu mice as described previously 17. Six weeks after implantation, 100 mg/kg d‐luciferin was administered via peritoneal injection 5 min before bioluminescence imaging (IVIS Lumina III in vivo imaging system; PerkinElmer, Waltham, MA, USA). Lungs and livers were harvested postmortem for ex vivo imaging.
Results
Expression of CTCF in HCC cell lines and clinical specimens
Immunohistochemical analysis showed that CTCF was expressed in a number of human anatomical sites, including the colon, smooth muscle, and thyroid, but it was expressed at a very low level, if at all, in normal liver (Figure 1A). Western blotting analysis further suggested that, whereas CTCF was undetectable in normal livers, it was expressed in HCC biopsies, five HCC cell lines (PLC5, Hep3B, Huh7, HepG2, HepG2.2.15, and MHCC97L), and a cell line derived from liver adenocarcinoma (SK‐HEP‐1) (Figure 1B). Subsequently, the expression level of CTCF was determined with 47 pairs of primary HCCs. CTCF expression was detected in the majority of non‐tumorous liver specimens, but a significant proportion of patients showed elevated CTCF levels (>2‐fold) in tumour tissues (22 of 47 cases, 46.8%) relative to the adjacent non‐tumorous tissues (Figure 1C, D). The average level of CTCF was also significantly higher in the tumour (median 0.7383, quartiles 0.3972–1.568) than in the adjacent non‐tumorous liver (median 0.3580, quartiles 0.1649–0.7731) (P < 0.001) (Figure 1E, upper). Nevertheless, CTCF mRNA levels in tumour and non‐tumorous liver samples were not significantly different (Figure 1E, lower). CTCF overexpression (>5‐fold) was associated with poorer disease‐free survival (1‐year survival of 50% versus 76%; 5‐year survival of 17% versus 51%; P = 0.02) (Figure 1F), but it was not associated with overall survival or any other clinicopathological parameter. Together, these data suggest that overexpression of CTCF may affect HCC progression.
Figure 1.
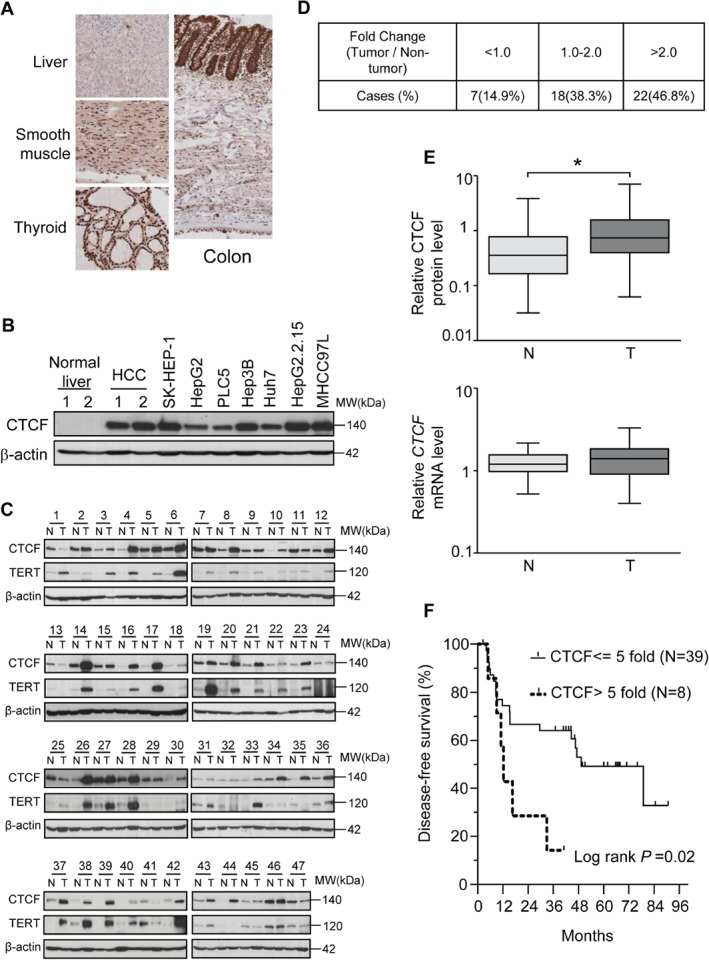
Overexpression of CTCF in clinical HCCs. (A) Immunohistochemical analysis of CTCF protein in normal human tissues. CTCF expression was detected in smooth muscle, colon, thyroid, and skin, but not in liver. (B) Western blotting analysis showed that CTCF was not detectable in normal liver, but was abundantly expressed in clinical HCC specimens and cell lines. (C) Western blot analysis of CTCF and TERT expression in 47 paired HCCs and adjacent non‐tumoural livers. (D) Relative expression of CTCF protein in HCC specimens. Fold change was expressed as normalized CTCF expression level in HCCs relative to that in adjacent non‐tumoural liver. (E) Quantification of CTCF protein (top) and CTCF mRNA (bottom) in HCCs and their adjacent non‐tumoural liver tissues. *P < 0.001. (F) Kaplan–Meier analyses suggested that survival of the patients who had high CTCF expression was significantly shorter; P = 0.02. N, adjacent non‐tumoural liver; T, HCC.
Effect of CTCF silencing on HCC cell growth
Lentiviruses expressing shRNAs (shCTCF‐1 and shCTCF‐2) (Figure 2A) or SMARTpool siRNAs (siCTCF) (supplementary material, Figure S1A, B) were effective in depleting CTCF mRNA and CTCF protein expression in a panel of liver cancer cell lines examined. Two independent CTCF shRNAs markedly reduced the proliferation of PLC5 (p53‐inactivated; Figure 2B), HepG2 (p53‐wild‐type), SK‐HEP‐1 (p53‐wild‐type), and Hep3B (p53‐deleted) cells (supplementary Figure S1C) respectively, as compared with the untreated or scrambled shRNA (shCont)‐transduced cells. Depletion of CTCF reduced the number and size of PLC5 colonies as determined by colony formation assays (Figure 2C; supplementary material, Figure S1D) and soft agar assays (Figure 2C), respectively. Furthermore, cellular senescence phenotypes, including cellular staining of SA‐β‐gal (Figure 2D), and induction of p21 and p27 (Figure 2E), were observed in CTCF‐depleted SK‐HEP‐1 and HepG2 (p53‐wild‐type) cells, but not in Hep3B (p53‐deficient) or PLC5 (p53‐mutated) cells (Figure 2D, E). On the other hand, PARP cleavage was detected in CTCF‐depleted PLC5 and Hep3B cells but not in SK‐HEP‐1 or HepG2 cells (Figure 2F). Considered together, these data are in support of depletion of CTCF preferentially inducing cellular senescence and apoptosis in p53‐wild‐type and p53‐defective liver cancer cells, respectively.
Figure 2.

Cellular phenotypes induced by shRNA‐mediated depletion of CTCF in HCC cells. (A) Cellular CTCF mRNA (upper) and CTCF protein levels (lower) were significantly reduced by lentiviruses expressing CTCF‐targeting (shCTCF‐1 and shCTCF‐2) versus control (shCont) shRNA. *P < 0.001. (B) Proliferation of PLC5 cells was suppressed by lentiviral‐mediated depletion of CTCF. *P < 0.001. (C) Depletion of CTCF in PLC‐5 cells reduced colony formation (upper panel) and focus formation in soft agar (lower panel). (D) Depletion of CTCF led to cellular senescence in p53‐positive liver cancer cells. SA‐β‐gal staining was conducted 6 days after cells had been transduced with lentiviruses expressing the indicated shRNA. (E) Western blot analysis of p21 and p27 in HCC cells transduced with lentiviruses expressing the indicated shRNA. (F) Western blot analysis of PARP cleavage in cells transduced with lentiviruses expressing the indicated shRNA.
Functional role of CTCF in telomere maintenance
Telomeric dysfunction caused by critically shortened telomeres 18 or depletion of telomere repeat binding proteins 19, 20 may lead to cellular senescence characterized by a DNA damage response and the formation of TIFs. To determine whether cellular senescence induced by CTCF depletion is associated with telomeric dysfunction, we examined the expression of telomerase reverse transcriptase (TERT), members of the shelterin complex (TRF1, TRF2, POT1, PTOP, and RAP1) 21 and telomere‐associated proteins (PINX1 and KU‐70) in CTCF‐depleted cells. CTCF knockdown resulted in significant reductions in TERT, TRF1 and POT1 mRNA levels in HepG2 cells (Figure 3A), and reductions in TERT and TRF1 mRNA levels in SK‐HEP‐1 cells (supplementary material, Figure S2A). Concordantly, significant reductions in TERT and TRF1 protein expression levels were observed upon knockdown of CTCF in HepG2, PLC5, Hep3B and SK‐HEP‐1 cells (Figure 3B). Therefore, CTCF is essential for TERT and TRF1 expression independently of p53 status. On the other hand, a positive association between tumour induction of CTCF and of TERT expression in HCC (P = 0.002) (Figures 1C and 3C) was also observed, suggesting that such a CTCF–TERT regulatory axis may exist in vivo. Consistent with the known effect of telomere dysfunction, CTCF silencing induced a DNA damage response characterized by the phosphorylation of ATM and CHK2 (Figure 3D), and the formation of TIFs characterized by colocalization of γH2AX and TRF2 (Figure 3E).
Figure 3.

Depletion of CTCF repressed TERT and TRF1 expression and induced telomere abnormality. (A) RT‐qPCR analysis of mRNA levels of genes related to telomere maintenance in HepG2 cells transduced with lentiviruses expressing the indicated shRNA. ACTB expression was used as an internal control. Values represent the mean ± standard deviation (SD) of three independent experiments. *P < 0.01. (B) Western blot analysis of CTCF, TERT and TRF1 in liver cancer cells 5 days after transduction with lentiviruses expressing the indicated shRNA. (C) Upregulation of CTCF protein was positively correlated with upregulation of TERT protein in clinical HCC (P = 0.002). Fold induction (HCC/non‐tumoural liver) of CTCF was plotted against fold induction of TERT (Figure 1C), and analysed with Spearman's σ rank test. (D) Western blot analysis of CTCF, phosphorylated ATM, and phosphorylated CHK2 in different liver cancer cells 5 days after transduction with lentiviruses expressing the indicated shRNA. (E) Immunofluorescence staining of TRF2 (red) and γH2AX (green) in SK‐HEP‐1 cells. Cells were analysed 5 days after transduction with lentivirus expressing the indicated shRNA. Arrows indicate telomere‐associated γH2AX foci. Quantification of TIFs is shown on the right. In each experiment, 100 nuclei from five randomly picked fields were analysed. Scale bar: 20 μm. Data are mean ± SD. *P < 0.05. DAPI, 4′,6‐diamidino‐2‐phenylindole.
Forkhead box protein M1 (FOXM1) mediates the effect of CTCF on motility and invasiveness of HCC cells
To reveal other potential CTCF‐regulated genes, PLC5 cells transduced with shCont or shCTCF‐1 were subjected to gene expression profiling analysis. Using a two‐fold cutoff, we found that 3357 genes were downregulated and 8243 genes were upregulated in CTCF‐depleted cells (supplementary material, Table S4). We noticed that depletion of CTCF also resulted in substantial reduction in FOXM1 expression. FOXM1 is implicated in the tumourigenesis and metastasis of a variety of tumours, including HCCs 22, 23, 24, 25. Downregulation of FOXM1 in CTCF‐depleted liver cancer cells (HepG2, PLC5 and Hep3B, SK‐HEP‐1) was confirmed by RT‐qPCR (supplementary material, Figure S2B) and western blot (Figure 4A) analyses. In the same cohort of HCC biopsies, FOXM1 expression levels were significantly elevated in HCCs (median 3.22, quartiles 2.28—4.68) as compared with the adjacent non‐tumorous liver (median 0.26, quartiles 0.17–0.34) (P < 0.00001) (Figure 4B). A significant positive correlation (Spearman's rank = 0.63, P < 0.01) (Figure 4C) between the CTCF protein and FOXM1 mRNA levels was observed in these specimens, suggesting that CTCF may regulate FOXM1 expression in vivo. In agreement with the role of FOXM1 in metastasis 26, depletion of CTCF also markedly reduced cell migration and impaired invasion of PLC5 cells. Importantly, ectopic expression of FOXM1 restored the cell migration and invasive activity of CTCF‐depleted cells (Figure 5A, B), suggesting that FOXM1 is one of the major downstream effectors of CTCF to promote tumour cell dissemination. To further understand the role of CTCF in metastasis, we assessed the expression of E‐cadherin, α‐catenin, β‐catenin, vimentin, and N‐cadherin, which are proteins involved in epithelial–mesenchymal transition (EMT). Unexpectedly, the expression of these proteins was not altered appreciably in CTCF‐depleted cells (Figure 5C). Nevertheless, there were reductions in cortical localization of F‐actin, membrane protrusions, and stress fibres (Figure 5D).
Figure 4.

Correlation between CTCF and FOXM1 levels. (A) FOXM1 protein levels in HCC cells were significantly reduced by lentiviruses expressing CTCF‐targeting (shCTCF‐1 and shCTCF‐2) versus control (shCont) shRNA. (B) FOXM1 mRNA levels were significantly elevated in HCCs as compared with the adjacent non‐tumoural livers. *P < 0.001. (C) Upregulation of FOXM1 mRNA was positively correlated with upregulation of CTCF protein in clinical HCC (P = 0.002). Fold induction (HCC/non‐tumoural liver) of FOXM1 mRNA was plotted against fold induction of TERT, and analysed by Spearman's σ rank test.
Figure 5.

CTCF controls the motility and invasiveness of HCC cells through regulation of FOXM1. (A) Effect of CTCF depletion, and subsequent ectopic FOXM1 expression, on the motility and invasiveness of PLC5 cells. Left: representative images of cells that have migrated through Transwell pores (upper panel) and invasion through Matrigel (lower panel) under different conditions. Right: quantification of cell migration and invasion under different conditions. For each condition, five different fields were counted. *P < 0.001. (B) Western blot analysis showing the knockdown of CTCF and the rescue of FOXM1 expression in PLC5 cells. (C) Western blot analysis of EMT markers in liver cancer cells depleted of CTCF. (D) Phalloidin staining for F‐actin (red) in PLC5 and SK‐Hep1 cells showed a reduction in the number of stress fibre filaments in cells expressing shRNA against CTCF. Nuclei were stained with 4′,6‐diamidino‐2‐phenylindole (blue). (E) Normalized luciferase activity of TERT and FOXM1 reporter constructs. SV40 promoter‐driven luciferase reporter vector (pGL3‐SV40) was used as a control. Normalized luciferase activity of SK‐Hep‐1 cells expressing pGL3‐SV40 and shCont was designated as 1. *P < 0.01. (F) Upper panel: a schematic diagram of FOXM1 genomic structure and PCR amplicons for ChIP‐qPCR analysis. Lower panel: ChIP‐qPCR analyses of CTCF occupancy of the FOXM1 gene of SK‐Hep‐1 cells. IgG, PCR signal at the TSS (amplicon c) region of FOXM1 when IgG was used instead of CTCF antibody for ChIP. *P < 0.05, one‐way anova. Results show means ± standard deviations from triplicate experiments.
Transcriptional regulation of TERT and FOXM1 by CTCF
The data above suggested that CTCF may regulate gene expression of TERT and FOXM1. We therefore conducted reporter gene assays to determine whether CTCF regulates TERT and FOXM1 promoter activity. As shown in Figure 5E, depletion of CTCF significantly attenuated luciferase reporter activity driven by the TERT 5′ regulatory sequence (–923 to +77 bp relative to the TERT transcriptional start site) (pGL3‐TERT‐1 kb) and FOXM1 5′ regulatory sequence (–955 to +45 bp relative to the FOXM1 transcriptional start site) (pGL3‐FOXM1‐1 kb), whereas it did not alter the activity of the SV40 promoter (pGL3‐SV40). Bioinformatics analysis using CTCFBSDB 2.0 (http://insulatordb.uthsc.edu) revealed putative binding sites located at –990, –884, –629 and –28 bp of TERT, and at –816 and –107 bp of FOXM1, respectively (supplementary material, Figure S3). Furthermore, analysis of the ChIP‐sequencing data in ENCODE further revealed that, in HepG2 cells, the CTCF peak region was located between –120 to –269 bp of FOXM1 (supplementary material, Figure S3). To further confirm the interaction between CTCF and the FOXM1 promoter in vivo, ChIP analysis was conducted with anti‐CTCF antibodies, followed by qPCR amplification of amplicons that spread across the 12.6‐kb region of FOXM1 (Figure 5F). ChIP‐qPCR analysis showed differential enhancement of signal at the imprinted‐control region of the IGF2/H19 locus in CTCF‐expressing versus CTCF‐depleted cells (Figure 5F) 27, indicating the validity of the assay. On the other hand, significant enhancement of CTCF signal was observed in the TSS (amplicon c) and the intron 1 (amplicon d) regions of FOXM1, respectively, and it was abolished by CTCF depletion. In contrast, no significant enhancement of signal was observed in exon 4 (amplicon f), where there is no putative CTCF‐binding site around this locus (Figure 5F). Considered together, these data are in support of CTCF regulating the expression of FOXM1 via interaction with the CTCF‐binding site(s) located in the proximal promoter of the gene.
Role of CTCF in tumour progression and metastasis in vivo
To further ascertain the role of CTCF in HCC growth in vivo, a xenograft model was prepared by subcutaneous implantation of human MHCC97L cells expressing shCont or shCTCF‐2. Cells expressing shCTCF‐2 showed substantial repression of CTCF expression and a profound reduction in tumour growth over a period of 28 days as compared with cells expressing shCont (Figure 6A). On the 28th day, shCTCF‐2‐expressing tumours were also smaller in size (Figure 6B, upper) and lower in weight (Figure 6B, lower). Immunohistochemical analysis of tumour sections revealed that shCTCF‐2‐expressing cells showed clear reductions in staining for CTCF, FOXM1, and the proliferation marker Ki67. However, no significant differences in terminal deoxynucleotidyl transferase nick‐end labelling (TUNEL) staining were detected (Figure 6C).
Figure 6.
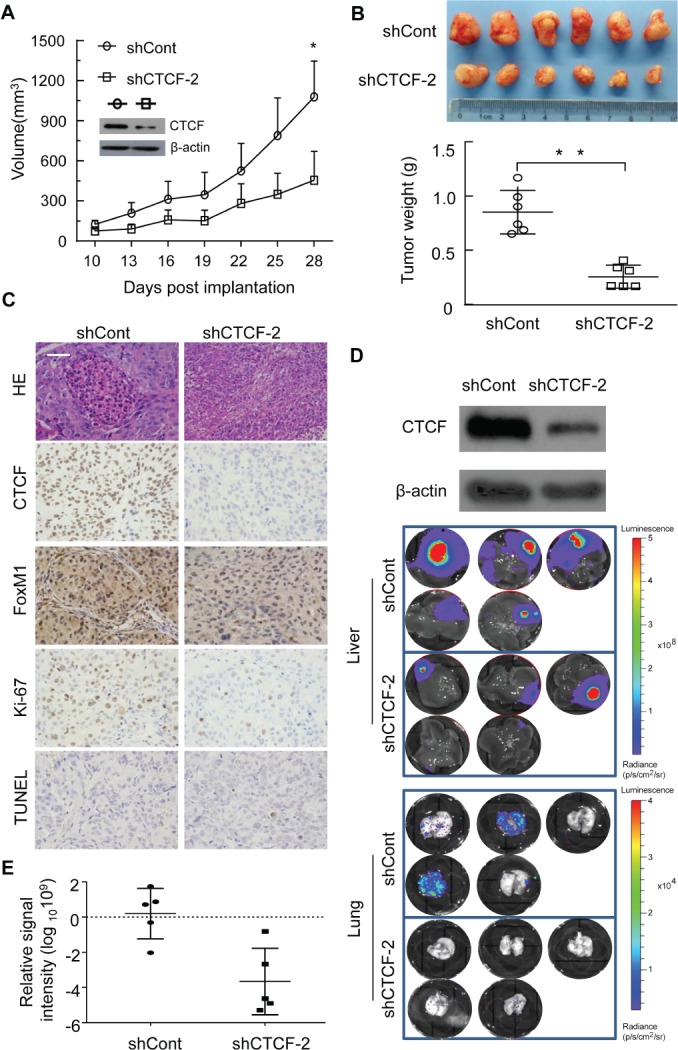
(A) Growth curves of xenograft tumours after subcutaneous implantation of MHCC97L cells. Insert: western blot analysis showing the expression of CTCF in shCont‐expressing versus ShCTCF‐2 expressing cells. *P < 0.01, Student's t‐test. (B) Representative images (upper) and weights (lower) of xenograft tumours formed by MHCC97L cells expressing shCont and shCTCF‐2. Data represent the mean ± standard deviation. *P < 0.05, Student's t‐test. (C) Representative images of immunohistochemical staining of CTCF, FOXM1, and Ki67, and TUNEL staining, in tumour xenografts. Magnification: ×400. Scale bar: 50 μm. (D) Western blot showing the expression of CTCF in BEL‐4402 cells expressing shCTCF‐2 (upper panel). An orthotopic HCC metastatic model showed that BEL‐7402 cells had undergone extensive lung metastasis in vivo, which was abrogated by CTCF knockdown (4/5 versus 0/5 for lung metastasis) (lower panel). (E) Volume of orthotopic liver tumours formed by BEL‐7402 cells, expressed as relative luciferase signal intensity. The relative signal intensity of tumour expressing shCTCF‐2 was apparently lower than that of tumour expressing shCont, but this trend did not reach statistical significance.
Next, an orthotopic HCC metastatic model was employed to test the in vivo metastatic role of CTCF. Highly metastatic BEL‐7402 cells expressing shCont or shCTCF‐2 (Figure 6D, upper) were injected into the left lobes of the livers of nude mice, and, 35 days later, the formation of tumour foci in the livers and lungs of the mice was evaluated with a Xenogen imaging system. Consistent with the results of the xenograft experiment above, BEL‐7402 cells expressing shCont formed liver tumours with a higher tumour load than the tumours formed by cells expressing shCTCF‐2 (Figure 6D, upper, and Figure 6E). On the other hand, three of five (60%) mice with cells expressing shCont showed extensive tumour metastasis to the lungs, whereas the tumour load in the lungs of mice with liver tumours expressing shCTCF‐2 was minimal (Figure 6D, lower). Taken together, these data support the hypothesis that CTCF contributes to tumour growth and metastasis.
Discussion
In this study, we elucidated the functional role of CTCF in HCC oncogenesis. CTCF is an essential genome organizer and insulator, and is known for its role in establishing the three‐dimensional structure of the genome 3. Intriguingly, however, CTCF expression was not detected in the three human normal liver specimens that we analysed (two by western blotting and one by immunohistochemistry). Our observation was consistent with data in The Human Protein Atlas 28, which showed that CTCF was expressed at a lower level in the liver than in other organs. Therefore, we hypothesized that there is a novel insulator responsible for maintaining the genome architecture of normal liver cells. Alternatively, liver cells may express a tissue‐specific CTCF isoform that is not recognized by the existing CTCF antibodies. Elucidating how genome topology is organized in liver cells will provide novel insights into the cell‐specific function of CTCF.
The majority of evidence has suggested that CTCF is a tumour suppressor. Through the interaction with CTCF‐binding sites known as anchor sequences, CTCF partitions chromosomes into megabase‐sized topologically associated domains (TADs). Within TADs, CTCF further segregates DNA into loop structures known as insulated neighbourhoods. These chromosome territories are essential for constraining enhancer–gene interactions and gene expression. Consequently, defective interactions between CTCF and anchor sequences lead to aberrant expression of genes, including oncogenes 29. Concordantly, CTCF was shown to be sporadically inactivated or truncated in a range of tumours, such as Wilms' tumour, leukaemia, and breast, endometrial and prostate cancers 30, 31, 32, 33, 34. Furthermore, Ctcf hemizygous knockout mice are predisposed to the development of cancer in a wide range of tissues 35. CTCF‐binding sites were also found to be some of the most frequently mutated transcription factor‐binding sites in cancers 29, 36, 37, including HCC 38. On the other hand, emerging evidence has suggested that CTCF overexpression or gain‐of‐function mutation may promote tumour growth in cell models 9, 30, 39. Our study has made the pivotal discovery that CTCF is overexpressed in liver tumours, and has extended our current understanding of the pro‐tumourigenic function of CTCF. We showed that CTCF promotes HCC cell growth and metastasis by directly regulating expression of TERT and FOXM1. Recent findings have suggested that a subset of CTCF‐binding sites, instead of forming insulated neighbourhood loops, are located near the enhancers and serve as anchors to recruit co‐activators for gene transcription 40, and this suggests a potential mechanism for CTCF function in HCC. Subsequent analysis will attempt to identify the molecules involved in the process. At present, whether enhanced CTCF protein expression in HCCs is mediated by post‐translational mechanisms remains to be determined. Earlier studies showed that CTCF is subject to phosphorylation and poly(ADP‐ribosylation) 41, 42, but whether these modifications, or other unknown modifications, contribute to protein stability remains to be determined. On the other hand, we observed that many of the HCCs overexpressing CTCF concordantly overexpressed CTCF in the adjacent non‐tumoural liver tissues, although the expression level was lower than in the tumours in general. Aetiologically, these patients were hepatitis B virus‐positive or hepatitis C virus‐positive, so their livers were subjected to various degrees of inflammation, fibrosis, or cirrhosis, which are conditions that predispose to HCC development. Therefore, CTCF upregulation in non‐tumoural livers may represent an important alteration that drives HCC oncogenesis.
Our study also revealed a novel CTCF–FOXM1 regulatory axis in HCC. FOXM1 is one of the most frequently upregulated genes in human solid tumours, including HCC 25, 43. Its overexpression is also associated with poorer prognosis in HCC patients. FOXM1 is a transcriptional regulator that is implicated in a variety of biological processes, including cancer cell migration and invasion 44. Accordingly, CTCF‐depleted cells showed the reduced motility and invasiveness that are typical results of FOXM1 inhibition, but these effects were readily alleviated by ectopic expression of FOXM1, suggesting that FOXM1 is one of the important effectors of CTCT activity. Intriguingly, although an earlier study suggested that inhibition of FoxM1 leads to repression of genes involved in EMT 45, CTCF depletion did not alter the expression of these genes. Nevertheless, it led to the rearrangement of actin stress fibres of HCC cells. We postulate that, instead of modulating expression of genes that are directly involved in EMT, CTCF might regulate the motility and invasiveness of HCC cells via regulation of genes involved in the arrangement of actin stress fibres.
We speculate that CTCF overexpression may play a more widespread role during the carcinogenesis of cancer types other than HCC. However, the correlation may not be revealed readily, because differential CTCF overexpression was not detectable at the mRNA level. Given that 30–60% of the CTCF‐binding sites are cell type‐specific 4, 11, 46, 47, and substantial differences in the CTCF‐binding landscape were observed between normal and tumour cells 12, dysregulated CTCF expression is likely to alter distinctive genetic programmes in a cancer cell‐specific manner. In HCC, CTCF depletion also led to altered expression of a vast array of genes besides FOXM1. A detailed functional analysis of these genes may provide a more thorough understanding of CTCF function during HCC carcinogenesis. In the future, we will address whether CTCF overexpression is a driver for HCC tumourigenesis. Furthermore, our study also raises the possibility that targeting CTCF could be further explored as a potential HCC therapeutic strategy.
Author contributions statement
The authors contributed in the following way: BZ, HL, YZ, KKYC: performed most of the experimental work; AWHC, PBSL, YSC: provided HCC specimens and conducted histological diagnosis; RZ, TKWL, EYTL, NPYH, XZ, VK, LMCC, ASC: contributed to animal studies; KWC, HKW: helped with microarray analysis; BCBK: responsible for the design and analysis of the experiments. All authors contributed to the writing of the manuscript.
SUPPLEMENTARY MATERIAL ONLINE.
Supplementary figure legends
Figure S1. CTCF expression, cell proliferation and colony formation following transduction with siRNA and shRNAs
Figure S2. Analysis of mRNA levels relevant to telomere maintenance in cell lines following transduction with shRNA
Figure S3. Location of putative CTCF‐binding sites in the TERT and FOXM1 gene promoter regions
Table S1. Clinicopathological information of hepatocellular carcinoma patients
Table S2. Primer sequences for Reverse Transcription‐qPCR analyses
Table S3. Primer sequences for ChIP‐qPCR analysis
Table S4. Human expression array analysis of PLC5 cells 2 days after transduction with shCont or shCTCF‐2. Only annotated genes altered by ≥2.0‐fold on depletion of CTCF are listed
Supporting information
Supplementary materials and methods
Figure S1. CTCF expression, cell proliferation and colony formation following transduction with siRNA and shRNAs. HCC cells transfected with SMARTpool siRNA against CTCF (siCTCF) resulted in significant reduction in CTCF A) mRNA and B) protein levels compared with the control siRNA (siCont) C) siRNA‐mediated depletion of CTCF significantly reduced the proliferation of HepG2, SK‐HEP‐1, and Hep3B cells. Cell proliferation was determined by trypan blue exclusion assay at the indicated time points. Plots are cumulative cell numbers versus days in culture. *, P < 0.001. D) Depletion of CTCF reduced cell colony formation. Representative images of HepG2, SK‐HEP‐1, and Hep3B cells transduced with lentiviruses expressing the indicated shRNAs were shown.
Figure S2. Analysis of mRNA levels relevant to telomere maintenance in cell lines following transduction with shRNA. A) Real‐time qPCR analysis of gene expressions related to telomere maintenance in SK‐HEP‐1 cells transduced with lentiviruses expressing the indicated shRNA for 4 days. B) Real‐time qPCR analysis of gene expressions in SK‐HEP‐1 and HepG2 cells transduced with lentiviruses expressing the indicated shRNA for 4 days. ACTB mRNA levels wer used as an internal control. Experiment was conducted in triplicate. Data represent mean ± SD of 3 independent experiments. *, P < 0.01.
Figure S3. Location of putative CTCF‐binding sites in the TERT and FOXM1 gene promoter regions. A) TERT and B) FOXM1 promoters. Bioinformatics analysis was conducted using CTCFBSDB 2.0 (http://insulatordb.uthsc.edu). Putative CTCF‐binding sites with position weight matrices score > 4 were shown. ChIP‐seq Peak of CTCF in FOXM1 promoter was obtained from ENCODE.
Table S1. Clinicopathological information of hepatocellular carcinoma patients
Table S2. Primer sequences for Reverse Transcription‐qPCR analyses
Table S3. Primer sequences for ChIP‐qPCR analysis
Table S4. Human expression array analysis of PLC5 cells 2 days after transduction with shCont or shCTCF‐2. Only annotated genes altered by ≥2.0‐fold on depletion of CTCF are listed
Acknowledgements
This work was supported by the National Science Foundation of China (81272764), the Shenzhen Basic Research Programme (JCYJ20160531185413087), the Health and Medical Research Fund (04150406), and the Polytechnic University of Hong Kong fund (YBAZ and GUA1M) to BCBK, and the Polytechnic University Area of Strategic Importance project (1‐ZE22) to LMCC.
No conflicts of interest were declared.
References
- 1. El‐Serag HB, Rudolph KL. Hepatocellular carcinoma: epidemiology and molecular carcinogenesis. Gastroenterology 2007; 132: 2557–2576. [DOI] [PubMed] [Google Scholar]
- 2. Bruix J, Sherman M, American Association for the Study of Liver Diseases. Management of hepatocellular carcinoma: an update. Hepatology 2011; 53: 1020–1022. [DOI] [PMC free article] [PubMed] [Google Scholar]
- 3. Phillips JE, Corces VG. CTCF: master weaver of the genome. Cell 2009; 137: 1194–1211. [DOI] [PMC free article] [PubMed] [Google Scholar]
- 4. Kim TH, Abdullaev ZK, Smith AD, et al Analysis of the vertebrate insulator protein CTCF‐binding sites in the human genome. Cell 2007; 128: 1231–1245. [DOI] [PMC free article] [PubMed] [Google Scholar]
- 5. Filippova GN, Fagerlie S, Klenova EM, et al An exceptionally conserved transcriptional repressor, CTCF, employs different combinations of zinc fingers to bind diverged promoter sequences of avian and mammalian c‐myc oncogenes. Mol Cell Biol 1996; 16: 2802–2813. [DOI] [PMC free article] [PubMed] [Google Scholar]
- 6. Ohlsson R, Bartkuhn M, Renkawitz R. CTCF shapes chromatin by multiple mechanisms: the impact of 20 years of CTCF research on understanding the workings of chromatin. Chromosoma 2010; 119: 351–360. [DOI] [PMC free article] [PubMed] [Google Scholar]
- 7. Torrano V, Chernukhin I, Docquier F, et al CTCF regulates growth and erythroid differentiation of human myeloid leukemia cells. J Biol Chem 2005; 280: 28152–28161. [DOI] [PubMed] [Google Scholar]
- 8. Rasko JE, Klenova EM, León J, et al Cell growth inhibition by the multifunctional multivalent zinc‐finger factor CTCF. Cancer Res 2001; 61: 6002–6007. [PubMed] [Google Scholar]
- 9. Docquier F, Farrar D, D'Arcy V, et al Heightened expression of CTCF in breast cancer cells is associated with resistance to apoptosis. Cancer Res 2005; 65: 5112–5122. [DOI] [PubMed] [Google Scholar]
- 10. Fiorentino FP, Macaluso M, Miranda F, et al CTCF and BORIS regulate Rb2/p130 gene transcription: a novel mechanism and a new paradigm for understanding the biology of lung cancer. Mol Cancer Res 2011; 9: 225–233. [DOI] [PubMed] [Google Scholar]
- 11. Chen H, Tian Y, Shu W, et al Comprehensive identification and annotation of cell type‐specific and ubiquitous CTCF‐binding sites in the human genome. PLoS One 2012; 7: e41374. [DOI] [PMC free article] [PubMed] [Google Scholar]
- 12. Wang H, Maurano MT, Qu H, et al Widespread plasticity in CTCF occupancy linked to DNA methylation. Genome Res 2012; 22: 1680–1688. [DOI] [PMC free article] [PubMed] [Google Scholar]
- 13. Chen J, Chan AW‐H, To K‐F , et al SIRT2 overexpression in hepatocellular carcinoma mediates epithelial to mesenchymal transition by protein kinase B/glycogen synthase kinase‐3β/β‐catenin signaling. Hepatology 2013; 57: 2287–2298. [DOI] [PubMed] [Google Scholar]
- 14. Chen J, Zhang B, Wong N, et al Sirtuin 1 is upregulated in a subset of hepatocellular carcinomas where it is essential for telomere maintenance and tumor cell growth. Cancer Res 2011; 71: 4138–4149. [DOI] [PubMed] [Google Scholar]
- 15. Ko BCB, Lam AKM, Kapus A, et al Fyn and p38 signaling are both required for maximal hypertonic activation of the osmotic response element‐binding protein/tonicity‐responsive enhancer‐binding protein (OREBP/TonEBP). J Biol Chem 2002; 277: 46085—46092. [DOI] [PubMed] [Google Scholar]
- 16. Zhang B, Chen J, Cheng ASL, et al Depletion of sirtuin 1 (SIRT1) leads to epigenetic modifications of telomerase (TERT) gene in hepatocellular carcinoma cells. PLoS One 2014; 9: e84931. [DOI] [PMC free article] [PubMed] [Google Scholar]
- 17. Lau EYT, Lo J, Cheng BYL, et al Cancer‐associated fibroblasts regulate tumor‐initiating cell plasticity in hepatocellular carcinoma through c‐Met/FRA1/HEY1 signaling. Cell Rep 2016; 15: 1175–1189. [DOI] [PubMed] [Google Scholar]
- 18. Deng Y, Chan SS, Chang S. Telomere dysfunction and tumour suppression: the senescence connection. Nat Rev Cancer 2008; 8: 450–458. [DOI] [PMC free article] [PubMed] [Google Scholar]
- 19. Kim S‐H, Davalos AR, Heo S‐J, et al Telomere dysfunction and cell survival: roles for distinct TIN2‐containing complexes. J Cell Biol 2008; 181: 447–460. [DOI] [PMC free article] [PubMed] [Google Scholar]
- 20. Veldman T, Etheridge KT, Counter CM. Loss of hPot1 function leads to telomere instability and a cut‐like phenotype. Curr Biol 2004; 14: 2264–2270. [DOI] [PubMed] [Google Scholar]
- 21. de Lange T. Shelterin: the protein complex that shapes and safeguards human telomeres. Genes Dev 2005; 19: 2100–2110. [DOI] [PubMed] [Google Scholar]
- 22. Kopanja D, Pandey A, Kiefer M, et al Essential roles of FoxM1 in Ras‐induced liver cancer progression and in cancer cells with stem cell features. J Hepatol 2015; 63: 429–436. [DOI] [PMC free article] [PubMed] [Google Scholar]
- 23. Ho DW, Kai AK, Ng IO. TCGA whole‐transcriptome sequencing data reveals significantly dysregulated genes and signaling pathways in hepatocellular carcinoma. Front Med 2015; 9: 322–330. [DOI] [PubMed] [Google Scholar]
- 24. Xia L, Huang W, Tian D, et al ACP5, a direct transcriptional target of FoxM1, promotes tumor metastasis and indicates poor prognosis in hepatocellular carcinoma. Oncogene 2014; 33: 1395–1406. [DOI] [PubMed] [Google Scholar]
- 25. Meerzaman DM, Yan C, Chen QR, et al Genome‐wide transcriptional sequencing identifies novel mutations in metabolic genes in human hepatocellular carcinoma. Cancer Genomics Proteomics 2014; 11: 1–12. [PubMed] [Google Scholar]
- 26. Raychaudhuri P, Park HJ. FoxM1: a master regulator of tumor metastasis. Cancer Res 2011; 71: 4329–4333. [DOI] [PMC free article] [PubMed] [Google Scholar]
- 27. Hark AT, Schoenherr CJ, Katz DJ, et al CTCF mediates methylation‐sensitive enhancer‐blocking activity at the H19/Igf2 locus. Nature 2000; 405: 486–489. [DOI] [PubMed] [Google Scholar]
- 28. Uhlén M, Fagerberg L, Hallström BM, et al Proteomics. Tissue‐based map of the human proteome. Science 2015; 347: 1260419. [DOI] [PubMed] [Google Scholar]
- 29. Hnisz D, Weintraub AS, Day DS, et al Activation of proto‐oncogenes by disruption of chromosome neighborhoods. Science 2016; 351: 1454–1458. [DOI] [PMC free article] [PubMed] [Google Scholar]
- 30. Marshall AD, Bailey CG, Champ K, et al CTCF genetic alterations in endometrial carcinoma are pro‐tumorigenic. Oncogene 2017; 36: 4100–4110. [DOI] [PMC free article] [PubMed] [Google Scholar]
- 31. Aulmann S, Bläker H, Penzel R, et al CTCF gene mutations in invasive ductal breast cancer. Breast Cancer Res Treat 2003; 80: 347–352. [DOI] [PubMed] [Google Scholar]
- 32. Filippova GN, Qi C‐F, Ulmer JE, et al Tumor‐associated zinc finger mutations in the CTCF transcription factor selectively alter its DNA‐binding specificity. Cancer Res 2002; 62: 48–52. [PubMed] [Google Scholar]
- 33. Yoshida K, Toki T, Okuno Y, et al The landscape of somatic mutations in Down syndrome‐related myeloid disorders. Nat Genet 2013; 45: 1293–1299. [DOI] [PubMed] [Google Scholar]
- 34. Zhang J, Ding L, Holmfeldt L, Wu G, et al The genetic basis of early T‐cell precursor acute lymphoblastic leukaemia. Nature 2012; 481: 157–163. [DOI] [PMC free article] [PubMed] [Google Scholar]
- 35. Kemp CJ, Moore JM, Moser R, et al CTCF haploinsufficiency destabilizes DNA methylation and predisposes to cancer. Cell Rep 2014; 7: 1020–1029. [DOI] [PMC free article] [PubMed] [Google Scholar]
- 36. Flavahan WA, Drier Y, Liau BB, et al Insulator dysfunction and oncogene activation in IDH mutant gliomas. Nature 2016; 529: 110–114. [DOI] [PMC free article] [PubMed] [Google Scholar]
- 37. Katainen R, Dave K, Pitkänen E, et al CTCF/cohesin‐binding sites are frequently mutated in cancer. Nat Genet 2015; 47: 818–821. [DOI] [PubMed] [Google Scholar]
- 38. Fujimoto A, Furuta M, Totoki Y, et al Whole‐genome mutational landscape and characterization of noncoding and structural mutations in liver cancer. Nat Genet 2016; 48: 500–509. [DOI] [PubMed] [Google Scholar]
- 39. Méndez‐Catalá CF, Gretton S, Vostrov A, et al A novel mechanism for CTCF in the epigenetic regulation of Bax in breast cancer cells. Neoplasia 2013; 15: 898–912. [DOI] [PMC free article] [PubMed] [Google Scholar]
- 40. Ong C‐T, Corces VG. CTCF: an architectural protein bridging genome topology and function. Nat Rev Genet 2014; 15: 234–246. [DOI] [PMC free article] [PubMed] [Google Scholar]
- 41. Yu W, Ginjala V, Pant V, et al Poly(ADP‐ribosyl)ation regulates CTCF‐dependent chromatin insulation. Nat Genet 2004; 36: 1105–1110. [DOI] [PubMed] [Google Scholar]
- 42. Klenova EM, Chernukhin IV, El‐Kady A, et al Functional phosphorylation sites in the C‐terminal region of the multivalent multifunctional transcriptional factor CTCF. Mol Cell Biol 2001; 21: 2221–2234. [DOI] [PMC free article] [PubMed] [Google Scholar]
- 43. Okabe H, Satoh S, Kato T, et al Genome‐wide analysis of gene expression in human hepatocellular carcinomas using cDNA microarray: identification of genes involved in viral carcinogenesis and tumor progression. Cancer Res 2001; 61: 2129–2137. [PubMed] [Google Scholar]
- 44. Koo C‐Y, Muir KW, Lam EW‐F. FOXM1: from cancer initiation to progression and treatment. Biochim Biophys Acta 2012; 1819: 28–37. [DOI] [PubMed] [Google Scholar]
- 45. Meng FD, Wei JC, Qu K, et al FoxM1 overexpression promotes epithelial–mesenchymal transition and metastasis of hepatocellular carcinoma. World J Gastroenterol 2015; 21: 196–213. [DOI] [PMC free article] [PubMed] [Google Scholar]
- 46. Cuddapah S, Jothi R, Schones DE, et al Global analysis of the insulator binding protein CTCF in chromatin barrier regions reveals demarcation of active and repressive domains. Genome Res 2009; 19: 24–32. [DOI] [PMC free article] [PubMed] [Google Scholar]
- 47. Schmidt D, Schwalie PC, Wilson MD, et al Waves of retrotransposon expansion remodel genome organization and CTCF binding in multiple mammalian lineages. Cell 2012; 148: 335–348. [DOI] [PMC free article] [PubMed] [Google Scholar]
Associated Data
This section collects any data citations, data availability statements, or supplementary materials included in this article.
Supplementary Materials
Supplementary materials and methods
Figure S1. CTCF expression, cell proliferation and colony formation following transduction with siRNA and shRNAs. HCC cells transfected with SMARTpool siRNA against CTCF (siCTCF) resulted in significant reduction in CTCF A) mRNA and B) protein levels compared with the control siRNA (siCont) C) siRNA‐mediated depletion of CTCF significantly reduced the proliferation of HepG2, SK‐HEP‐1, and Hep3B cells. Cell proliferation was determined by trypan blue exclusion assay at the indicated time points. Plots are cumulative cell numbers versus days in culture. *, P < 0.001. D) Depletion of CTCF reduced cell colony formation. Representative images of HepG2, SK‐HEP‐1, and Hep3B cells transduced with lentiviruses expressing the indicated shRNAs were shown.
Figure S2. Analysis of mRNA levels relevant to telomere maintenance in cell lines following transduction with shRNA. A) Real‐time qPCR analysis of gene expressions related to telomere maintenance in SK‐HEP‐1 cells transduced with lentiviruses expressing the indicated shRNA for 4 days. B) Real‐time qPCR analysis of gene expressions in SK‐HEP‐1 and HepG2 cells transduced with lentiviruses expressing the indicated shRNA for 4 days. ACTB mRNA levels wer used as an internal control. Experiment was conducted in triplicate. Data represent mean ± SD of 3 independent experiments. *, P < 0.01.
Figure S3. Location of putative CTCF‐binding sites in the TERT and FOXM1 gene promoter regions. A) TERT and B) FOXM1 promoters. Bioinformatics analysis was conducted using CTCFBSDB 2.0 (http://insulatordb.uthsc.edu). Putative CTCF‐binding sites with position weight matrices score > 4 were shown. ChIP‐seq Peak of CTCF in FOXM1 promoter was obtained from ENCODE.
Table S1. Clinicopathological information of hepatocellular carcinoma patients
Table S2. Primer sequences for Reverse Transcription‐qPCR analyses
Table S3. Primer sequences for ChIP‐qPCR analysis
Table S4. Human expression array analysis of PLC5 cells 2 days after transduction with shCont or shCTCF‐2. Only annotated genes altered by ≥2.0‐fold on depletion of CTCF are listed