

Abstract
Objective
To assess the effect of treatment with febuxostat versus placebo on joint damage in hyperuricemic subjects with early gout (1 or 2 gout flares).
Methods
In this double‐blind, placebo‐controlled study, 314 subjects with hyperuricemia (serum uric acid [UA] level of ≥7.0 mg/dl) and early gout were randomized 1:1 to receive once‐daily febuxostat 40 mg (increased to 80 mg if the serum UA level was ≥6.0 mg/dl on day 14) or placebo. The primary efficacy end point was the mean change from baseline to month 24 in the modified Sharp/van der Heijde erosion score for the single affected joint. Additional efficacy end points included change from baseline to month 24 in the Rheumatoid Arthritis Magnetic Resonance Imaging Scoring (RAMRIS) scores for synovitis, erosion, and edema in the single affected joint, the incidence of gout flares, and serum UA levels. Safety was assessed throughout the study.
Results
Treatment with febuxostat did not lead to any notable changes in joint erosion over 2 years. In both treatment groups, the mean change from baseline to month 24 in the modified Sharp/van der Heijde erosion score for the single affected joint was minimal, with no between‐group differences. However, treatment with febuxostat significantly improved the RAMRIS synovitis score at month 24 compared with placebo treatment (change from baseline −0.43 versus −0.07; P <0.001), decreased the overall incidence of gout flares (29.3% versus 41.4%; P < 0.05), and improved serum UA control (62.8% versus 5.7%; P < 0.001). No major safety concerns were reported.
Conclusion
Urate‐lowering therapy with febuxostat improved magnetic resonance imaging–determined synovitis and reduced the incidence of gout flares in subjects with early gout.
Gout is a chronic disease characterized by monosodium urate crystal deposition 1, 2. Gout management guidelines recommend urate‐lowering therapy for subjects with frequent flares, typically at least 2 flares in the preceding year 3. Xanthine oxidase inhibitors such as allopurinol or febuxostat are recommended by the American College of Rheumatology (ACR) as first‐line urate‐lowering therapy for subjects with gout 3. The benefits and risks of urate‐lowering therapy for subjects with earlier disease are unknown. Recently, the conventional clinical treatment goal of achieving a significant reduction in the serum urate level has been brought into question by national guidelines that focused heavily on improvement of gout symptoms 4. Thus, there is considerable need for clinical trial data showing clear associations between a reduction in urate levels and less frequent gout flares, which we examined in this study.
While acute self‐limiting flares are the most common clinical presentation of gout, joint damage is a frequent complication 5. Both bone erosion and focal cartilage damage are closely associated with the presence of tophi within the joint 6, 7. Although joint damage is typically a late feature of long‐standing gout, longitudinal observational data have indicated that joint damage can occur in some subjects with early disease, and that development of bone erosion is associated with clinical evidence of increased urate crystal deposition 8.
In subjects with gout, the severity of joint damage can be evaluated by a number of different imaging techniques, including plain radiography and magnetic resonance imaging (MRI) 2, 9. Scoring based on radiographic images is commonly used to analyze the severity and progression of structural damage, such as bone erosions and joint space narrowing (JSN) 9. Compared with plain radiography, MRI provides increased sensitivity for assessing joint damage by detecting abnormalities in both bone and soft tissue 10. The aim of this study was to assess the effect of treatment with febuxostat compared with placebo over a 2‐year period in hyperuricemic subjects with early gout.
Patients and methods
Study design. This phase II, double‐blind, multicenter, placebo‐controlled study enrolled subjects with hyperuricemia (serum uric acid [UA] level of ≥7.0 mg/dl) and early gout (defined as 1 or 2 flares). This study was conducted at sites in the US, in compliance with the institutional review board/independent ethics committee regulations stated in the US Code of Federal Regulations, Good Clinical Practice (GCP) regulations and guidelines, the principles of the Declaration of Helsinki and the International Conference on Harmonisation guidelines for GCP, and all applicable local regulations. All subjects provided informed consent prior to participation in any study procedures. All study protocols, along with informed consent forms, were approved by the study site institutional review boards or independent ethics committees.
The study duration was 24 months. After an initial clinic visit for eligibility screening on day −35, subjects were randomized 1:1 on day 1 to receive either febuxostat 40 mg once daily or placebo (Figure 1). Serum UA levels were assessed on day 14; in subjects with a serum UA level of ≥6.0 mg/dl, the febuxostat dosage increased to 80 mg once daily at month 1, and this dosage was maintained for the remainder of the study. Subjects with a serum UA level of <6.0 mg/dl continued to receive febuxostat 40 mg. For the first 6 months, all subjects received prophylaxis against gout flares (either colchicine 0.6 mg once daily or naproxen 250 mg twice daily plus lansoprazole 15 mg once daily). In subjects receiving concomitant medications and those with comorbid conditions, the dose of colchicine could be reduced, or other gout flare management approaches could be used, as deemed appropriate by the investigator. Subjects returned to the clinic at scheduled time points for radiographic assessment, MRI, clinical assessment, and laboratory tests for safety assessments. Subjects were contacted by telephone throughout the study in order to assess adverse events (AEs), compliance, concomitant medications, and gout flares.
Figure 1.
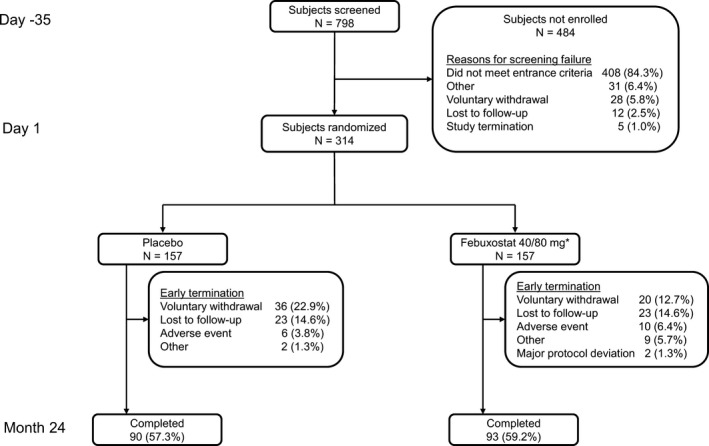
Study design and subject disposition. * = Of the 157 subjects randomized to receive febuxostat 40 mg once daily, 60 required a dosage increase to 80 mg once daily at month 1.
Subject selection. Enrolled subjects were required to have a serum UA level of ≥7.0 mg/dl, meet the American Rheumatology Association preliminary classification criteria for gout 11, and have early gout (which was defined as 1 or 2 gout flares). Subjects with 2 gout flares could have experienced only 1 flare in the past 12 months. Eligible male subjects were to be ≥18 years of age, and eligible female subjects were to be ≥45 years of age and >2 years postmenopausal, or ≥55 years of age in those receiving hormone replacement therapy.
Subjects were not eligible to enroll if they had previously received urate‐lowering therapy or had secondary hyperuricemia, rheumatoid arthritis (RA), active peptic ulcer disease, a history of xanthinuria, a myocardial infarction or stroke within 90 days prior to screening, or cancer not in remission for ≥5 years. In addition, subjects could not enroll if they had an estimated glomerular filtration rate (eGFR) of <60 ml/minute/1.73 m2 as calculated using the Modification of Diet in Renal Disease equation 12, a serum creatinine level of >2.0 mg/dl, an alanine aminotransferase or aspartate aminotransferase level of >2.0× the upper limit of normal, a history of drug or alcohol abuse in the past 5 years, or any issues that would prevent them from undergoing MRI or otherwise participating in the study. Subjects with an eGFR of <60 ml/minute/1.73 m2 were excluded because gadolinium was considered to be unsafe in subjects with renal impairment and therefore was not recommended in this population.
Assessments and end points. Efficacy was assessed using radiography, MRI, incidence of gout flares, and serum UA measurements. Subjects could not have a disease flare at the time of the imaging assessments, in order to avoid transiently high synovitis and bone edema scores. Radiographs of a single affected joint (the joint in which the subject reported having the first gout flare) and corresponding contralateral joint were obtained at the time of screening and at the month 6, month 12, month 18, and month 24 visits, and/or the early termination visit. If the subject was unable to report the specific location of the first flare, the right first metatarsophalangeal joint was considered to be the primary affected joint. In addition, radiographic assessment of both full hands and feet was performed at screening and month 24 and/or early termination. Radiographic assessments were performed using a modified Sharp/van der Heijde (SHS) scoring system previously validated in subjects with gout to evaluate bone erosion and JSN 13. The single affected joint was scored for erosion (range 0–10), JSN (range 0–4), and erosion plus JSN total score (range 0–14); the hands and feet were also scored for erosion (range 0–320), JSN (range 0–208), and erosion plus JSN (range 0–528).
MRI studies of the affected joint and the corresponding contralateral joint were performed at screening, month 12, month 24, and/or early termination, using a standardized protocol and a core set of pulse sequences 14. MRI sequences of the single affected joint were obtained before and after gadolinium contrast administration (unless there were contraindications to gadolinium use), while MRI sequences of the contralateral joint were obtained only before contrast administration. MRI assessments used the Rheumatoid Arthritis MRI Scoring (RAMRIS) system to evaluate bone erosion (range 0–10 for each side of the joint, total range 0–20 for the single affected joint), bone marrow edema (range 0–10 for each side of the joint, total range 0–20 for the single affected joint), and synovitis (range 0–3 for the single affected joint) 14. Synovitis was assessed on contrast‐enhanced images. All radiographic and MRI images were transmitted and archived by a central imaging vendor (Parexel Medical Imaging [formerly Perceptive Informatics]). Images were read only for subjects who completed the month 24 or early termination visit and were assessed in a blinded manner by 2 independent readers.
Gout flares were assessed at screening and throughout the study. Subjects were instructed to contact the investigator when they experienced a suspected gout flare and when the flare resolved. Subjects with confirmed acute gout flares received standard‐of‐care treatment at the discretion of the investigator. All gout flares were followed up until complete resolution was achieved. The percentage of subjects with at least 1 gout flare was summarized according to time interval (months 0–6, 6–12, 12–18, and 18–24), as well as for the overall study duration.
Serum samples for the analysis of serum UA were collected at the time of screening, day 1 and day 14, months 1, 3, 6, 12, 18, and 24, or early termination. Throughout the study, the sponsor and investigators at the study sites were blinded to the serum UA test results.
The primary efficacy end point was the mean change from baseline to month 24 in the modified SHS erosion score for the single affected joint. The prespecified secondary efficacy end points were the mean change from baseline to month 24 in the total modified SHS score for radiographs of the single affected joint; the modified SHS total score for radiographs of full hands and feet; the modified SHS erosion score for radiographs of full hands and feet; and RAMRIS scores for erosion, edema, and synovitis based on MRI. Additional efficacy end points included the percentage of subjects with at least 1 gout flare requiring treatment throughout the study and the percentage of subjects with a serum UA level of <6.0 mg/dl at month 24.
Safety was assessed by evaluating the incidence of AEs, including cardiovascular (CV) AEs, electrocardiography findings, clinical laboratory values, and vital signs. All CV AEs, including deaths that were possibly related to CV AEs, were sent to an adjudication committee for evaluation as major adverse cardiac events in a blinded manner.
Statistical analysis. The efficacy analysis was performed on the full analysis set, which included all subjects who were randomized and received ≥1 dose of study medication; subjects were analyzed according to the assigned treatment group. Efficacy analyses of imaging end points included only subjects with results for month 24, because images were read only for subjects who had completed the month 24 visit. The percentage of subjects with gout flares was calculated based on the number of subjects who had ≥1 day of study medication exposure during the corresponding time interval. The safety analysis was conducted with the safety analysis set, which included all subjects who received ≥1 dose of study medication; subjects were analyzed according to the study medication they received.
Statistical analyses were performed using SAS System version 9.2 with the HP‐UNix operating system. All statistical tests and confidence intervals were 2‐sided with a significance level of 0.05. All computations were performed prior to rounding. Descriptive statistics were used to summarize continuous variables for demographic and baseline characteristics and gout history. The number and percentage of subjects were used to summarize categorical variables for demographic and baseline characteristics. Primary and secondary efficacy variables were compared between the placebo and febuxostat treatment groups, using rank analysis of covariance (ANCOVA) model. Baseline imaging results were included in the ANCOVA model, assessing change from baseline for various imaging scores. Descriptive statistics were used to summarize baseline, month 24, and change from baseline to month 24 values for the efficacy variables. The between‐group difference in the incidence of gout flares was analyzed using Fisher's exact test.
Enrollment of 300 subjects (150 per treatment group) was planned. This sample size provided >80% power to detect a difference in the change from baseline to month 24 in the modified SHS erosion score for the single affected joint at a 2‐sided significance level of 0.05, assuming a mean change of 2.0 in the placebo group, 0.5 in the febuxostat group, and a common SD of 4.0 using the Wilcoxon‐Mann‐Whitney rank sum test. The calculation also assumed a dropout rate of 20%. These assumptions were based on the mean changes in the modified SHS erosion score observed in a study comparing adalimumab with placebo in patients with RA 15.
Results
Subject disposition and characteristics. Among the 798 subjects screened, 314 were enrolled (157 in each treatment group). The reasons for screening failure are shown Figure 1. Sixty subjects in the febuxostat group who initially received febuxostat 40 mg had a dose adjustment to 80 mg. Ninety subjects (57.3%) in the placebo group and 93 subjects (59.2%) in the febuxostat group completed the study (Figure 1). A total of 78 subjects withdrew during year 1 (37 in the placebo group and 41 in the febuxostat 40/80 mg group). An additional 53 subjects (30 in the placebo group and 23 in the febuxostat group) dropped out during year 2. Overall, reasons for discontinuation were balanced between the 2 groups (Figure 1), with the exception of the number of subjects withdrawing voluntarily, which was slightly higher in the placebo group. The most common reasons for voluntary withdrawal included a work schedule conflict and relocation.
The majority of subjects were male (91.7%), white (76.4%), and had a body mass index of ≥30 kg/m2 (66.6%); the mean age was 50.8 years (Table 1). In general, baseline characteristics were balanced between treatment groups (Table 1). For ~85% of subjects in each treatment group, the location of the first gout flare was the metatarsophalangeal joint (Table 1). The median time since the last flare was 85 days in all subjects. The numbers of subjects with a history of CV events were similar between groups. In both groups, among subjects who had a nonmissing score at baseline, most had RAMRIS erosion and synovitis scores of >0 in the single affected joint, but only a small percentage had a modified SHS erosion score of >0 in the single affected joint (Table 1).
Table 1.
Baseline demographics and characteristics of the study subjectsa
| Placebo (n = 157) | Febuxostat (n = 157) | Placebo (n = 157) | Febuxostat (n = 157) | ||
|---|---|---|---|---|---|
| Characteristic | Modified SHS erosion score for full hands and feet (range 0–320) | ||||
| Male sex | 145 (92.4) | 143 (91.1) | Mean ± SD | 0.17 ± 0.47 | 0.36 ± 1.16 |
| Age, mean ± SD years | 50.1 ± 11.7 | 51.4 ± 12.4 | >0d | 16/86 (19) | 24/91 (26) |
| Race | Total modified SHS score for full hands and feet (range 0–528) | ||||
| Asian | 10 (6.4) | 8 (5.1) | Mean ± SD | 4.56 ± 8.63 | 4.98 ± 9.71 |
| Black/African American | 24 (15.3) | 25 (15.9) | >0d | 66/86 (77) | 79/91 (87) |
| White | 121 (77.1) | 119 (75.8) | RAMRIS synovitis score in single affected joint (range 0–3) | ||
| Otherb | 2 (1.3) | 5 (3.2) | Mean ± SD | 1.09 ± 0.69 | 1.29 ± 0.78 |
| Ethnicity | >0d | 68/76 (89) | 77/82 (94) | ||
| Hispanic or Latino | 36 (22.9) | 26 (16.6) | RAMRIS bone erosion score in single affected joint (range 0–20) | ||
| Not Hispanic or Latino | 121 (77.1) | 131 (83.4) | Mean ± SD | 1.48 ± 0.92 | 1.63 ± 0.94 |
| Body mass index, kg/m2 | >0d | 73/77 (95) | 79/84 (94) | ||
| Mean ± SD | 32.3 ± 6.23 | 33.1 ± 6.40 | RAMRIS bone marrow edema score in single affected joint (range 0–6) | ||
| ≥30 | 100 (63.7) | 109 (69.4) | Mean ± SD | 0.51 ± 0.92 | 0.73 ± 1.02 |
| Renal functionc | >0d | 27/75 (36) | 37/81 (46) | ||
| Normal | 40 (25.5) | 49 (31.2) | Location of primary affected joints | ||
| Mild impairment | 115 (73.2) | 105 (66.9) | Metatarsophalangeal | ||
| Moderate impairment | 2 (1.3) | 3 (1.9) | Left | 69 (43.9) | 58 (36.9) |
| Baseline serum UA, mg/dl | Right | 71 (54.2) | 75 (47.8) | ||
| Mean ± SD | 8.8 ± 1.33 | 8.7 ± 1.40 | Overall | 140 (89.2) | 133 (84.7) |
| <9.0 | 93 (59.2) | 93 (59.2) | Ankle | ||
| 9.0–10.0 | 38 (24.2) | 38 (24.2) | Left | 4 (2.5) | 7 (4.5) |
| >10.0 | 26 (16.6) | 26 (16.6) | Right | 7 (4.5) | 11 (7.0) |
| Tophus present at baseline | 24 (15.3) | 14 (8.9) | Overall | 11 (7.0) | 18 (11.5) |
| Previous gout flares | Metacarpophalangeal | ||||
| 1 | 113 (72.0) | 125 (79.6) | Left | 1 (<1) | 0 |
| 2 | 44 (28.0) | 32 (20.4) | Right | 1 (<1) | 2 (1.3) |
| Time since last flare, median days | 80 | 98 | Overall | 2 (1.3) | 2 (1.3) |
| Baseline imaging score | Interphalangeal | ||||
| Modified SHS erosion score for single affected joint (range 0–10) | Left | 3 (1.9) | 2 (1.3) | ||
| Mean ± SD | 0.11 ± 0.44 | 0.16 ± 0.44 | Right | 1 (<1) | 2 (1.3) |
| >0d | 7/82 (9) | 12/86 (14) | Overall | 4 (2.5) | 4 (2.5) |
| Total modified SHS score (erosion and narrowing) for single affected joint (range 0–14) | |||||
| Mean ± SD | 0.77 ± 1.02 | 0.85 ± 1.06 | |||
| >0d | 50/82 (61) | 54/86 (63) |
Except where indicated otherwise, values are the number (%). UA = uric acid; SHS = Sharp/van der Heijde system; RAMRIS = Rheumatoid Arthritis Magnetic Resonance Imaging Scoring system.
Combined categories of American Indian or Alaska Native, Native Hawaiian or other Pacific Islander, or other.
Defined according to the estimated glomerular filtration (eGFR) rate using the Modification of Diet in Renal Disease equation, where normal = eGFR ≥90 ml/minute/1.73 m2, mild impairment = eGFR 60–89 ml/minute/1.73 m2, and moderate impairment = eGFR 30–59 ml/minute/1.73 m2.
Values are the number/total number (%) of subjects who completed the month 24 visit and had a nonmissing score.
Efficacy. Imaging. Radiographic assessments of the single affected joint and full hands and feet demonstrated that once daily treatment with febuxostat or placebo for up to 24 months did not lead to any notable changes in joint erosion (Table 2). In both groups, the mean change from baseline at all time points in the modified SHS erosion scores of the single affected joint were very small. The mean change from baseline to month 24 in modified SHS erosion scores of the single affected joint was not statistically significantly different between the placebo and febuxostat groups. Similarly, the mean change from baseline to month 24 in the total modified SHS (erosion and JSN) score of the single affected joint was very small in both groups, with no significant between‐group difference (Table 2).
Table 2.
Change from baseline to month 24 in the primary and secondary end points (intent‐to‐treat analysis)a
| Variable | Placebo | Febuxostat | ||
|---|---|---|---|---|
| n | Mean ± SD | n | Mean ± SD | |
| Primary end point | ||||
| Modified SHS erosion score, single affected joint | ||||
| Baseline | 82 | 0.11 ± 0.44 | 86 | 0.16 ± 0.44 |
| CFB to month 12 | 80 | 0.00 ± 0.00 | 84 | −0.01 ± 0.18 |
| CFB to month 24b | 82 | 0.01 ± 0.25 | 86 | 0.01 ± 0.33 |
| Secondary end points | ||||
| Total modified SHS score (erosion and narrowing), single affected joint | ||||
| Baseline | 82 | 0.77 ± 1.02 | 86 | 0.85 ± 1.06 |
| CFB to month 12 | 80 | −0.04 ± 0.20 | 84 | −0.03 ± 0.38 |
| CFB to month 24 | 76 | 0.05 ± 0.36 | 81 | 0.00 ± 0.60 |
| Modified SHS erosion score, full hands and feet | ||||
| Baseline | 86 | 0.17 ± 0.47 | 91 | 0.36 ± 1.16 |
| CFB to month 24 | 74 | 0.11 ± 0.97 | 78 | 0.17 ± 1.71 |
| Total modified SHS score, full hands and feet | ||||
| Baseline | 86 | 4.56 ± 8.63 | 91 | 4.98 ± 9.71 |
| CFB to month 24 | 74 | 0.29 ± 1.75 | 78 | 0.31 ± 2.45 |
| RAMRIS synovitis score, single affected joint | ||||
| Baseline | 76 | 1.09 ± 0.69 | 82 | 1.29 ± 0.78 |
| CFB to month 12 | 72 | −0.06 ± 0.54 | 79 | −0.34 ± 0.73c |
| CFB to month 24 | 67 | −0.07 ± 0.53 | 75 | −0.43 ± 0.71d |
| RAMRIS erosion score, single affected joint, distal + proximal | ||||
| Baseline | 77 | 1.48 ± 0.92 | 84 | 1.63 ± 0.94 |
| CFB to month 12 | 75 | 0.00 ± 0.39 | 83 | −0.11 ± 0.57 |
| CFB to month 24 | 69 | 0.04 ± 0.48 | 79 | −0.01 ± 0.70 |
| RAMRIS edema score, single affected joint, distal + proximal | ||||
| Baseline | 75 | 0.51 ± 0.92 | 81 | 0.73 ± 1.02 |
| CFB to month 12 | 73 | −0.07 ± 0.83 | 80 | −0.35 ± 0.91 |
| CFB to month 24 | 66 | −0.10 ± 0.96 | 77 | −0.36 ± 0.92 |
SHS = Sharp/van der Heijde score; CFB = change from baseline; RAMRIS = Rheumatoid Arthritis Magnetic Resonance Imaging Scoring system.
Missing values at month 24 were imputed using linear extrapolation.
P = 0.025 versus placebo.
P < 0.001 versus placebo.
The baseline mean modified SHS total and erosion scores of full hands and feet in both treatment groups are shown in Table 2. At month 24, there were no statistically significant differences in the mean change from baseline in the modified SHS total or erosion scores of full hands and feet between the placebo and febuxostat groups (Table 2).
MRI assessments of the single affected joint demonstrated that treatment with febuxostat for up to 24 months did not lead to any notable changes in bone erosion or bone marrow edema but significantly improved synovitis. The mean changes from baseline to months 12 and 24 in RAMRIS bone erosion and bone marrow edema scores were not significantly different between treatment groups (Table 2). However, a significantly greater reduction in the RAMRIS synovitis score was observed at months 12 (P = 0.025) and 24 (P < 0.001) in the febuxostat group compared with the placebo group (Figure 2) (representative MRI images are shown in Supplementary Figures 1 and 2, available on the Arthritis & Rheumatology web site at http://onlinelibrary.wiley.com/doi/10.1002/art.40233/abstract). When summarizing RAMRIS synovitis scores in subjects according to the number of historical gout flares, the statistically significant differences in change from baseline were mostly retained between treatment groups. In subjects with a history of 1 gout flare, there was a significant between‐group difference in the mean ± SD change from baseline in the RAMRIS synovitis score at month 24 (−0.12 ± 0.57 versus −0.42 ± 0.73 in the placebo and febuxostat groups, respectively; P = 0.005) but not at month 12 (−0.10 ± 0.57 versus −0.29 ± 0.75 in the placebo and febuxostat groups, respectively; P = 0.123).
Figure 2.
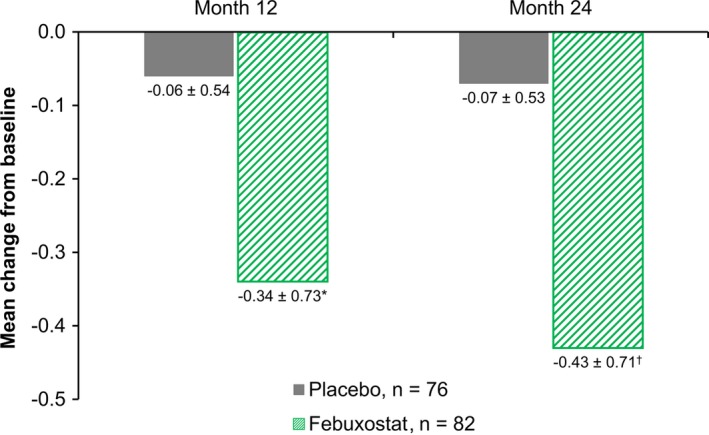
Change from baseline in the Rheumatoid Arthritis Magnetic Resonance Imaging Scoring synovitis score. Values are the mean ± SD. * = P = 0.025; † = P < 0.001.
In subjects with a history of 2 gout flares, the between‐group difference in the mean ± SD change from baseline in synovitis scores was significant at both month 12 (0.06 ± 0.45 versus −0.53 ± 0.62 in the placebo and febuxostat groups, respectively; P = 0.016) and month 24 (0.06 ± 0.39 versus −0.50 ± 0.65 in the placebo and febuxostat groups, respectively; P = 0.01).
Gout flares. During the first 6 months of the study, the percentage of subjects with at least 1 flare was slightly higher in the febuxostat group compared with the placebo group, although the difference was not statistically significant (Figure 3). During the subsequent months (months 6–12, 12–18, and 18–24), the percentages of subjects with at least 1 flare were all significantly lower in the febuxostat group compared with the placebo group (P < 0.05 for all time periods). Over the entire study duration, the percentage of subjects with at least 1 flare was also significantly lower in the febuxostat group compared with the placebo group (29.3% versus 41.4%; P < 0.05).
Figure 3.
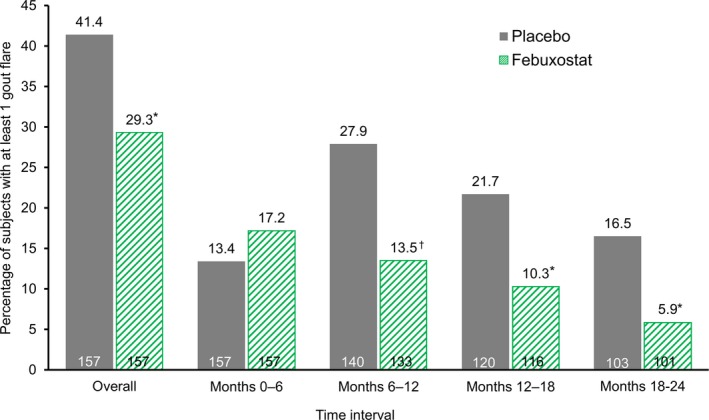
Percentage of subjects with at least 1 gout flare. * = P < 0.05; † = P < 0.01 versus placebo, by Fisher's exact test.
Serum uric acid. Febuxostat provided more effective serum UA control than did placebo. At baseline, the mean serum UA levels in the placebo and febuxostat groups were 8.8 mg/dl and 8.7 mg/dl, respectively. After 2 years, the mean serum UA levels were 8.2 mg/dl in the placebo group and 5.7 mg/dl in the febuxostat group. Over the course of the study, the proportion of subjects with serum UA levels of <6.0 mg/dl was consistently significantly higher in the febuxostat group compared with the placebo group. On day 14 and months 1, 6, 12, and 24, 59.5%, 59.9%, 66.9%, 64.3%, and 62.8% of subjects in the febuxostat group, respectively, and 0%, 0.7%, 2.2%, 1.7%, and 5.7% in the placebo group, respectively (P < 0.001 at all time points) had a serum UA level of <6.0 mg/dl (see Supplementary Figure 3, available on the Arthritis & Rheumatology web site at http://onlinelibrary.wiley.com/doi/10.1002/art.40233/abstract).
Safety. The patterns of observed treatment‐emergent AEs (TEAEs) were similar between the placebo and febuxostat groups (Table 3). Most TEAEs were mild to moderate in intensity. Elevated liver function test results were observed in 15 patients in the placebo group and 21 patients in the febuxostat 40/80 mg group; these events were mild to moderate in intensity and resolved without changes in therapy. The incidence of TEAEs considered to be treatment‐related by the investigator was low. Common treatment‐related TEAEs that were experienced by ≥2 subjects in either treatment group included elevated liver function test results (5 subjects in the placebo group and 9 in the febuxostat group), elevated skeletal and cardiac muscle test results (2 subjects in the placebo group and 5 in the febuxostat group), and dermatitis and eczema (0 subjects in the placebo group and 3 in the febuxostat group).
Table 3.
Adverse events and markedly elevated liver function test values in subjects according to treatment groupa
| Placebo (n = 157) | Febuxostat (n = 157) | |
|---|---|---|
| ≥1 TEAE | 76 (48.4) | 89 (56.7) |
| Most frequently reported TEAEs (≥5% of subjects)b | ||
| Upper respiratory tract infection | 21 (13.4) | 27 (17.2) |
| Musculoskeletal and connective tissue pain and discomfort | 25 (15.9) | 21 (13.4) |
| Liver function analyses | 15 (9.6) | 21 (13.4) |
| Joint‐related signs and symptoms | 11 (7.0) | 15 (9.6) |
| Headaches NEC | 11 (7.0) | 5 (3.2) |
| Skeletal and cardiac muscle analyses | 11 (7.0) | 9 (5.7) |
| Diarrhea (noninfectious) | 6 (3.8) | 9 (5.7) |
| Edema NEC | 5 (3.2) | 9 (5.7) |
| Dermatitis and eczema | 4 (2.5) | 8 (5.1) |
| Upper respiratory tract signs and symptoms | 1 (<1) | 8 (5.1) |
| Vascular hypertensive disorders NEC | 7 (4.5) | 8 (5.1) |
| ≥1 treatment‐related TEAE | 20 (12.7) | 29 (18.5) |
| ≥1 serious TEAE | 11 (7.0) | 13 (8.3) |
| ≥1 TEAE leading to study drug withdrawal | 6 (3.8) | 10 (6.4) |
| Primary MACE | 2 (1) | 3 (2) |
| Cardiac death | 1 (<1) | 1 (<1) |
| Nonfatal myocardial infarction | 0 | 1 (<1) |
| Nonfatal stroke | 0 | 0 |
| Unstable angina, with urgent coronary revascularization | 1 (<1) | 1 (<1) |
| Nonprimary MACE | 4 (3) | 2 (1) |
| Urgent cerebral revascularization | 0 | 0 |
| Hospitalized chronic heart failure | 2 (1) | 0 |
| Arrhythmias not associated with ischemia | 1 (<1) | 1 (<1) |
| Venous and peripheral arterial thromboembolic events | 1 (<1) | 1 (<1) |
| Transient ischemic attack | 0 | 0 |
| Other CV events | 0 | 0 |
| Non‐CV events | 9 (6) | 7 (4) |
| ALT elevation | ||
| >3× ULN | 4 (2.5) | 8 (5.1) |
| ≥5× ULN | 2 (1.3) | 1 (<1) |
| ≥10× ULN | 1 (<1) | 1 (<1) |
| >3× ULN and total bilirubin >1.5× ULN | 1 (<1)c | 0 |
| >3× ULN and total bilirubin >2.0× ULN | 1 (<1)c | 0 |
| AST elevation | ||
| >3× ULN | 3 (1.9) | 5 (3.2) |
| ≥5× ULN | 2 (1.3) | 2 (1.3) |
| ≥10× ULN | 0 | 0 |
| >3× ULN and total bilirubin >1.5× ULN | 1 (<1)c | 0 |
| >3× ULN and total bilirubin >2.0× ULN | 1 (<1)c | 0 |
| Both ALT and AST >3× ULN | 3 (1.9) | 2 (1.3) |
Values are the number (%) of subjects. TEAE = treatment‐emergent adverse event; NEC = not elsewhere classified; MACE = major adjudicated cardiovascular event; CV = cardiovascular; ALT = alanine aminotransferase; ULN = upper limit of normal; AST = aspartate transaminase.
According to Medical Dictionary for Regulatory Activities high level terms.
The subject experienced a serious AE (severe hepatic infection) on day 548. The event resolved on day 566, and elevated liver function test values later resolved to normal. The event was considered by the investigator to be unrelated to treatment, and the subject continued in the study.
Two subjects died during the study. One subject in the febuxostat group who had a history of congestive heart failure, hypertension, chronic obstructive pulmonary disease, and ischemic heart disease died of congestive heart failure. One subject in the placebo group with a history of congestive heart failure, cardiac arrhythmias, myocardial infarction, QT prolongation, and ischemic cardiomyopathy died of ventricular fibrillation. Neither death was considered to be related to the study drug. The total number of subjects with major adverse CV events was low (2 subjects in the placebo group [CV death and unstable angina with urgent coronary revascularization, respectively] and 3 subjects in the febuxostat group [CV death, nonfatal myocardial infarction, and unstable angina with urgent coronary revascularization]).
The rates of other serious TEAEs were similar between groups, and no trends were observed (Table 3). Most serious TEAEs were experienced by no more than 1 subject. Most TEAEs leading to discontinuation were also experienced by only 1 subject, with the exception of abnormal liver function test results, which were reported by 4 subjects in the febuxostat group and no subjects in the placebo group.
Discussion
To our knowledge, this is the first randomized controlled study examining the effects of urate‐lowering therapy in subjects with early gout. The primary end point was change in the radiographic erosion score in the single affected joint. However, very little radiographic damage was observed at baseline, and there was no change over the 24‐month study period in either group. In contrast, MRI‐detected synovitis in the single affected joint was observed in most subjects at baseline, and febuxostat treatment led to significantly greater improvements in RAMRIS synovitis scores compared with placebo. Recurrent flares affected >40% of the placebo group over the 2‐year period. Over the study period, treatment with febuxostat significantly reduced the incidence of gout flares compared with placebo. Febuxostat was generally well tolerated in this population of subjects with early gout.
The current study provides important new information about the natural history of joint damage in subjects with gout. Joint damage has been associated with tophaceous gout 6, 8, which is typically a late feature that often develops >10 years after initial gout presentation if the disease is left untreated 16. In this study of early gout, erosion on plain radiography was infrequently observed at baseline, and no change in erosion scores in either group was noted over the 2‐year study period. The lack of evidence of progression in both the febuxostat and placebo groups is in stark contrast to radiographic progression in the early stages of other forms of erosive arthritis, such as RA 17, 18. Because no studies of radiographic progression in gout were available at the time of study design, the sample size for this study was calculated based on radiographic progression in patients with early RA. The results of the current study suggest that the natural history of radiographic damage in gout is quite different from that in RA.
Consistent with other imaging studies in patients with gout 10, 19, MRI detected significantly more erosions and also revealed that most subjects had evidence of synovitis at baseline. A key finding of the current study is that febuxostat treatment led to greater improvements in MRI‐detected synovitis over the 2‐year period compared with placebo treatment. To our knowledge, this trial is the first to demonstrate that urate‐lowering therapy can improve synovitis in subjects with gout. Importantly, MRI scanning was not undertaken when a gout flare was clinically apparent. Although MRI is not routinely used for gout assessment in clinical practice, it is a useful tool in research settings due to its sensitivity for detecting inflammation and joint damage 20. The clinical implications of subclinical synovitis in patients with gout are uncertain; in particular, it is unknown whether synovitis is a risk factor for future flares or joint damage, as is the case with other forms of inflammatory arthritis, such as RA 21. However, consistent with the reduction in MRI‐detected synovitis, febuxostat treatment also significantly reduced the incidence of gout flares over the 2‐year study period.
Changes in the incidence of gout flares during this study contrast with the results of previous phase II and phase III randomized clinical trials (RCTs) of febuxostat, in which the treatment arms did not demonstrate benefit in flare control compared with the control arms 22, 23, 24. There are a number of reasons for the discordance in results of the current study and those of previous RCTs of febuxostat.
First, subjects in the current study had early gout and thus were different from those with a much longer disease duration in previous RCTs; because of their early disease stage, the subjects in the current study may also have had a lower urate crystal burden and, therefore were likely to experience a faster flare benefit from urate‐lowering therapy.
Second, even in subjects with early gout, the benefits in terms of flare control in this placebo‐controlled RCT were observed only after 6 months of febuxostat treatment. The only other placebo‐controlled RCT of febuxostat had a duration of 28 weeks and did not demonstrate any between‐arm difference in the flare rate toward the end of the study 24. This result was consistent with the findings in our study when the subjects were treated for 28 weeks.
Third, according to previous studies, subjects with gout often experience an increased risk of flare in the initial phase of urate‐lowering therapy, which may increase the between‐arm difference in the rate of gout flares 25.
Finally, an RCT of longer duration (up to 52 weeks) used another urate‐lowering drug, allopurinol, as an active comparator 23. Because in that study, a reduced incidence of flares was observed in both treatment arms over 1 year, the between‐arm difference was not as significant as that in the current study. This reduction in the number of flares has particular timely significance, because the recent American College of Physicians guidelines cite a lack of RCT evidence showing the benefit of urate‐lowering therapy for improving symptoms such as flares 26.
One limitation of the current study is the high rate of subject discontinuation, although a high rate of withdrawal is common in long‐term gout trials 27, 28. In our study, the overall discontinuation rates and the reasons for discontinuation were balanced between the febuxostat and placebo groups. The most common reasons for discontinuation in both groups were loss to follow‐up and voluntary withdrawal. Although the rate of voluntary withdrawal was slightly higher in the placebo group, the most common reasons for voluntary withdrawal were a work schedule conflict and relocation, which were unrelated to the treatment that subjects received. For these reasons, it is unlikely that subject discontinuation would result in selection bias.
In the 2012 ACR gout management guidelines, it is recommended that urate‐lowering therapy should be prescribed for patients with frequent flares, typically at least 2 flares in the preceding year 3. In the more recent 2016 European League Against Rheumatism guidelines it is recommended that urate‐lowering therapy be considered after the first gout flare 29. In the current study of early gout, febuxostat led to a significantly higher proportion of subjects achieving serum UA target levels of <6 mg/dl, improved the MRI synovitis score, significantly reduced flare frequency over the 2‐year study period, and was well tolerated. Most TEAEs were not considered to be treatment‐related, and very few led to early discontinuation of the study drug. Increases in liver function test values were mild to moderate in severity, and most resolved by the end of the study. No new safety concerns were identified in subjects receiving febuxostat 40/80 mg once daily for up to 2 years.
In conclusion, this study demonstrated that initiating treatment with febuxostat in subjects with ≤2 gout flares can reduce synovitis, prevent future gout flares, and improve serum UA control without any outstanding safety concerns. The results suggest that reducing serum urate levels in patients with early gout may provide treatment benefits.
Author Contributions
All authors were involved in drafting the article or revising it critically for important intellectual content, and all authors approved the final version to be published. Dr. Dalbeth had full access to all of the data in the study and takes responsibility for the integrity of the data and the accuracy of the data analysis.
Study conception and design
Dalbeth, Saag, Choi, Thienel, Hunt, MacDonald, Gunawardhana.
Acquisition of data
Dalbeth, Saag, Palmer, Hunt, MacDonald.
Analysis and interpretation of data
Dalbeth, Saag, Palmer, Choi, Hunt, MacDonald, Thienel, Gunawardhana.
Role of the study sponsor
Takeda Pharmaceutical International, Inc. collaborated with Drs. Dalbeth, Saag, Choi, and Thienel, Ms Hunt, Ms MacDonald, and Dr. Gunawardhana in the design and conduct of the trial, and participated in data reporting. Takeda provided writing and editorial assistance (performed by Liqing Xiao, PhD, and Meryl Gersh, PhD, AlphaBioCom, LLC, King of Prussia, PA). Publication of this article was not contingent upon approval by Takeda.
Additional disclosures
Author Thienel is an employee of RRD International.
Supporting information
Acknowledgments
We thank Karen Carlson, the Takeda Clinical Operations manager, for her contributions to this study, as well as all the investigators and patients for their participation in the study. Imaging analysis was conducted by PAREXEL Medical Imaging (formerly Perceptive Informatics), Billerica, Massachusetts.
ClinicalTrials.gov identifier: NCT010783.
Supported by Takeda Pharmaceutical International, Inc.
Dr. Dalbeth has received consulting fees and/or speaking fees from Takeda, CymaBay, Ardea Biosciences, AstraZeneca, and Horizon (less than $10,000 each) and research grants from AstraZeneca. Dr. Saag has received consulting fees from Takeda, Sobi, Horizon, and Ironwood/AstraZeneca (less than $10,000 each) and research grants from Takeda, Sobi, Horizon, and Ironwood/AstraZeneca. Dr. Choi has received consulting fees, speaking fees, and/or honoraria from AstraZeneca and Takeda Pharmaceuticals (less than $10,000 each) and research grants from AstraZeneca and Takeda Pharmaceuticals. Ms MacDonald owns stock or stock options in Takeda Development Center Americas, Inc. Dr. Gunawardhana owns stock or stock options in Takeda Development Center Americas, Inc.
References
- 1. Pascual E, Batlle‐Gualda E, Martinez A, Rosas J, Vela P. Synovial fluid analysis for diagnosis of intercritical gout. Ann Intern Med 1999;131:756–9. [DOI] [PubMed] [Google Scholar]
- 2. Neogi T, Jansen TL, Dalbeth N, Fransen J, Schumacher HR, Berendsen D, et al. 2015 gout classification criteria: an American College of Rheumatology/European League Against Rheumatism collaborative initiative. Arthritis Rheumatol 2015;67:2557–68. [DOI] [PMC free article] [PubMed] [Google Scholar]
- 3. Khanna D, Fitzgerald JD, Khanna PP, Bae S, Singh MK, Neogi T, et al. 2012 American College of Rheumatology guidelines for management of gout. Part 1: systematic nonpharmacologic and pharmacologic therapeutic approaches to hyperuricemia. Arthritis Care Res (Hoboken) 2012;64:1431–46. [DOI] [PMC free article] [PubMed] [Google Scholar]
- 4. Qaseem A, Harris RP, Forciea MA, for the Clinical Guidelines Committee of the American College of Physicians . Management of acute and recurrent gout: a clinical practice guideline from the American College of Physicians. Ann Intern Med 2017;166:58–68. [DOI] [PubMed] [Google Scholar]
- 5. Barthelemy CR, Nakayama DA, Carrera GF, Lightfoot RW Jr, Wortmann RL. Gouty arthritis: a prospective radiographic evaluation of sixty patients. Skeletal Radiol 1984;11:1–8. [DOI] [PubMed] [Google Scholar]
- 6. Dalbeth N, Clark B, Gregory K, Gamble G, Sheehan T, Doyle A, et al. Mechanisms of bone erosion in gout: a quantitative analysis using plain radiography and computed tomography. Ann Rheum Dis 2009;68:1290–5. [DOI] [PubMed] [Google Scholar]
- 7. Popovich I, Dalbeth N, Doyle A, Reeves Q, McQueen FM. Exploring cartilage damage in gout using 3‐T MRI: distribution and associations with joint inflammation and tophus deposition. Skeletal Radiol 2014;43:917–24. [DOI] [PubMed] [Google Scholar]
- 8. Eason A, House ME, Vincent Z, Knight J, Tan P, Horne A, et al. Factors associated with change in radiographic damage scores in gout: a prospective observational study. Ann Rheum Dis 2016;75:2075–9. [DOI] [PubMed] [Google Scholar]
- 9. Chowalloor PV, Siew TK, Keen HI. Imaging in gout: a review of the recent developments. Ther Adv Musculoskelet Dis 2014;6:131–43. [DOI] [PMC free article] [PubMed] [Google Scholar]
- 10. Carter JD, Kedar RP, Anderson SR, Osorio AH, Albritton NL, Gnanashanmugam S, et al. An analysis of MRI and ultrasound imaging in patients with gout who have normal plain radiographs. Rheumatology (Oxford) 2009;48:1442–6. [DOI] [PubMed] [Google Scholar]
- 11. Wallace SL, Robinson H, Masi AT, Decker JL, McCarty DJ, Yü TF. Preliminary criteria for the classification of the acute arthritis of primary gout. Arthritis Rheum 1977;20:895–900. [DOI] [PubMed] [Google Scholar]
- 12. Levey AS, Coresh J, Greene T, Stevens LA, Zhang YL, Hendriksen S, et al. Using standardized serum creatinine values in the modification of diet in renal disease study equation for estimating glomerular filtration rate. Ann Intern Med 2006;145:247–54. [DOI] [PubMed] [Google Scholar]
- 13. Dalbeth N, Clark B, McQueen F, Doyle A, Taylor W. Validation of a radiographic damage index in chronic gout. Arthritis Rheum 2007;57:1067–73. [DOI] [PubMed] [Google Scholar]
- 14. Ostergaard M, Peterfy C, Conaghan P, McQueen F, Bird P, Ejbjerg B, et al. OMERACT rheumatoid arthritis magnetic resonance imaging studies: core set of MRI acquisitions, joint pathology definitions, and the OMERACT RA‐MRI scoring system. J Rheumatol 2003;30:1385–6. [PubMed] [Google Scholar]
- 15. HUMIRA™ (adalimumab) prescribing information . North Chicago: Abbott Laboratories; 2002. URL: http://www.rxabbvie.com/pdf/humira.pdf.
- 16. Hench PS. Diagnosis and treatment of gout and gouty arthritis. JAMA 1941;116:453–9. [Google Scholar]
- 17. Breedveld FC, Emery P, Keystone E, Patel K, Furst DE, Kalden JR, et al. Infliximab in active early rheumatoid arthritis. Ann Rheum Dis 2004;63:149–55. [DOI] [PMC free article] [PubMed] [Google Scholar]
- 18. Genovese MC, Bathon JM, Martin RW, Fleischmann RM, Tesser JR, Schiff MH, et al. Etanercept versus methotrexate in patients with early rheumatoid arthritis: two‐year radiographic and clinical outcomes. Arthritis Rheum 2002;46:1443–50. [DOI] [PubMed] [Google Scholar]
- 19. Carter JD, Patelli M, Anderson SR, Prakash N, Rodriquez EJ, Bateman H, et al. An MRI assessment of chronic synovial‐based inflammation in gout and its correlation with serum urate levels. Clin Rheumatol 2015;34:345–51. [DOI] [PubMed] [Google Scholar]
- 20. McQueen FM, Doyle A, Reeves Q, Gao A, Tsai A, Gamble GD, et al. Bone erosions in patients with chronic gouty arthropathy are associated with tophi but not bone oedema or synovitis: new insights from a 3 T MRI study. Rheumatology (Oxford) 2014;53:95–103. [DOI] [PubMed] [Google Scholar]
- 21. Brown AK, Quinn MA, Karim Z, Conaghan PG, Peterfy CG, Hensor E, et al. Presence of significant synovitis in rheumatoid arthritis patients with disease‐modifying antirheumatic drug–induced clinical remission: evidence from an imaging study may explain structural progression. Arthritis Rheum 2006;54:3761–73. [DOI] [PubMed] [Google Scholar]
- 22. Becker MA, Schumacher HR, Espinoza LR, Wells AF, MacDonald P, Lloyd E, et al. The urate‐lowering efficacy and safety of febuxostat in the treatment of the hyperuricemia of gout: the CONFIRMS trial. Arthritis Res Ther 2010;12:R63. [DOI] [PMC free article] [PubMed] [Google Scholar]
- 23. Becker MA, Schumacher HR Jr, Wortmann RL, MacDonald PA, Eustace D, Palo WA, et al. Febuxostat compared with allopurinol in patients with hyperuricemia and gout. N Engl J Med 2005;353:2450–61. [DOI] [PubMed] [Google Scholar]
- 24. Schumacher HR Jr, Becker MA, Wortmann RL, Macdonald PA, Hunt B, Streit J, et al. Effects of febuxostat versus allopurinol and placebo in reducing serum urate in subjects with hyperuricemia and gout: a 28‐week, phase III, randomized, double‐blind, parallel‐group trial. Arthritis Rheum 2008;59:1540–8. [DOI] [PubMed] [Google Scholar]
- 25. Becker MA, MacDonald PA, Hunt BJ, Lademacher C, Joseph‐Ridge N. Determinants of the clinical outcomes of gout during the first year of urate‐lowering therapy. Nucleosides Nucleotides Nucleic Acids 2008;27:585–91. [DOI] [PubMed] [Google Scholar]
- 26. Qaseem A, Harris RP, Forciea MA. Management of acute and recurrent gout: a clinical practice guideline from the American College of Physicians. Ann Intern Med 2017;166:58–68. [DOI] [PubMed] [Google Scholar]
- 27. Becker MA, Schumacher HR, MacDonald PA, Lloyd E, Lademacher C. Clinical efficacy and safety of successful longterm urate lowering with febuxostat or allopurinol in subjects with gout. J Rheumatol 2009;36:1273–82. [DOI] [PubMed] [Google Scholar]
- 28. Schumacher HR Jr, Becker MA, Lloyd E, MacDonald PA, Lademacher C. Febuxostat in the treatment of gout: 5‐yr findings of the FOCUS efficacy and safety study. Rheumatology (Oxford) 2009;48:188–94. [DOI] [PubMed] [Google Scholar]
- 29. Richette P, Doherty M, Pascual E, Barskova V, Becce F, Castañeda‐Sanabria J, et al. 2016 updated EULAR evidence‐based recommendations for the management of gout. Ann Rheum Dis 2017;76:29–42. [DOI] [PubMed] [Google Scholar]
Associated Data
This section collects any data citations, data availability statements, or supplementary materials included in this article.
Supplementary Materials