

Abstract
Objective
To test serum tau as a predictor of neurological outcome after cardiac arrest.
Methods
We measured the neuronal protein tau in serum at 24, 48, and 72 hours after cardiac arrest in 689 patients in the prospective international Target Temperature Management trial. The main outcome was poor neurological outcome, defined as Cerebral Performance Categories 3–5 at 6 months.
Results
Increased tau was associated with poor outcome at 6 months after cardiac arrest (median = 38.5, interquartile range [IQR] = 5.7–245ng/l in poor vs median = 1.5, IQR = 0.7–2.4ng/l in good outcome, for tau at 72 hours, p < 0.0001). Tau improved prediction of poor outcome compared to using clinical information (p < 0.0001). Tau cutoffs had low false‐positive rates (FPRs) for good outcome while retaining high sensitivity for poor outcome. For example, tau at 72 hours had FPR = 2% (95% CI = 1–4%) with sensitivity = 66% (95% CI = 61–70%). Tau had higher accuracy than serum neuron‐specific enolase (NSE; the area under the receiver operating characteristic curve was 0.91 for tau vs 0.86 for NSE at 72 hours, p = 0.00024). During follow‐up (up to 956 days), tau was significantly associated with overall survival. The accuracy in predicting outcome by serum tau was equally high for patients randomized to 33 °C and 36 °C targeted temperature after cardiac arrest.
Interpretation
Serum tau is a promising novel biomarker for prediction of neurological outcome in patients with cardiac arrest. It may be significantly better than serum NSE, which is recommended in guidelines and currently used in clinical practice in several countries to predict outcome after cardiac arrest. Ann Neurol 2017;82:665–675
Cardiac arrest accounts for a high proportion of mechanically ventilated patients admitted to intensive care units (ICUs).1 The length of ICU stay is increasing, but rates of mortality and neurological morbidity due to anoxic brain injury remain very high.2 There is a need for early and accurate prognostication methods, both to avoid prolonged treatment of patients where continued life‐supporting measures is futile, and to ensure that patients with potential for recovery receive optimal management.3 Possible prognostication methods include neurological examination, electroencephalography (EEG), short‐latency somatosensory evoked potentials (SSEPs), neuroimaging, biochemical markers, and automated pupillometry.4 Some methods, notably SSEP, have high specificity to predict poor outcome but limited sensitivity to identify patients with severe brain injury.5 Other methods, such as EEG6 and neuroimaging,7 appear more sensitive but may be prone to interpreter variability.8
Blood‐borne biomarkers may be easily obtained and provide a means to quantify the extent of brain injury.9 The most studied biochemical marker in cardiac arrest is serum neuron‐specific enolase (NSE),10 which is included in guidelines11, 12 and already used in clinical practice in some countries. However, NSE is susceptible to false‐positive values due to hemolysis.13 Another potential biomarker is the axonal injury marker tau.14 Cerebrospinal fluid (CSF) tau is increased in patients with cardiac arrest and poor outcome.15 Measurements of tau in blood would be preferable to CSF measurements, because lumbar puncture is impractical in these patients, who are commonly treated with high doses of platelet aggregation inhibitors or anticoagulants. One study on 22 patients that used an immunoassay with the Luminex system found that high serum tau at 48 hours or 96 hours was associated with poor neurological outcome after cardiac arrest.16
An ultrasensitive tau assay suitable for serum and plasma measurements has been developed on a single‐molecule detection platform,17 and showed promising results in a small cardiac arrest study.18 We used a novel version of the single‐molecule detection assay to quantify serum tau in a nested cohort within the Target Temperature Management (TTM) trial, which is a large prospective cardiac arrest study.2 We aimed to evaluate tau as a predictor of neurological outcome and death. We also compared tau with NSE for prognostication.
Subjects and Methods
Patient Population
The TTM trial was a prospective study of effects of targeted temperature management at 33 °C versus 36 °C in patients who were unconscious after out‐of‐hospital cardiac arrest. The design19 and main results2 of the TTM trial have been published. Neurological prognostication and criteria for withdrawal of life‐sustaining therapy were parts of the protocol.20 Twenty‐nine European centers participated in the biobank part of the TTM trial, and 819 patients were consecutively recruited at these sites between November 2010 and January 2013. Of these, 38 died within 24 hours, leaving 782 eligible patients for this substudy. The final population consisted of 689 patients (689 of 782, 88%) who had serum tau data for at least 1 time point (24 hours, 48 hours, or 72 hours). Randomization to the 2 TTM arms was stratified by site and was therefore preserved in the substudy. The STARD guidelines were followed for this study.21
Serum Biomarker Measurements
Biochemical analyses were done at the end of the study. Tau (the index test) was measured using the Human Total Tau kit (research use only grade, Quanterix, Lexington, MA) on the Simoa HD‐1 analyzer, as described previously.17 This assay uses a monoclonal capture antibody that reacts with a linear epitope in the midregion of all tau isoforms, and a detection antibody that reacts with a linear epitope in the N‐terminal region of total tau. NSE was measured using a Cobas e601 instrument with an Electrochemiluminescent immunoassay (Roche Diagnostics, Rotkreuz, Switzerland), as described previously.10 Hemolysis was tested with the Cobas system. All samples were analyzed using single batches of reagents, by board‐certified laboratory technicians who were blinded to all clinical data. Treating physicians and staff were blinded to tau and NSE data.
Outcome Measures
Neurological outcome at 6 months was assessed face to face by the Cerebral Performance Categories (CPC) scale and the modified Rankin scale (mRS). CPC ranges from 1 to 5, where 1 represents no or minor cerebral disability, 2 moderate disability, 3 severe disability, 4 vegetative state, and 5 brain death. mRS ranges from 0 to 6, where 0 represents no symptoms, 1 symptoms but no disability, 2 slight disability, 3 moderate disability, 4 moderate to severe disability, 5 severe disability, and 6 death. The main endpoint was “poor neurological outcome” (CPC 3–5, the reference standard), and contrasted with “good neurological outcome” (CPC 1–2). In a sensitivity analysis, we used CPC 4–5 as the definition of poor neurological outcome. All‐cause mortality was assessed after a minimum follow‐up time of 6 months.
Statistics
Statistics were done using R (v3.3.2, The R Foundation for Statistical Computing). Bivariate associations were tested by Spearman correlation and Mann–Whitney U tests.
Associations between tau and neurological outcome were tested by linear regression, adjusted for age and sex. Differences in tau over time were tested by linear mixed effects models (lme4 package, v1.1.12), adjusted for age and sex. The diagnostic accuracy for poor outcome was tested by receiver operating characteristic (ROC) analyses, by calculating area under the ROC curve (AUC; pROC package, v1.8). Optimal cutoff points were defined by the Youden index, which maximizes the sum of sensitivity and specificity (Optimal Cutpoints package, v1.1.3). We also defined cutoff points for the false‐positive rates (FPRs) 0%, 1%, 2%, 3%, 4%, and 5%. Confidence intervals (CIs; 95%) for AUC, FPR, sensitivity, and specificity were calculated by a bootstrap procedure (n = 2,000 iterations).
We tested whether tau improved prediction of poor outcome compared to clinical information, in logistic regression models with (1) clinical information (age, time to return of spontaneous circulation [ROSC], and bystander cardiopulmonary resuscitation [CPR; yes/no]), (2) tau, or (3) the combination of tau and clinical information as predictors. Models were compared by AUC and the Akaike Information Criterion (AIC). A lower AIC represents a better fitting of a statistical model, with a difference in AIC (ΔAIC) of > 2 representing some evidence, and >10 representing very strong evidence, for differences between models (favoring the smaller AIC).22
The relationship between tau and overall survival was tested with Cox proportional hazard regression (Survival package, v2.40.1). Cox models were adjusted for age (sex and TTM intervention arm were also evaluated as covariates).
Tau was compared with NSE to predict poor outcome. Using an a priori assumption of an AUC of 0.85 for NSE,10 we had > 80 % power (with α = 0.05) to detect a significantly higher AUC of at least 0.90 for tau.23 We also tested combinations of tau, NSE, and clinical information to predict poor outcome, and we performed survival analyses for combinations of NSE and tau.
To reduce the skewness of the tau measurements, we used log10‐transformed data. However, for clarity we present medians and interquartile ranges (IQRs) on the original scale (rather than means and standard deviations on the log10 scale) when describing the results. Diagnostics of models included inspection of residuals, q‐q plots, and correlations between residuals and predicted and observed data.
Significance was set at p < 0.05. Probability values were adjusted for multiple comparisons by Hochberg correction, as explained below.
Ethics
Ethical approval was obtained from ethical committees in all participating countries. Informed consent was waived, delayed, or obtained from a legal surrogate depending on circumstances. In addition, all surviving patients gave written informed consent.
Results
A total of 689 patients were included (Table 1). Greater tau was associated with older age, longer time to ROSC, lack of bystander CPR, and (for 72 hours tau) female sex (see Table 1).
Table 1.
Demographics
| Characteristic | Value |
|---|---|
| No. | 689 |
| Age, yr | 63.9 ± 12.4 |
| Sex, M/F | 558/131 (81%) |
| Time to ROSC, min | 30.9 ± 22.5 |
| Bystander CPR, No., yes/no | 500/189 (73%) |
| CPC at 6 months, No., 1/2/3/4/5 | 304/43/27/8/307 (44%/6.2%/3.9%/1.2%/45%) |
| mRS at 6 months, No., 0/1/2/3/4/5/6 | 140/114/71/26/17/14/307 (20%/17%/10%/3.8%/2.5%/2%/45%) |
Continuous data are given as mean ± standard deviation. Tau data were available in 667 patients at 24 hours (334 in TTM33 and 333 in TTM36), in 638 patients at 48 hours (313 in TTM33 and 325 in TTM36), and in 590 patients at 72 hours (289 in TTM33 and 301 in TTM36). There were no significant differences in age, sex, time to ROSC, bystander CPR, or CPC or mRS at 6 months between participants with tau data at 24 hours, 48 hours, or 72 hours.
Higher tau was associated with older age (p = 0.00013 for 24‐hour tau, p < 0.0001 for 48‐hour and 72‐hour tau), longer time to ROSC (p < 0.0001), and lack of bystander CPR (p = 0.0060 for 24‐h tau, p = 0.0038 for 48‐hour tau, p = 0.040 for 72‐hour tau). Tau at 72 hours was slightly higher in females than in males (median = 3.5, IQR = 1.7–54.7ng/l vs median = 2.6, IQR = 1.2–24.3ng/l, p = 0.043).
CPC = Cerebral Performance Categories; CPR = cardiopulmonary resuscitation; F = female; IQR = interquartile range; M = male; mRS = modified Rankin scale; ROSC = return of spontaneous circulation; TTM = Target Temperature Management.
There were slight differences between the 33 °C and the 36 °C arms. Tau was higher in the poor outcome group (CPC 3–5) in the 36 °C arm compared to the 33 °C arm at 24 hours (p = 0.016) and 48 hours (p = 0.046), and in the good outcome group (CPC 1–2) in the 33 °C arm compared to the 36 °C arm at 72 hours (p = 0.042, Mann–Whitney U). There were no longitudinal differences in tau between intervention arms in patients with poor outcome. In patients with good outcome, tau decreased between 24 hours and 48 hours in the 36 °C arm (p < 0.0001), but not in the 33 °C arm (p = 0.090), but tau decreased in both arms between 48 hours and 72 hours (33 °C, p = 0.0085; 36 °C, p = 0.00058).
Overall, the differences in serum tau between intervention arms were minor compared to the differences between the good and poor outcome groups. Because neurological outcome did not differ by intervention arm,2 and the overall aim was to test associations between tau and outcome, the analyses were done on the pooled sample. However, we adjusted the results for intervention arm, as described below.
Tau and Neurological Outcome
The primary endpoint was poor neurological outcome, defined as CPC 3–5 at 6 months. Due to missing data (partly due to death during the first 72 hours), the number of patients differed slightly between time points. For patients with 24‐hour data (n = 667), 343 had good and 324 had poor outcome. For patients with 48‐hour data (n = 638), 330 had good and 308 had poor outcome. For patients with 72‐hour data (n = 590), 317 had good and 273 had poor outcome. Poor outcome was associated with higher tau. The effect was already present at 24 hours (median = 12.0, IQR = 4.5–43.5 vs median = 2.4, IQR = 1.5–5.3ng/l, p < 0.0001), and was even greater at 48 hours (median = 49.5, IQR = 7.8–392 vs median = 1.9, IQR = 1.1–3.4ng/l, p < 0.0001) and 72 hours (median = 38.5, IQR = 5.7–245 vs median = 1.5, IQR = 0.7–2.4ng/l, p < 0.0001). The models were adjusted for age and sex, and were robust when adjusting for TTM intervention arm.
We also tested an alternative classification of good versus poor outcome, by classifying CPC 1–3 as good outcome and CPC 4–5 as poor outcome. Serum tau remained higher in the poor outcome group at 24 hours (median = 14.2, IQR = 4.8–48.7 vs median = 2.4, IQR = 1.5–5.3ng/l), 48 hours (median = 64.0, IQR = 8.7–518 vs median = 1.9, IQR = 1.2–3.9ng/l) and 72 hours (median = 54.5, IQR = 7.6–282 vs median = 1.6, IQR = 0.8–2.6ng/l). The differences were significant at all time points (p < 0.0001).
We also evaluated each level of the CPC scale individually (Fig 1A–C). Tau was significantly higher in CPC 5 compared to CPC 1, CPC 2, and CPC 3 at all time points. At 48 to 72 hours, tau was higher in CPC 4 compared to CPC 1, CPC 2, and CPC 3, and higher in CPC 3 compared to CPC 1. Note that there were only few CPC 3–4 patients; therefore, results in them should be interpreted with caution.
Figure 1.
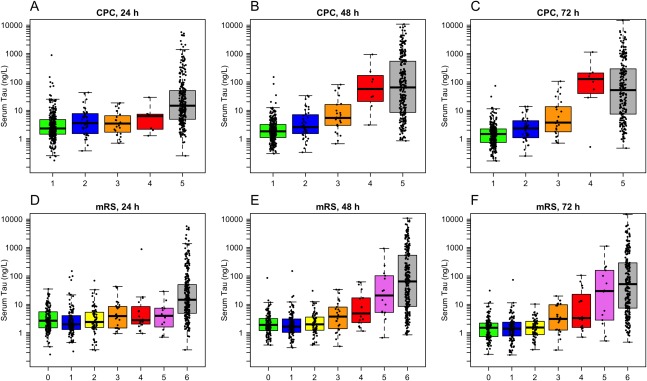
Serum tau concentrations by neurological outcome at 6 months. (A–C) Cerebral Performance Categories (CPC). At 24 hours, CPC 5 had higher tau than CPC 1–3 (p < 0.0001; the difference vs CPC 4 was not significant after correction for multiple comparisons, p = 0.073). At 48 hours, CPC 5 had higher tau than CPC 1–3 (p < 0.0001), CPC 4 had higher tau than CPC 1–2 (p ≤ 0.0001) and CPC 3 (p = 0.011), and CPC 3 had higher tau than CPC 1 (p = 0.002). At 72 hours, CPC 5 had higher tau than CPC 1–3 (p < 0.0001), CPC 4 had higher tau than CPC 1–3 (p < 0.0001 for CPC 1–2 and p = 0.0013 for CPC 3), and CPC 3 had higher tau than CPC 1 (p = 0.0003). (D–F) Modified Rankin scale (mRS). At 24 hours, mRS 6 had higher tau than all other groups (p < 0.0001 for mRS 0–3, p = 0.004 for mRS 4, p = 0.002 for mRS 5). At 48 hours, mRS 6 had higher tau than mRS 0–4 (p < 0.0001), mRS 5 had higher tau than mRS 0–2 (p ≤ 0.0001) and mRS 3 (p = 0.025), and mRS 4 had higher tau than mRS 0 (p = 0.041) and mRS 1 (p = 0.038). At 72 hours, mRS 6 had higher tau than mRS 0–4 (p < 0.0001), mRS 5 had higher tau than mRS 0–2 (p < 0.0001) and mRS 3 (p = 0.012), and mRS 4 had higher tau than mRS 0–2 (mRS 0, p = 0.010; mRS 1, p = 0.012; mRS 2, p = 0.024). All differences were tested by linear regression with log10‐transformed tau data, adjusted for age and sex. Probability values were adjusted for multiple comparisons using Hochberg correction (1 correction at every time point for CPC [n = 10 tests at each time point] and mRS [n = 21 tests at each time point]).
Finally, we also evaluated the mRS scale (see Fig 1D–F). Patients with mRS 6 had higher tau compared to all other groups at 24 hours, and compared to mRS 0–4 at 48 to 72 hours. mRS 5 had higher tau compared to mRS 0–3 at 48 to 72 hours. mRS 4 had higher tau compared to mRS 2 at 72 hours and compared to mRS 0–1 at 48 to 72 hours.
Longitudinal Tau and Neurological Outcome
Changes in tau over time were tested with linear mixed effects models. In CPC 1, tau decreased from a median of 2.3ng/l (IQR = 1.5–4.7) to 1.8ng/l (IQR = 1.1–3.2) between 24 hours and 48 hours (p < 0.0001) and further down to 1.5ng/l (IQR = 0.7–2.2) at 72 hours (p < 0.0001 compared to 48 hours). CPC 2 had a similar decreasing pattern, but the changes were not significant (median = 3.5, IQR = 1.5–7.7; median = 2.6, IQR = 1.6–6.8; and median = 2.3, IQR = 1.1–4.3ng/l). There were no significant changes in CPC 3 (24 hours: median = 3.4, IQR = 1.7–6.5ng/l; 48 hours: median = 5.4, IQR = 3.0–14.4ng/l; 72 hours: median = 3.7, IQR = 1.8–13.4ng/l). CPC 4 increased from 6.2ng/l (IQR = 2.2–7.3) to 66.5ng/l (IQR = 25.8–151) between 24 hours and 48 hours (p < 0.0001), with no significant change at 72 hours (median = 129, IQR = 48.0–203ng/l). CPC 5 increased from 14.5ng/l (IQR = 4.9–49.5) to 64.0ng/l (IQR = 8.5–531) between 24 hours and 48 hours (p < 0.0001), with no significant change at 72 hours (median = 51.4, IQR = 7.4–287ng/l). Due to the small number of CPC 3–4 patients, trajectories in those groups should be interpreted with caution.
Fifty‐four patients (7.8%) died during the first 72 hours. To avoid bias from these patients, we repeated the longitudinal analyses in the subset with tau measured at all time points (557 patients; CPC 1, n = 266; CPC 2, n = 40; CPC 3, n = 21; CPC 4, n = 7; CPC 5, n = 223). The tau levels were slightly lower than in the main analysis (because people who died during the first 72 hours typically had high tau levels), but the results were overall similar. In CPC 1, tau decreased from a median of 2.3ng/l (IQR = 1.5–5.0) to 1.8ng/l (IQR = 1.1–3.2) between 24 hours and 48 hours and further to 1.4ng/l (IQR = 0.7–2.2) at 72 hours (p < 0.001 for all differences). CPC 2 had a similar pattern, but without significant changes (median = 3.9, IQR = 1.5–8.0; median = 2.6, IQR = 1.6–6.8; and median = 2.7, IQR = 1.1–4.4ng/l). CPC 3 increased slightly from 3.4ng/l (IQR = 1.9–7.2) at 24 hours to 5.2ng/l (IQR = 3.0–9.8) at 48 hours, and decreased slightly to 3.1ng/l (IQR = 1.6–9.1) at 72 hours (no significant differences). CPC 4 increased from 6.2ng/l (IQR = 2.2–7.3) to 31.3ng/l (IQR = 22.0–167) between 24 hours and 48 hours (p < 0.001), with no further change at 72 hours (median = 101, IQR = 41.4–178ng/l). CPC 5 increased from 11.7ng/l (IQR = 4.6–41.6) to 55.2ng/l (IQR = 8.4–417) between 24 hours and 48 hours (p < 0.001), with no further change at 72 hours (median = 51.1, IQR = 7.6–283ng/l).
Significances were tested in models adjusted for age and sex. Probability values were adjusted for multiple comparisons using Hochberg correction over 10 tests (2 tests per CPC group).
Prognostic Accuracy of Serum Tau
The accuracy of tau for poor outcome was tested by ROC analyses (Fig 2A). A combination of tau at several time points (entered as individual predictors in a logistic regression model) did not increase the AUC compared to using the 48‐hour or 72‐hour data alone. There were no significant differences in ROC analyses between the intervention arms (33 °C vs 36 °C) for poor outcome versus good outcome.
Figure 2.

Diagnostic accuracy of serum tau for poor outcome. (A) Receiver operating characteristic (ROC) analyses for prediction of Cerebral Performance Categories (CPC) 1–2 versus CPC 3–5 at 6 months. The legend shows area under the ROC curve (AUC) for tau at different time points (with 95% confidence intervals). The AUCs were not affected by adjusting for Target Temperature Management arm. (B–D) Histograms for CPC 1–2 versus CPC 3–5 with cutoffs specified by Youden index (J), false‐positive rate (FPR) = 5%, and FPR = 1%.
High specificity (low FPR) may be the most critical metric for use in cardiac arrest.3 We determined cutoffs for FPR = 0–5% (Table 2 and Fig 2B–D). Sensitivities were relatively high even at low FPR. For example, at FPR = 2% (95% CI = 1–4%) the sensitivity was 66% (95% CI = 60–71%) at 72 hours.
Table 2.
Serum Tau Cutoffs, Sensitivity, and Specificity
| Time | Cutoff design | Cutoff, ng/l | Sensitivity | 95% CI | Specificity | 95% CI |
|---|---|---|---|---|---|---|
| 24 h | Youden | 6.1 | 0.68 | 0.63–0.73 | 0.79 | 0.75–0.84 |
| FPR = 0% | 874.5 | 0.04 | 0.02–0.06 | 1.00 | 0.99–1.00 | |
| FPR = 1% | 82.6 | 0.17 | 0.13–0.21 | 0.99 | 0.98–1.00 | |
| FPR = 2% | 39.1 | 0.29 | 0.23–0.33 | 0.98 | 0.96–0.99 | |
| FPR = 3% | 24.7 | 0.35 | 0.30–0.40 | 0.97 | 0.95–0.99 | |
| FPR = 4% | 22.9 | 0.36 | 0.30–0.40 | 0.96 | 0.94–0.98 | |
| FPR = 5% | 21.5 | 0.37 | 0.31–0.41 | 0.95 | 0.92–0.97 | |
| 48 h | Youden | 6.9 | 0.77 | 0.72–0.81 | 0.91 | 0.88–0.94 |
| FPR = 0% | 148.8 | 0.33 | 0.28–0.38 | 1.00 | 0.99–1.00 | |
| FPR = 1% | 32.0 | 0.54 | 0.49–0.60 | 0.99 | 0.98–1.00 | |
| FPR = 2% | 18.9 | 0.61 | 0.56–0.67 | 0.98 | 0.96–0.99 | |
| FPR = 3% | 13.3 | 0.66 | 0.61–0.72 | 0.97 | 0.95–0.99 | |
| FPR = 4% | 11.6 | 0.68 | 0.63–0.73 | 0.96 | 0.94–0.98 | |
| FPR = 5% | 10.3 | 0.69 | 0.65–0.75 | 0.95 | 0.93–0.97 | |
| 72 h | Youden | 4.4 | 0.78 | 0.73–0.83 | 0.9 | 0.87–0.93 |
| FPR = 0% | 72.7 | 0.42 | 0.36–0.48 | 1.00 | 0.99–1.00 | |
| FPR = 1% | 13.4 | 0.63 | 0.57–0.69 | 0.99 | 0.97–1.00 | |
| FPR = 2% | 11.2 | 0.66 | 0.6–0.710 | 0.98 | 0.96–0.99 | |
| FPR = 3% | 10.3 | 0.67 | 0.62–0.73 | 0.97 | 0.95–0.98 | |
| FPR = 4% | 8.6 | 0.69 | 0.64–0.75 | 0.96 | 0.94–0.98 | |
| FPR = 5% | 7.9 | 0.71 | 0.65–0.77 | 0.95 | 0.92–0.97 |
Test sensitivity and specificity for serum tau (measured at 24 hours, 48 hours, or 72 hours after cardiac arrest) to separate poor outcome (CPC 3–5) from good outcome (CPC 1–2) at 180 days. Cutoffs were designed by the Youden index (which maximizes the combination of sensitivity and specificity), or at tau concentrations that resulted in FPR = 0–5%; 95% CIs for sensitivity and specificity were generated by a bootstrap procedure (n = 2,000 iterations).
CI = confidence interval; CPC = Cerebral Performance Categories; FPR = false positive rate.
Adding Serum Tau to Clinical Information
We compared logistic regression models of poor outcome with (1) clinical information (age, time to ROSC, and bystander CPR [yes/no]), (2) tau, and (3) clinical information and tau as predictors (Supplementary Table). Clinical information had moderate accuracy (AUC ∼ 0.76). The AUC increased to up to 0.94 when adding tau. The effect of adding tau was significant at all time points (p < 0.0001). The coefficient for tau only changed marginally when tau was used alone or together with clinical information. The AICs favored models that included both tau and clinical information.
Serum Tau and Survival
During follow‐up, 319 patients died (median time to death = 6 days, IQR = 4–11, range = 1–736) and 370 remained alive (median follow‐up = 475 days, IQR = 343–625, range = 167–956). Tau was strongly related to survival (Fig 3). Tau (using log10‐transformed data in models adjusted for age) had hazard ratio (HR) = 3.1 (95% CI = 2.7–3.5) at 24 hours, HR = 2.8 (95% CI = 2.5–3.1) at 48 hours, and HR = 2.7 (95% CI = 2.4–3.0) at 72 hours. Sex and TTM intervention arm were also evaluated, but were nonsignificant predictors of survival.
Figure 3.

Serum tau and survival. Survival curves for tau, modeled by Cox proportional hazards regression, adjusted for age are shown. Tau was used after log10 transformation. Tau was used as a continuous variable in these models, but predicted survival curves (with 95% confidence intervals) are shown for 3 different levels of tau, corresponding to the median level within the lowest, middle, and highest tertile of tau, respectively. Greater serum tau was significantly associated with shorter survival in all models.
Serum Tau versus NSE
We found no effects of hemolysis on tau, but as reported before,10 NSE was increased in samples with significant hemolysis (p = 0.047). We therefore excluded samples with a positive hemolysis index (n = 21 from 18 participants in the original cohort with NSE data).
Tau and NSE were correlated (Fig 4A–C), but tau had higher diagnostic accuracy for poor outcome (see Fig 4D–F). When combining tau, NSE, and clinical information (age, sex, time to ROSC, and bystander CPR), both tau and NSE were significant predictors of poor outcome (p < 0.0001, tested at 72 hours). AUCs were similar for (1) a model of NSE and clinical information (AUC = 0.92) and (2) a model of tau and clinical information (AUC = 0.94). The combination of tau, NSE, and clinical information had slightly greater accuracy than model #1 (AUC = 0.95, p < 0.0001), but did not differ from model #2 (p = 0.09).
Figure 4.

Comparison of serum neuron‐specific enolase (NSE) and serum tau to predict poor outcome. (A–C) Correlations between serum tau and NSE. Rho coefficients and probability values are from Spearman correlation. The fitted lines were derived by local regression and are for visualization purposes. (D–F) Receiver operating characteristic (ROC) analyses for Cerebral Performance Categories (CPC) 1–2 vs CPC 3–5 at 6 months. Probability values are for area under the ROC curve (AUC) differences between NSE and tau. The combination of tau and NSE was not better than tau alone (AUC = 0.76 at 24 hours, 0.89 at 48 hours, and 0.91 at 72 hours).
Finally, we tested whether tau and NSE provided independent information about survival, by including both tau and NSE as predictors in Cox proportional hazards models (for this analysis we standardized tau and NSE, to make it easier to compare their coefficients). Both tau and NSE (and age) were independent predictors in these models. At 24 hours, tau had HR = 1.7 (95% CI = 1.5–2.1) and NSE had HR = 1.6 (95% CI = 1.4–1.9). At 48 hours, tau had HR = 2.0 (95% CI = 1.6–2.4) and NSE had HR = 1.7 (95% CI = 1.4–2.2). At 72 hours, tau had HR = 1.8 (95% CI = 1.5–2.3) and NSE had HR = 1.9 (95% CI = 1.5–2.3). Figure 5 shows survival curves for tau, predicted for patients in different tertiles of tau and with high and low NSE levels, respectively. These plots show that tau was associated with survival independently of NSE.
Figure 5.

Serum neuron‐specific enolase (NSE) and serum tau for survival. Survival curves for tau, modeled by Cox proportional hazards regression, adjusted for age and NSE are shown. Tau and NSE were used after log10 transformation, and entered as continuous variables. Models were done using 24‐hour data (A, D), 48‐hour data (B, E), and 72‐hour data (C, F). Predicted survival curves (with 95% confidence intervals) are shown for 3 different levels of tau, corresponding to the median level of tau within the lowest, middle, and highest tertile of tau, respectively. Predicted survival curves are shown for 2 different scenarios, one in the context of low NSE (the median NSE level in the lower half of NSE; A–C) and one in the context of high NSE (the median NSE level in the higher half of NSE; D–F). Greater serum tau was significantly associated with shorter survival in all models.
Comparing Associations between Serum Tau for the CPC and mRS Scales
To test whether the CPC or the mRS scale was more strongly associated with tau, we compared linear regression models with tau as the outcome and (1) CPC as predictor or (2) mRS as predictor, adjusted for age and sex. As measures of model fits, we used AIC and adjusted R 2. At 24 hours, the AICs were 2,446.7 and 2,448.9 (ΔAIC = 2.2), and the R 2s 0.290 and 0.289, for the CPC and mRS models, respectively. At 48 hours, the AICs were 2,522.7 and 2,532.7 (ΔAIC = 10.0), and the R 2s were 0.488 and 0.482. At 72 hours, the AICs were 2,311.1 and 2,325.0 (ΔAIC 13.9), and the R 2s were 0.512 and 0.502. The overall lower AICs favored the CPC scale, but the differences in R 2 were very minor.
Discussion
Using a recently developed ultrasensitive assay for the axonal injury marker tau in a large prospective cohort study, we found that higher serum tau correlated with poor neurological outcome and short survival after cardiac arrest. Tau more accurately predicted a poor outcome compared with serum NSE, which is currently the most widely used biochemical marker for prognostication after cardiac arrest. The association between tau and neurological outcome was independent of TTM intervention arm (33 °C vs 36 °C). The results indicate that serum tau is a prognostic marker of poor neurological outcome following cardiac arrest. Because tau levels were measured after the completion of the study, there was no circularity and minimal risk of “self‐fulfilling prophecy” for the association between serum tau and neurological outcome.
One goal of prognostication after cardiac arrest is to identify patients in whom prolonged intensive care is futile.24 To operationalize tau for decision making, we dichotomized the cohort into good versus poor outcome. The accuracy of tau to detect poor outcome (CPC 3–5 at 6 months) was high, and cutoffs with low FPRs retained a relatively high sensitivity for poor outcome. This suggests that tau may be used with low risk of misclassifying patients with good prognosis, while still correctly identifying around two‐thirds of patients with poor prognosis. It is rare to combine low FPR with high sensitivity for prognostication methods in cardiac arrest.25, 26
When analyzing individual levels of CPC and mRS, we found that tau was primarily increased in CPC 4–5 and mRS 5–6, and slightly increased in CPC 3 and mRS 3–4 patients. In contrast, CPC 1–2 and mRS 0–2 patients had low and even decreasing levels of tau. This suggests that tau not only might be useful in discriminating patients with a poor outcome but also in predicting the grade of brain injury after cardiac arrest. The absolute increases in tau were very high in many patients, with serum tau > 10ng/l, which is much higher than in slowly degenerative diseases, including Alzheimer disease.17
Tau improved prediction of poor outcome compared to clinical information, and the coefficient of tau was similar with and without the clinical covariates, suggesting that tau was independently associated with the neurological outcome. Tau was also closely associated with survival. The predicted 1‐year survival (adjusted for age) varied between 77%, 64%, and 31% for 24‐hour tau; between 82%, 69%, and 18% for 48‐hour tau; and between 83%, 74%, and 21% for 72‐hour tau, for the median tau level within the lowest, mid, and highest tertile of tau, respectively.
In general, the predictive power of tau was greater in later samples. For example, the cutoff for FPR = 2% had sensitivity = 29% at 24 hours, 61% at 48 hours, and 66% at 72 hours. Furthermore, the cutoff for any FPR was higher at 24 hours compared to 48 hours and 72 hours. This suggests that even in people with good prognosis after cardiac arrest there may be an initial transient release of tau, which does not reflect irreversible neurological injury or poor outcome. An alternative explanation is that people who die very soon after cardiac arrest (during the first 2–3 days) are more likely to die from cardiac causes or multiorgan failure (which may not correlate directly with high tau), whereas people who die later are more likely to die from causes related to their brain injury.20, 27 There may also be a pathophysiological delay until a significant amount of tau has been released from injured neurons and axons, which make the later samples more reliable to measure brain injury. The apparent biological half‐life of tau in serum is <10 hours; therefore, prolonged elevations at late time points are likely to be associated with continuous release of tau from injured neurons.18 We did not find evidence that a combination of serial tau measurements improved prediction compared to 48‐hour or 72‐hour tau, but it may still be possible that specific combinations of tau cutoffs and longitudinal changes may provide incremental value, as has been found for NSE.28, 29
Tau was more robust to hemolysis than NSE. In the nonhemolytic samples, the correlation coefficient between tau and NSE was high. Both tau and NSE were independent predictors of poor outcome, but tau had higher diagnostic accuracy for poor outcome. The differences in AUC between NSE and tau were statistically significant, and may also be of clinical relevance. Furthermore, when NSE and tau were considered simultaneously, both tau and NSE predicted survival. Together, these results suggest that tau is overall more closely related to neurological outcome, but both tau and NSE provide partly complementary information after cardiac arrest.
One limitation was that tau was analyzed using the Simoa instrument, which is only available at specialized laboratories. For comparison, NSE may be analyzed on high‐throughput automated analyzers available in many hospital laboratories. Although tau was not sensitive to hemolysis, it may be susceptible to other cohort‐ or study‐dependent factors that are not yet well defined.17 Specific cutoffs may therefore not be not easily transferred between laboratories. The assay in this study was a semiautomated commercially available assay, which requires a Quanterix reader. There are also other assays for tau in blood. Further studies in which they are compared to each other head to head would be a logical next step following on from this study. Different assays may produce different absolute concentrations, just like for NSE, and other biomarkers. This type of variability, as well as within‐laboratory variability, can be solved by the development of certified reference methods and materials for tau in blood, which allow for assay harmonization and uniform reference and decision limits.
Another limitation concerns the definition of poor outcome. We used CPC 3–5 as our main definition of poor outcome, which is the standard in the current literature on cardiac arrest, but poor outcome has sometimes also been defined as CPC 4–5.25, 26 We noted that CPC 4–5 patients were effectively separated from CPC 1–3 patients in tau at 48–72 hours, whereas CPC 3 patients overlapped with CPC 1–2. In sensitivity analyses, we tested CPC 4–5 as an alternative definition of poor outcome, which only marginally affected our results (note that only few patients were classified as CPC 3–4, which is why the different definitions of poor outcome had similar results). The alternative classification of CPC 1–3 is relevant, because the withdrawal of life‐sustaining therapy and the principles for defining poor outcome may differ between countries, and because there is a tendency toward using CPC 3 as a cutoff rather than CPC 4 in studies performed after the introduction of hypothermia in cardiac arrest.25, 26 We also considered the mRS scale, which was closely related to tau, especially at 48 hours (see Fig 1E). In formal testing, there were no large differences for the associations between tau and CPC or mRS.
Prognostication after cardiac arrest is difficult and should never be unimodal. We compared tau with NSE and basic clinical information, but in the future, we plan to also examine how tau adds to a complex prognostication model with detailed clinical data (eg, motor function), neurophysiological data, and neuroimaging.
The main strengths of the study included the large sample size, and the prospective and blinded study design. Taken together, our results indicate that serum tau is a promising biomarker for prognosticating the severity of acute brain injury and potentially useful to predict poor outcome after cardiac arrest.
Author Contributions
Conception and design of the study: N.M., T.C., N.N., K.B., H.Z., C.R. Data acquisition and analysis: all authors. Drafting the manuscript and figures: N.M., T.C. All authors read, critically revised, and approved the final manuscript before submission.
Potential Conflicts of Interest
Nothing to report.
Supporting information
Additional supporting information can be found in the online version of this article.
Supporting Information 1
Acknowledgment
This study was supported by grants from the Swedish Research Council, Swedish Heart and Lung Foundation, Arbetsmarknadens Försäkringsaktiebolag Insurance Foundation, Skåne University Hospital Foundations, Gyllenstierna‐Krapperup Foundation, Swedish National Health System, County Council of Skåne, Swedish Society of Medicine, Koch Foundation, TrygFonden (Denmark), European Clinical Research Infrastructures Network, Thelma Zoega Foundation, Stig and Ragna Gorthon Foundation, Thure Carlsson Foundation, and Hans‐Gabriel and Alice Trolle‐Wachtmeister Foundation for Medical Research. K.B. is supported by grants by the Torsten Söderberg Foundation at the Royal Swedish Academy of Sciences.
References
- 1. Nolan JP, Ferrando P, Soar J, et al. Increasing survival after admission to UK critical care units following cardiopulmonary resuscitation. Crit Care 2016;20:219. [DOI] [PMC free article] [PubMed] [Google Scholar]
- 2. Nielsen N, Wetterslev J, Cronberg T, et al. Targeted temperature management at 33 °C versus 36 °C after cardiac arrest. N Engl J Med 2013;369:2197–2206. [DOI] [PubMed] [Google Scholar]
- 3. Rossetti AO, Rabinstein AA, Oddo M. Neurological prognostication of outcome in patients in coma after cardiac arrest. Lancet Neurol 2016;15:597–609. [DOI] [PubMed] [Google Scholar]
- 4. Solari D, Rossetti AO, Carteron L, et al. Early prediction of coma recovery after cardiac arrest with blinded pupillometry. Ann Neurol 2017;81:804–810. [DOI] [PubMed] [Google Scholar]
- 5. Horn J, Tjepkema‐Cloostermans MC. Somatosensory evoked potentials in patients with hypoxic‐ischemic brain injury. Semin Neurol 2017;37:60–65. [DOI] [PubMed] [Google Scholar]
- 6. Elmer J, Rittenberger JC, Faro J, et al. Clinically distinct electroencephalographic phenotypes of early myoclonus after cardiac arrest. Ann Neurol 2016;80:175–184. [DOI] [PMC free article] [PubMed] [Google Scholar]
- 7. Hahn DK, Geocadin RG, Greer DM. Quality of evidence in studies evaluating neuroimaging for neurologic prognostication in adult patients resuscitated from cardiac arrest. Resuscitation 2014;85:165–172. [DOI] [PubMed] [Google Scholar]
- 8. Westhall E, Rossetti AO, van Rootselaar A‐F, et al. Standardized EEG interpretation accurately predicts prognosis after cardiac arrest. Neurology 2016;86:1482–1490. [DOI] [PMC free article] [PubMed] [Google Scholar]
- 9. Stammet P. Blood biomarkers of hypoxic‐ischemic brain injury after cardiac arrest. Semin Neurol 2017;37:75–80. [DOI] [PubMed] [Google Scholar]
- 10. Stammet P, Collignon O, Hassager C, et al. Neuron‐specific enolase as a predictor of death or poor neurological outcome after out‐of‐hospital cardiac arrest and targeted temperature management at 33 °C and 36 °C. J Am Coll Cardiol 2015;65:2104–2114. [DOI] [PubMed] [Google Scholar]
- 11. Nolan JP, Soar J, Cariou A, et al. European Resuscitation Council and European Society of Intensive Care Medicine 2015 guidelines for post‐resuscitation care. Intensive Care Med 2015;41:2039–2056. [DOI] [PubMed] [Google Scholar]
- 12. Callaway CW, Donnino MW, Fink EL, et al. Part 8: Post‐cardiac arrest care: 2015 American Heart Association guidelines update for cardiopulmonary resuscitation and emergency cardiovascular care. Circulation 2015;132(18 suppl 2):S465–S482. [DOI] [PMC free article] [PubMed] [Google Scholar]
- 13. Ramont L, Thoannes H, Volondat A, et al. Effects of hemolysis and storage condition on neuron‐specific enolase (NSE) in cerebrospinal fluid and serum: implications in clinical practice. Clin Chem Lab Med 2005;43:1215–1217. [DOI] [PubMed] [Google Scholar]
- 14. Mattsson N. CSF biomarkers in neurodegenerative diseases. Clin Chem Lab Med 2011;49:345–352. [DOI] [PubMed] [Google Scholar]
- 15. Rosén C, Rosén H, Andreasson U, et al. Cerebrospinal fluid biomarkers in cardiac arrest survivors. Resuscitation 2014;85:227–232. [DOI] [PubMed] [Google Scholar]
- 16. Mörtberg E, Zetterberg H, Nordmark J, et al. Plasma tau protein in comatose patients after cardiac arrest treated with therapeutic hypothermia. Acta Anaesthesiol Scand 2011;55:1132–1138. [DOI] [PubMed] [Google Scholar]
- 17. Mattsson N, Zetterberg H, Janelidze S, et al. Plasma tau in Alzheimer disease. Neurology 2016;87:1827–1835. [DOI] [PMC free article] [PubMed] [Google Scholar]
- 18. Randall J, Mörtberg E, Provuncher GK, et al. Tau proteins in serum predict neurological outcome after hypoxic brain injury from cardiac arrest: results of a pilot study. Resuscitation 2013;84:351–356. [DOI] [PubMed] [Google Scholar]
- 19. Nielsen N, Wetterslev J, al‐Subaie N, et al. Target Temperature Management after out‐of‐hospital cardiac arrest—a randomized, parallel‐group, assessor‐blinded clinical trial—rationale and design. Am Heart J 2012;163:541–548. [DOI] [PubMed] [Google Scholar]
- 20. Dragancea I, Rundgren M, Englund E, et al. The influence of induced hypothermia and delayed prognostication on the mode of death after cardiac arrest. Resuscitation 2013;84:337–342. [DOI] [PubMed] [Google Scholar]
- 21. Bossuyt PM, Reitsma JB, Bruns DE, et al. Towards complete and accurate reporting of studies of diagnostic accuracy: the STARD initiative. Standards for Reporting of Diagnostic Accuracy. Clin Chem 2003;49:1–6. [DOI] [PubMed] [Google Scholar]
- 22. Burnham KP, Anderson DR. Model selection and multimodel inference. Available at: http://www.springer.com/us/book/9780387953649. Accessed April 12, 2017.
- 23. Hajian‐Tilaki K. Sample size estimation in diagnostic test studies of biomedical informatics. J Biomed Inform 2014;48:193–204. [DOI] [PubMed] [Google Scholar]
- 24. Geurts M, Macleod MR, van Thiel GJMW, et al. End‐of‐life decisions in patients with severe acute brain injury. Lancet Neurol 2014;13:515–524. [DOI] [PubMed] [Google Scholar]
- 25. Sandroni C, Cavallaro F, Callaway CW, et al. Predictors of poor neurological outcome in adult comatose survivors of cardiac arrest: a systematic review and meta‐analysis. Part 1: Patients not treated with therapeutic hypothermia. Resuscitation 2013;84:1310–1323. [DOI] [PubMed] [Google Scholar]
- 26. Sandroni C, Cavallaro F, Callaway CW, et al. Predictors of poor neurological outcome in adult comatose survivors of cardiac arrest: a systematic review and meta‐analysis. Part 2: Patients treated with therapeutic hypothermia. Resuscitation 2013;84:1324–1338. [DOI] [PubMed] [Google Scholar]
- 27. Dragancea I, Wise MP, Al‐Subaie N, et al. Protocol‐driven neurological prognostication and withdrawal of life‐sustaining therapy after cardiac arrest and targeted temperature management. Resuscitation 2017;117:50–57. [DOI] [PubMed] [Google Scholar]
- 28. Wiberg S, Hassager C, Stammet P, et al. Single versus serial measurements of neuron‐specific enolase and prediction of poor neurological outcome in persistently unconscious patients after out‐of‐hospital cardiac arrest: a TTM‐trial substudy. PLoS One 2017;12:e0168894. [DOI] [PMC free article] [PubMed] [Google Scholar]
- 29. Vondrakova D, Kruger A, Janotka M, et al. Association of neuron‐specific enolase values with outcomes in cardiac arrest survivors is dependent on the time of sample collection. Crit Care 2017;21:172. [DOI] [PMC free article] [PubMed] [Google Scholar]
Associated Data
This section collects any data citations, data availability statements, or supplementary materials included in this article.
Supplementary Materials
Additional supporting information can be found in the online version of this article.
Supporting Information 1