

Abstract
Objective
Mutations in ABCD1 cause the neurodegenerative disease, adrenoleukodystrophy, which manifests as the spinal cord axonopathy adrenomyeloneuropathy (AMN) in nearly all males surviving into adulthood. Microglial dysfunction has long been implicated in pathogenesis of brain disease, but its role in the spinal cord is unclear.
Methods
We assessed spinal cord microglia in humans and mice with AMN and investigated the role of ABCD1 in microglial activity toward neuronal phagocytosis in cell culture. Because mutations in ABCD1 lead to incorporation of very‐long‐chain fatty acids into phospholipids, we separately examined the effects of lysophosphatidylcholine (LPC) upon microglia.
Results
Within the spinal cord of humans and mice with AMN, upregulation of several phagocytosis‐related markers, such as MFGE8 and TREM2, precedes complement activation and synapse loss. Unexpectedly, this occurs in the absence of overt inflammation. LPC C26:0 added to ABCD1‐deficient microglia in culture further enhances MFGE8 expression, aggravates phagocytosis, and leads to neuronal injury. Furthermore, exposure to a MFGE8‐blocking antibody reduces phagocytic activity.
Interpretation
Spinal cord microglia lacking ABCD1 are primed for phagocytosis, affecting neurons within an altered metabolic milieu. Blocking phagocytosis or specific phagocytic receptors may alleviate synapse loss and axonal degeneration. Ann Neurol 2017;82:813–827
X‐linked adrenoleukodystrophy (X‐ALD) is caused by mutations in ABCD1, a gene that encodes the peroxisomal half‐transporter adenosine triphosphate‐binding cassette domain I (ABCD1).1, 2 The most severe form of X‐ALD, childhood cerebral ALD (CALD), manifests as acute demyelination in childhood with prominent lymphocytic infiltration and a distinct zone of microglial cell death surrounding the inflammatory lesion.3, 4 The more common phenotype is adrenomyeloneuropathy (AMN), an axonopathy of the spinal cord with notable absence of inflammatory lesions or lymphocytic infiltration, but numerous microglia and macrophages. There is no genotype‐phenotype correlation, and the two distinct neurological phenotypes frequently exist within the same family. All male patients who survive into adulthood manifest some degree of axonopathy, making AMN the default manifestation of ABCD1 dysfunction.
Mutations in ABCD1 result in the accumulation of unbranched saturated very‐long‐chain fatty acids (VLCFAs) in body fluid and tissues,5, 6, 7 and the highest concentrations of VLCFAs reside within lysophosphatidylcholine (LPC).8 High‐dose LPC injections lead to brain demyelination in mice, but the impact of LPC upon axonal degeneration and AMN pathogenesis has not been studied.4 Notably, levels of VLCFA in plasma do not correlate with phenotype or severity, and attempts at lowering VLCFA have so far shown no effect upon AMN progression.
These discrepancies may be resolved by a closer examination of the cellular constituents of pathology in relation to ABCD1 gene expression. ABCD1 is not uniformly expressed across different cell types.9 How can axons be affected when ABCD1 is only expressed in neurons at very low levels?9 Microglia have recently been implicated as potential cellular mediators of synapse loss.10 Specific transcriptional and functional alterations of microglia vary in each neurological disease depending on pathology and type of molecular stimuli encountered.11 Given that ABCD1 is highly expressed in microglia, it is possible that microglial dysfunction in its close interaction with other cell types actively participates in the neurodegenerative process.
Importantly, ABCD1 deficiency in mice also leads to axonal degeneration, resembling findings in AMN patients.12 In AMN mice, previous studies have noted that microglial activation coincides with noninflammatory axonal degeneration13, 14; similar observations have been made in human AMN spinal cord.12 Despite these findings, no detailed studies on the molecular and functional change of microglia in the absence of ABCD1 have been conducted, and the impact of microglia upon long‐tract degeneration remains unclear. The aim of the present study was to systematically define microglia in human and mouse spinal cord and further explore dysfunction of ABCD1‐deficient microglia both in vivo and in vitro.
Materials and Methods
Animals
Wild‐type (WT) C57BL/6 and congenic C57BL/6 Abcd1–/– mice were obtained from The Jackson Laboratory (Bar Harbor, ME). Abcd1–/– mice were back‐crossed onto a pure C57/B6 background over six generations. They were then bred from homozygous founders and occasionally genotyped. Mice were fed a standard diet and maintained under a 12‐hour light‐dark cycle. Only male mice were used for the experiments.
Mouse Tissue Preparation
Mice were anesthetized by isoflurane and sacrificed by transcardial perfusion of phosphate‐buffered saline (PBS). Brain and spinal cord were immediately dissected and snap‐frozen. Parts of tissues were fixed by 4% paraformaldehyde (PFA) and equilibrated in 30% sucrose before slicing.
Primary Neonatal Microglial Cultures and N9 Microglia Culture
Microglia cultures were prepared as previously described.15 Briefly, mixed glial cultures (∼95% astrocytes, ∼5% microglia) were prepared from the brain tissue of 1‐ to 3‐day‐old mice. The tissue was trypsinized with 0.05% trypsin, and cells were resuspended in glia complete medium Dulbecco's modified Eagle's medium (DMEM; Lonza Biologics Inc, Portsmouth, NH) supplemented with 10% fetal bovine serum (FBS), 100IU/ml of penicillin, 100 μg/ml of streptomycin, and 2mM of l‐glutamine. After 10 to 14 days in culture, microglia were isolated from the mixed glial cultures by the shake‐off procedure. Specifically, loosely attached microglia were obtained from an incubator shaker at 250rpm for 2 hours at 37 °C, then the cell‐containing medium was centrifuged at 1,100rpm for 3 minutes to collect microglia for subsequent culture. N9 microglia cells were cultured in RPMI 1640 medium supplemented with 10% FBS.
Differentiated Neuronal Culture
Immortalized hNPC cell line ReNcell VM (ReN) was used to differentiate into neurons per published protocol.16 Simply, ReN cells were grown in proliferation medium (DMEM/F12; Gibco/Life Technologies, Grand Island, NY) with 2 µg/ml of heparin (stock; STEMCELL Technologies, Cambridge, MA), 2% B27 (Life Technologies, Carlsbad, CA), 20ng/ml of epidermal growth factor (EGF), 20ng/ml of basic fibroblast growth factor, and 1% of 100 × penicillin/streptomycin (Gibco/Life Technologies) until confluency. For differentiation, 3 × 10⁴ cells were seeded on Matrigel‐coated (1:100 dilution in DMEM/F12) eight‐well chamber slides and grown in differentiation medium (DMEM/F12; Gibco/Life Technologies) with 2 µg/ml of heparin (stock; STEMCELL Technologies), 2% B27 (Life Technologies), and 1% of 100 × penicillin/streptomycin (Gibco/Life Technologies) for 2 to 3 weeks before coculture with microglia.
Cocultures and VLCFA Supplementation
For the coculture of microglia and neurons, isolated microglia were seeded on top of differentiated neurons and cocultured in differentiated medium for 4 days with or without supplementation of VLCFA. For VLCFA supplementation, hexacosanoic acid (free fatty acid [FFA] C26:0) and lysophosphatidylcholine (LPC) C16:0 and C26:0 (Avanti Polar Lipids, Inc., Alabaster, AL) were solubilized in 50mg/ml of methyl‐β‐cyclodextrin to make 3mM of stock solution and then supplemented into culture medium to reach designated concentration with methyl‐β‐cyclodextrin as vehicle control. After coculture for 4 days, cells were fixed in PFA and immunostained with beta‐III‐tubulin (Tuj1), which is a β‐tubulin family structural protein expressed in neurons, and ionizing calcium‐binding adaptor molecule 1 (IBA1) that marks microglia. MFGE8 blocking antibody (R&D Systems, Minneapolis, MN) or control immunoglobulin G (IgG; R&D Systems) were added to the coculture to assess the function of MFGE8. Tuj1 immunofluorescence and degenerated axons were quantified in each group.
Microglial Phagocytosis Assay
Microglia were seeded in an eight‐well chamber (7 × 10⁴/well in complete medium) and cultured for 24 hours. SH‐SY5Y cells were treated with 100 μM of H2O2 for 12 hours to induce phosphatidylserine (PS) exposure on the cell surface. Floating SH‐SY5Y cells were then collected by centrifuge at 1,000rpm for 3 minutes, resuspended in serum‐free medium, and stained with 3 µM of fluorescent probe CMTPX (red; 1:1,000 dilution; Life Science Technologies) for 30 minutes. A portion of the floating cells was subjected to Annexin V/FITC (fluorescein isothiocyanate) staining to confirm the exposure of PS. The remnant was washed twice and seeded (same amount as microglia) on top of the microglial layer. After a 4‐hour coculture, cells were washed with PBS and fixed with 4% PFA for 15 minutes at room temperature. Microglia were then stained with IBA1 antibody (Wako Chemicals USA, Inc., Richmond, VA) overnight followed by Alexa Fluor‐488–conjugated second antibody. For quantification, five random images were taken from each chamber well using a confocal microscope (Carl Zeiss, Jena, Germany). The total number of phagocytosed particles as well as cell‐sized particles was counted and divided by microglia cell number. To validate the function of MFGE8, microglia were pretreated with recombinant MFGE8 (50ng/ml; R&D Systems) or MFGE8 blocking antibody for 12 hours and then the phagocytosis assay was performed as listed above.
Western Blotting
Tissue and cell lysates were prepared using radioimmunoprecipitation assay buffer (Sigma‐Aldrich, St. Louis, MO) with 1% Halt Protease and Phosphatase Inhibitor Cocktail (Roche, Indianapolis, IN). Protein samples were separated on NuPAGE 4% to 12% Bis‐tris gels (Life Science Technologies) and transferred onto polyvinylidene difluoride membranes (Millipore, Billerica, MA). Membranes were blocked with 5% nonfat milk in PBS containing 0.05% Tween 20 and probed with antibodies against inducible nitric oxide synthase (iNOS), cyclooxygenase 2 (Cox2; Santa Cruz Biotechnology, Santa Cruz, CA), ABCD1, C1q, postsynaptic density protein 95 (PSD95), and CD11b (Abcam, Cambridge, MA), synaptophysin (Cell Signaling Technology, Danvers, MA), MFGE8 (MBL International Corporation, Woburn, MA), IBA1 (Wako Chemicals USA, Inc.), beta‐actin or glyceraldehyde‐3‐phosphate dehydrogenase (Santa Cruz Biotechnology) were used as protein loading control. Membranes were developed with SuperSignal West Pico Chemiluminescent Substrate (Thermo Fisher Scientific, Waltham, MA) after incubation with horseradish peroxidase–conjugated secondary antibodies. Antibodies that differed in human specimen included anti‐human MFGE8 (Sigma‐Aldrich) and anti‐human ABCD1 (Origene, Rockville, MD).
Quantitative Real‐Time Reverse Transcription PCR
Total RNA from cells or tissues were isolated using the Qiagen RNeasy Mini Kit (Qiagen). First‐strand complementary DNA synthesis used 100ng of random primer (Life Technologies), 1.0 µg of total RNA, 10 mM of deoxynucleotide, and 200 units of reverse transcriptase (Life Technologies) per 20 µl reactions. PCRs were performed in duplicates in a 25 µl final volume by using SYBR Green master mix from Applied Biosystems (Life Technologies). The data were analyzed by calculating the delta threshold cycle value between the tested gene and an internal control.
Immunofluorescence Staining and Confocal Microscopy Imaging
Spinal cord sections (14‐µm) were cut at –25 °C using cryostat (Leica Microsystems, Wetzlar, Germany) and permeabilized in blocking buffer containing 0.3% Triton X and 2% goat serum for 1 hour. Sections were then stained with IBA1 (Wako Chemicals USA, Inc.), CD68 (Bio‐Rad for mouse and Abcam for human; Bio‐Rad Laboratories, Hercules, CA), synaptophysin (Sigma‐Aldrich), C1q and von Willebrand factor (VWF) (Abcam), Fibrinogen (Millipore), Neurofilament (NF) (BioLegend, Dedham, MA), and neuronal nuclei (NeuN) (Abcam) antibodies, respectively.
Enzyme‐Linked Immunosorbent Assay
MFGE8, tumor necrosis factor alpha (TNFα) and interleukin (IL) 1β level in culture medium and spinal cord homogenate were measured using an MFGE8, IL1β, and TNFα enzyme‐linked immunosorbent assay (ELISA) kit (R&D Systems) according to the manufacturer's instructions.
Human Spinal Cord Specimen
Human tissue study was performed on postmortem spinal cord tissue from 13 adult ALD cases (8 AMN cases, 5 cerebral ALD [c‐ALD] only, and 9 control cases obtained from NIH NeuroBioBank). Use of this material was approved by the Institutional Review Board of Massachusetts General Hospital (Boston, MA).
Statistical Analysis
Results were expressed as means ± standard error of the mean (SEM) and analyzed for statistical significance by analysis of variance followed by Fisher's protected least‐significant difference based on two‐side comparisons among experimental groups using an SPSS program (SPSS, Inc., Chicago, IL). A value of p < 0.05 was considered statistically significant.
Results
In the Spinal Cord of Aging Abcd1–/– Mice, Microglial Activation Precedes Synapse Loss
Abcd1–/– mice develop an AMN‐like phenotype at an advanced age.17 Synapse loss has long been considered an integral aspect of neurodegeneration. Hence, we set out to examine the time course of axon degeneration and microglial activation in spinal cord.14 We found that as early as 8 months before synapse loss, spinal cord microglia of Abcd1–/– mice display an enlarged soma and upregulated CD68 expression (Fig 1). This activation of Abcd1–/– microglia coincided with them enveloping synapses and axons (Fig 2F,H), active synaptic pruning, and reduced presynaptic synaptophysin (SYP) and postsynaptic PSD95 (Fig 2). These data suggest that microglia are actively contributing to axonal degeneration. Importantly, vessel walls were intact and no significant monocytic activation was observed around the vessel, suggesting that innate immune activation in AMN mice is largely attributed to resident microglia alone (Fig 1I).
Figure 1.
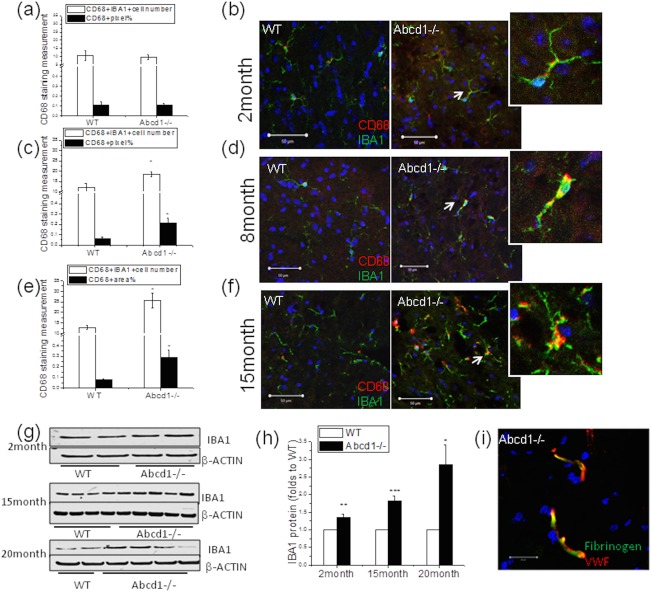
Expression level of microglia activation marker at different ages in Abcd1–/– mouse spinal cord. (A,B) In 2‐month‐old mouse spinal cord, resident microglia were quiescent with thin processes, whereas no significant change of CD68 expression in IBA1‐positive microglia was detected, indicating a lack of microglia activation at this stage (n = 4). (C,D) In 8‐month‐old Abcd1–/– mouse spinal cord, microglia had relatively increased soma size and upregulated CD68 expression compared to wild type, indicating microglial activation (n = 6). (E,F) In 15‐month‐old Abcd1–/– mouse spinal cord, microglia had enlarged soma size as well as thick and bushy processes (see magnification, white arrow). Significant increases of CD68 in IBA1+ microglia were also detected (n = 8). Bar = 50 µm. CD68+ pixels and CD68+IBA1+ cell number were quantified by ImageJ (NIH, Bethesda, MD). (G) Representative western blot shows IBA1 expression in spinal cord across different ages and (H) IBA1 protein quantification using ImageJ with β‐actin as a loading control. (I) Fibrinogen was confined in vessels in Abcd1–/– mouse spinal cord, further confirming the intactness between spinal cord and blood barrier. Bar = 50 µm. Data are expressed as mean ± SEM; *p < 0.05; **p < 0.01; ***p < 0.001. IBA1 = ionizing calcium‐binding adaptor molecule 1; VWF = von Willebrand factor; SEM = standard error of the mean; WT = wild type.
Figure 2.
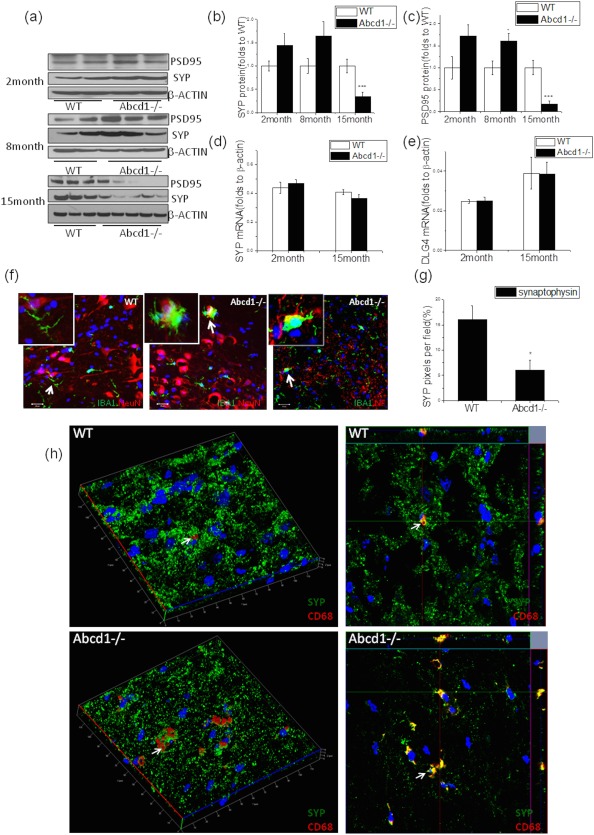
The presence of synapse loss, a marker of axon degeneration at different ages in Abcd1–/– mice spinal cord. (A) Representative western blot showed presynaptic synaptophysin (SYP) and postsynaptic PSD95 expression in Abcd1–/– spinal cord across different ages and (B) synaptophysin as well as (C) PSD95 protein quantification using ImageJ (NIH, Bethesda, MD) with β‐actin as loading control (n = 4 at 2 months, n = 5 at 8 months, and n = 12 at 15 months). (D) Synaptophysin (SYP) and (E) PSD95 (DLG4) gene expression in Abcd1–/– spinal cord at different ages (n = 4 at 2 months and n = 12 at 15 months). (F) Costaining of IBA1 (green) and NeuN (red) as well as neurofilament (NF; red) shows activated microglia surrounding neurons and neurites in 15‐month‐old Abcd1–/– mouse spinal cord. (G) Immunofluorescence quantification of synaptophysin pixels in 15‐month‐old spinal cord using ImageJ (n = 7). (H) Three‐dimensional confocal images show microglia (CD68 red) engulfing synapses (synaptophysin green) in 15‐month‐old mouse spinal cord (indicated by white arrow). In wild‐type spinal cord, more punctate synaptophysin staining is present compared to the Abcd1–/– spinal cord where synapse loss occurs. Data are expressed as mean ± SEM; *p < 0.05; ***p < 0.001. DLG4 = disks large homolog 4; IBA1 = ionizing calcium‐binding adaptor molecule 1; PSD95 = postsynaptic density protein 95; NeuN = neuronal nuclei; SEM = standard error of the mean; WT = wild type.
Abcd1–/– Mouse Spinal Cord Displays a Lack of Proinflammatory Markers but Increase in Phagocytosis‐Related Molecule Expression
To determine whether inflammation is involved in AMN disease progression, we measured several proinflammatory biomarkers that are usually upregulated during inflammation. At both 2 and 15 months, no significant changes in expression of proinflammatory genes and proteins were detected in Abcd1–/– mouse spinal cord (Fig 3A–C). Next, we set out to determine the expression of several key receptors and signaling molecules for phagocytosis.
Figure 3.
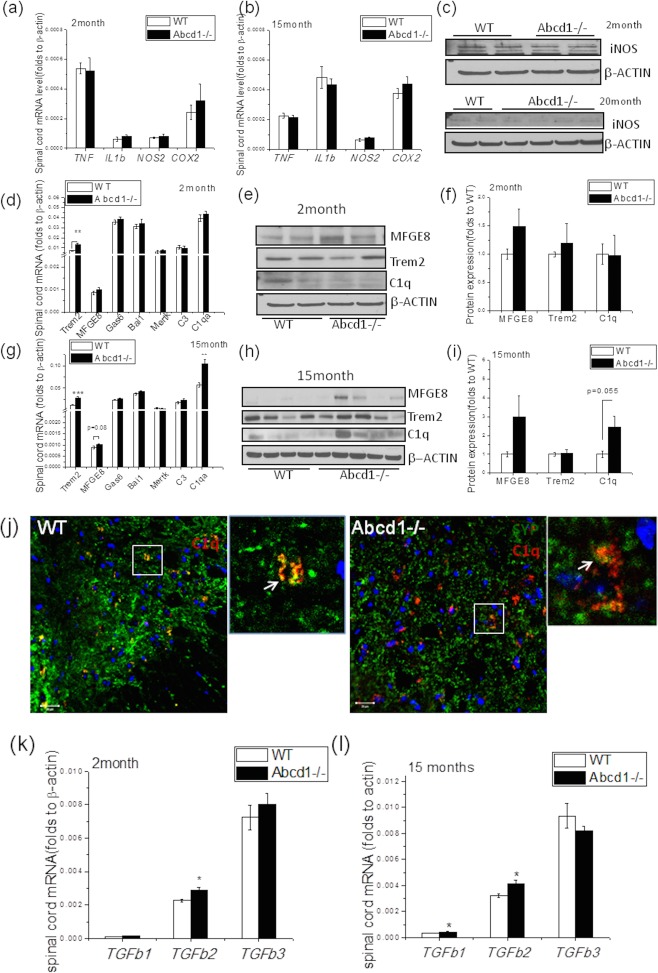
Unaltered proinflammatory gene profile, but increased phagocytosis‐related gene expression, in spinal cord of Abcd1–/– mice at different ages. (A) Expression of proinflammatory genes including TNF, IL1b, NOS2, and Cox2 in spinal cord of 2‐month‐old wild‐type and Abcd1–/– mice (n = 4). (B) The expression of proinflammatory genes including TNF, IL1b, NOS2, and Cox2 in spinal cord of 15‐month‐old wild‐type and Abcd1–/– mice (n = 5). (C) Western blot analysis of iNOS expression in 2‐ (n = 4) and 20‐month‐old (n = 4) spinal cord. (D) Phagocytosis‐related genes expression including Trem2, MFGE8, Gas6, Bai1, C1qa, and C3 in spinal cord of 2‐month‐old wild‐type and Abcd1–/– mice (n = 4). (E) Representative western blot images show protein expression of MFGE8 and Trem2 in 2‐month‐old mouse spinal cord. (F) Quantification of protein expression in 2‐month‐old mouse spinal cord with β‐actin as loading control (n = 4). (G) Phagocytosis‐related gene expression including Trem2, MFGE8, Gas6, Bai1, C1qa, and C3 in spinal cord of 15‐month‐old wild‐type and Abcd1–/– mice (n = 9–12). (H) Representative western blot image shows protein expression of MFGE8, Trem2, and C1q in 15‐month‐old mouse spinal cord. (I) Quantification of protein expression in 15‐month‐old mouse spinal cord with β‐actin as loading control (n = 12). (J) Consistent with complement activation, we found colocalization of synaptophysin (green) and C1q (red; see magnification, white arrow). Bar = 20 µm. (K,L) TGFb family gene expression in wild‐type and Abcd1–/– spinal cord at 2 and 15 months of age (n = 12). Data are expressed as mean ± SEM; *p < 0.05; **p < 0.01. iNOS = inducible nitric acid synthase; SEM = standard error of the mean; WT = wild type.
To our surprise, there was a significant increase of Trem2 gene expression (as well as minor, but not significant, increases in C1qa, MFGE8, Gas6, and Bai1) in spinal cord of young 2‐month‐old Abcd1–/– mice (Fig 3D–F). By 15 months of age, a remarkable upregulation of Trem2, C1qa, and MFGE8 mRNA was evident (Fig 3G; p < 0.05), coinciding with prominent C1q and MFGE8 protein upregulation (Fig 3H,I). Costaining of synaptophysin and C1q at different ages showed frequent colocalization suggesting a role of C1q in synaptic pruning and axonal degeneration (Fig 3J). Interestingly, the transforming growth factor beta (TGFb) family of genes, especially TGFb2, that is known to regulate C1q and MFGE8, showed significant upregulation at both 2 and 15 months (Fig 3K,I).
In Vitro, ABCD1‐Deficient Microglia Lack an Inflammatory Profile but Increase Phagocytosis of PS Exposing Neurons
To learn whether microglial changes observed in vivo were primary or secondary to axon degeneration, we isolated microglia from postnatal mice and assessed molecular changes in unstimulated conditions as well as after lipopolysaccharide (LPS) challenge. In a quiescent state, the expression of several major proinflammatory biomarkers, including IL1β, TNF, NOS2, and Cox2, were very low in Abcd1–/– mice. However, an LPS challenge (1 μg/ml) led to a significant upregulation in mRNA of IL1β, NOS2, and Cox2 compared to WT, suggesting that microglia in Abcd1–/– mice are primed to respond to stimuli (Fig 4A). Higher IBA1 and CD11b expression was detected in both quiescent and LPS‐challenged states (Fig 4B).
Figure 4.
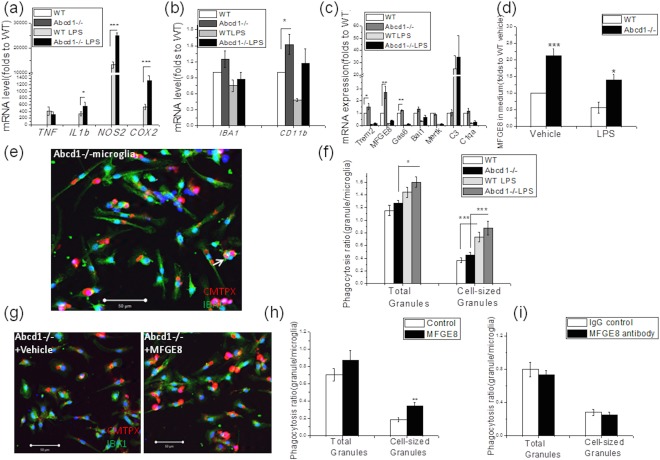
Abcd1–/– microglia lack an inflammatory profile, but displayed increased phagocytosis of phosphatidylserine (PS) exposing apoptotic neurons. (A) Proinflammatory genes including IL1b, TNF, NOS2, and Cox2 did not show distinct alterations between wild‐type and Abcd1–/– microglia at basal level, whereas lipopolysaccharide (LPS) treatment for 6 hours dramatically increased expression of these genes in both wild‐type and Abcd1–/– microglia with a greater response from Abcd1–/– cells. (B) The microglial markers, IBA1 and CD11b, showed some increased expression at basal level. (C) Phagocytosis‐related genes including Trem2, MFGE8, Gas6, and Bai1, but not C3 and C1qa, were upregulated in Abcd1–/– mouse microglia at both unstimulated and LPS‐challenged conditions, with MFGE8 showing the most significant increase. LPS challenge decreased the phagocytosis‐related genes except for C3. (D) ELISA of microglia culture medium confirmed higher MFGE8 expression in Abcd1–/– microglia at both basal and LPS‐treated conditions. (E) Representative images show Abcd1–/– microglial (green) phagocytosis of PS‐exposed SH‐Sy5y neurons (CMTPX labeled red, indicated by white arrow). (F) Quantification of red granules within IBA1‐stained microglia (green) shows a trend to increased phagocytosis of PS exposing SH‐SY5Y neuron in Abcd1–/– microglia at both basal and LPS‐stimulated conditions. (G,H) Supplementation of recombinant MFGE8 dramatically increased Abcd1–/– microglial phagocytosis of PS exposing neurons. (I) MFGE8 blocking antibody treatment reduced Abcd1–/– microglia phagocytosis of PS exposing neurons. Bar = 50 µm. Data were expressed as mean ± SEM; *p < 0.05; **p < 0.01; ***p < 0.001. ELISA = enzyme‐linked immunosorbent assay; IBA1 = ionizing calcium‐binding adaptor molecule 1; IgG = immunoglobulin G; SEM = standard error of the mean; WT = wild type.
After observing an unexpected increase of phagocytosis‐related biomarkers at tissue level, we wondered whether gene expression of these markers would be altered in vitro as well. Indeed, we found significantly higher levels of Bai1, Gas6, MFGE8, and Trem2 in Abcd1–/– microglia, with MFGE8 displaying a 3‐fold increase (Fig 4C; p < 0.05). An ELISA assay detected 2‐fold higher MFGE8 protein secretion into media by Abcd1–/– microglia (Fig 4D; p < 0.05). During classical microglial activation, LPS can significantly reduce MFGE8 expression (Fig 4C,D) while increasing phagocytic activity (Fig 4F). This is consistent with other past reports performed under WT conditions.18, 19, 20
As a bridging protein, MFGE8 tightly binds to exposed PS on surface membranes of stressed neurons and opsonizes them for phagocytosis. Indeed, in coculture we found that Abcd1–/– microglia increased phagocytosis of PS‐exposing neurons in both unstimulated and LPS‐challenged conditions (Fig 4E,F). To validate the impact of MFGE8, we pretreated primary microglia from Abcd1–/– mice with either MFGE8 (50ng/ml) or MFGE8 antibody for 12 hours and then assessed phagocytosis. We found a significant increase in phagocytosis in MFGE8‐treated microglia (Fig 4G,H; p < 0.05), whereas exposure to MFGE8 antibody reduced phagocytic capacity (Fig 4I). These data suggest that genetic ablation of ABCD1 leads to increased secretion of MFGE8 by microglia and thereby contributes to phagocytosis of stressed neurons.
LPC C26:0 Treatment Exposes PS on the Neuronal Cell Surface
The most significant biochemical change caused by ABCD1 mutations is increased VLCFA levels including free fatty acid and LPC (in particular, C24:0 and C26:0) in plasma and tissues. To determine whether neurons exposed to high VLCFA levels have PS exposure on their surfaces, we treated neurons differentiated from ReN cells with both C26:0 free fatty acid (FFA C26:0) and LPC C26:0 and then determined PS exposure by Annexin V/FITC binding. FFA C26:0 treatment for 3 days at either 10 µM or 20 µM did not induce significant PS exposure on the cell surface (Fig 5A,C). However, there was a remarkable dose‐dependent PS exposure after LPC C26:0 treatment at both 10 µM and 20 µM. Further staining with cleaved caspase 3 did not reveal a notable positive signal with either FFA C26:0 or LPC C26:0 treatment (Fig 5B). In addition, the neuronal marker, Tuj1, did not show significant morphological changes (Fig 5B), suggesting that neurons were still alive after LPC C26:0 treatment despite PS exposure.
Figure 5.
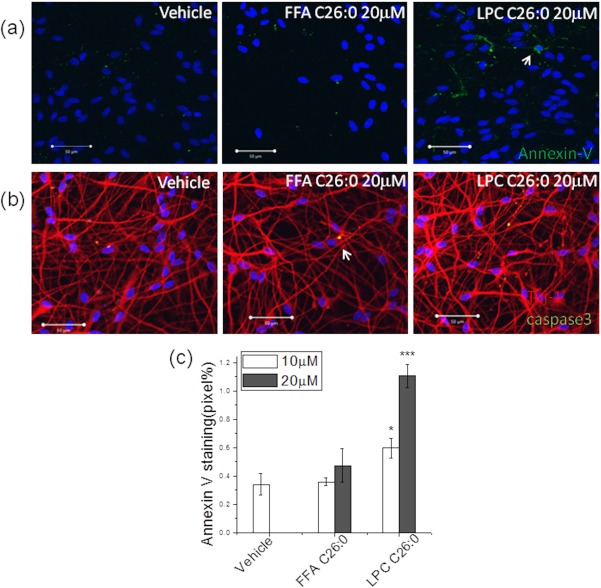
Lysophosphosphatidylcholine (LPC) C26:0 treatment induced phosphatidylserine (PS) exposure. (A) Annexin V staining showed exposure of phosphatidylserine (PS) on the outer cell membrane of differentiated ReN (neuron cells) after 20 μM LPC C26:0 treatment (B) Tuj1, and cleaved‐caspase staining showed little late apoptosis (indicated by white arrow) after LPC C26:0 treatments. (C) Quantification of Annexin V/FITC fluorescence using ImageJ (NIH, Bethesda, MD). Data are expressed as mean ± SEM; *p < 0.05; ***p < 0.001. FFA = free fatty acid; SEM = standard error of the mean.
LPC C26:0 Enhances MFGE8 Expression in Microglia
To examine whether VLCFA has any effect on MFGE8 expression, we first treated microglial cell lines (N9) with 30 μM of FFA C26:0, LPC C16:0, and LPC C26:0 separately for 3 days. LPC C26:0 significantly increased MFGE8 mRNA expression whereas FFA C26:0 and LPC C16:0 did not have an effect (Fig 6A). Finally, we also treated primary isolated microglia from both WT and Abcd1–/– mice with 15 μM of LPC C26:0 and found significant increase of MFGE8 expression at both mRNA (Fig 6B; p < 0.05) and protein level (Fig 6C; p < 0.05).
Figure 6.
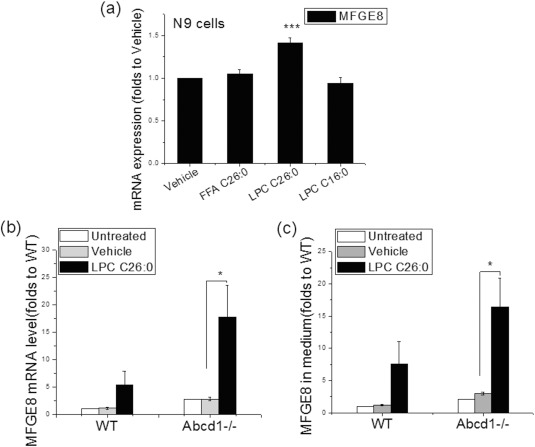
LPC C26:0 enhanced MFGE8 expression in Abcd1–/– microglia. (A) Effect of free fatty acid (FFA) C26:0 (30 μM) and LPC C26:0 (30 μM) and LPC C16:0 (30 μM) on MFGE8 gene expression in wild‐type N9 microglia. (B) Effect of 15 μM LPC C26:0 treatment on MFGE8 gene expression in primary isolated microglia from wild‐type and Abcd1–/– mice. MFGE8 expression is compared to untreated wild‐type primary microglia as Abcd1–/– microglia have higher levels of MFGE8 at baseline (see Fig 4C). (C) Effect of 15 μM LPC C26:0 treatment on MFGE8 protein secretion in primary isolated microglia from wild‐type and Abcd1–/– mice. Data are expressed as mean ± SEM; *p < 0.05; **p < 0.01; ***P < 0.001. SEM = standard error of the mean; WT = wild type.
In the Presence of ABCD1‐Deficient Microglia LPC C26:0 Mediates Damage to Neurons
To assess whether Abcd1–/– microglia have a direct impact on neurite growth, we isolated microglia from WT and Abcd1–/– mice and then cocultured them with differentiated neurons for 4 days. In this coculture, we found no change in neurite density and morphology, suggesting that Abcd1–/– microglia alone have no direct impact on neurite growth in vitro (Fig 7A,B). However, when 15 μM of LPC C26:0 was supplied, it decreased Tuj1 expression by 20%, implying damage to the neuron in the coculture system (Fig 7C,D), and treatment with MFGE8 antibody (MFGE8 Ab) in the coculture system slightly alleviated the adverse impact (Fig 7D). Higher magnification images show microglia phagocytosing neurons in the LPC C26:0 supplemented coculture system (Fig 7E), with degenerated axons frequently observed (Fig 7F). Quantification data suggested increased axon degeneration after LPC C26:0 supplementation in the coculture system whereas MFGE8 antibody treatment exhibited a protective effect on axon degeneration (Fig 7G).
Figure 7.
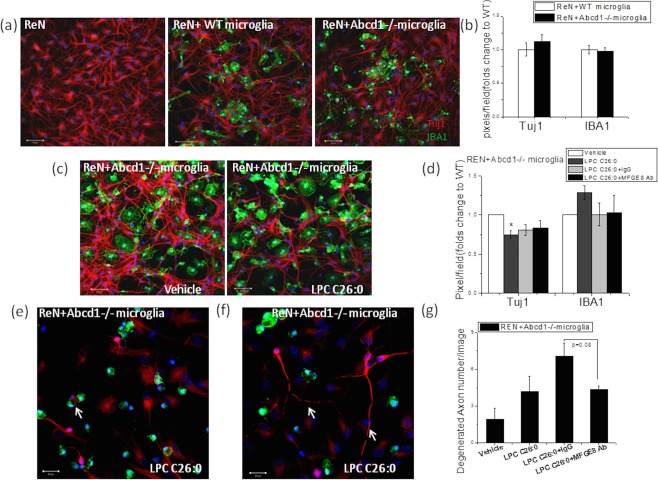
LPC C26:0 treatment caused neuronal damage in the coculture system with Abcd1–/– microglia. (A) Representative images show cocultured differentiated neuron with wild‐type and Abcd1–/– microglia under normal condition. (B) ImageJ (NIH, Bethesda, MD) quantification of Tuj1 (neuron) and IBA1 (microglia) after coculture of differentiated neurons and primary microglia for 4 days. (C,D) Effect of 15 μM of LPC C26:0 on Tuj1 expression of differentiated ReN cells in the coculture system with primary Abcd1–/– microglia and the impact of MFGE8 antibody supplementation. Bar = 50 µm. (E) Representative image shows microglia (green) phagocytosing neurons (red) and (F) degenerated axons within coculture system with LPC C26:0 supplementation (white arrow). Bar = 50 µm. (G) Quantification of degenerated axons in the coculture system. Data are expressed as mean ± SEM; *p < 0.05. IBA1 = ionizing calcium‐binding adaptor molecule 1; SEM = standard error of the mean; Tuj1 = beta‐III‐tubulin; WT = wild type.
Human AMN Spinal Cord Displays Microglia Activation and Increased Expression of Phagocytosis‐Related Markers and Synaptic Dysfunction
To determine whether our observation in AMN mice were applicable to humans, spinal cord tissue from a pure AMN case encompassing the corticospinal tract and dorsal columns was examined. Luxol fast blue (LFB) staining showed reduced myelin staining in the dorsal column of AMN spinal cord, demonstrating mild myelin loss commensurate with axonal loss (Fig 8A). Dramatic increase of CD68 and IBA1 staining in AMN spinal cord was also observed compared to the control group (Fig 8B), suggesting activation of microglia in the spinal cord of AMN. As a next step, we analyzed spinal cord from another 13 postmortem adult ALD tissues (Fig 8). Initial analysis was performed separately for patients who, by history, were thought to have cerebral ALD alone versus cerebral ALD plus AMN (data not shown). Because the ALD spinal cord showed no significant differences between one another and all male patients in adulthood manifest some degree of AMN, data were grouped and displayed as adult ALD only. As in mice, all human ALD spinal cord tissue displayed no cell death, but a dramatic increase in microglial activation in spinal cord of AMN (Fig 8). Gene profiling showed significantly increased microglia activation markers (IBA1 and CD68) and phagocytosis markers (MFGE8 and C1qa) in the absence of a proinflammatory profile. Significant reduction in SYP gene expression indicated synaptic dysfunction in ALD spinal cord. In contrast to mice, some human ALD spinal cord showed perivascular macrophages (thick arrow in Fig 8B) with significant increases in Ccl2 and Ccr2 (Fig 8C), indicating infiltration of monocytes.
Figure 8.
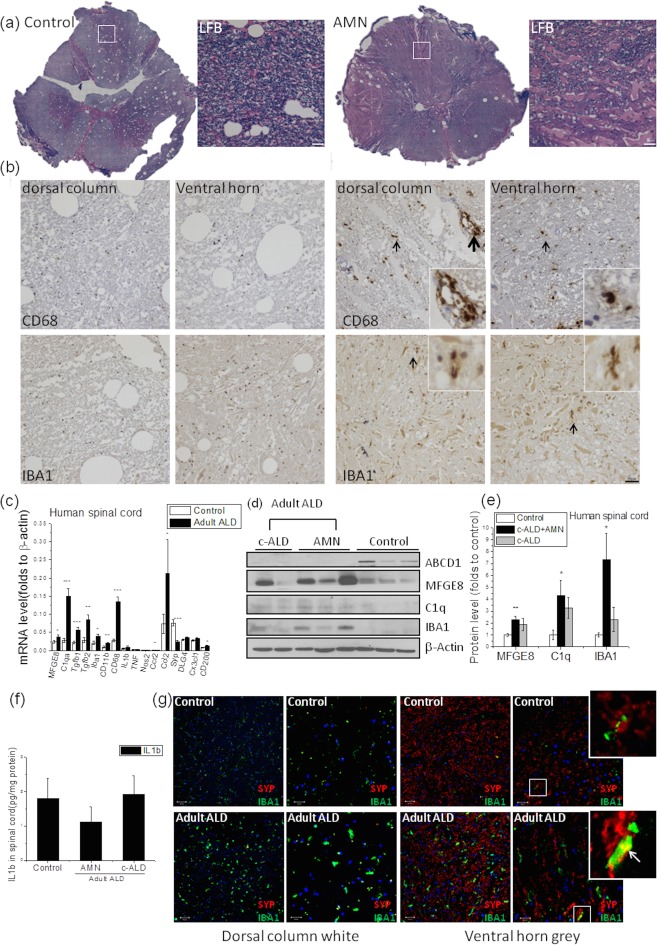
Microglial activation and phagocytosis in human AMN spinal cord despite unaltered proinflammatory gene expression. (A) LFB staining demonstrates mild myelin loss commensurate with axonal loss. (B) Increased CD68 and IBA1 (black arrow) expression indicate microglia activation in spinal cord. Some perivascular macrophages (thick black arrow) are visible in the amplified insert. Bar = 50 µm. (C) Gene expression of microglia activation (CD68, IBA1), phagocytosis (MFGE8, C1qa), and its regulator (TGFb1, TGFb2) as well as monocyte infiltration (CCR2, CCL2) is increased in adult ALD spinal cord, coinciding with evidence of axon degeneration (decrease in SYP), but interestingly, proinflammatory markers such as TNF and IL1b are unchanged. (D) Representative western blot image shows protein expression of MFGE8, C1q, and IBA1 in human ALD spinal cord. (E) Quantification shows increased MFGE8, C1q, and IBA1 expression in human ALD spinal cord with β‐actin as loading control. (F) Less IL1β expression in AMN compared to cerebral ALD spinal cord. (G) Representative confocal images show microglial activation in human ALD spinal cord with IBA1 (green) and synaptophysin (red) costaining (indicated by white arrow). Bar = 50 µm for lower magnification; bar = 20 µm for higher magnification. Data are expressed as mean ± SEM, *p < 0.05; **p < 0.01; ***p < 0.001. ALD = adrenoleukodystrophy; AMN = adrenomyeloneuropathy; IBA1 = ionizing calcium‐binding adaptor molecule 1; IL, interleukin; LFB = Luxol fast blue; SEM = standard error of the mean.
Discussion
The present study was designed to investigate the role of the innate immune system in the pathogenesis of AMN. Given that the more acute phenotype of cerebral ALD is associated with microglial activation in the presence of lymphocytic inflammation, we were surprised to find that microglial activation in AMN mouse and human spinal cord not only lacked proinflammatory markers, but was also accompanied by distinct upregulation of phagocytosis. In ABCD1‐deficient mice, we show that microglial activation precedes synapse loss, and that aberrant phagocytosis impairs neuronal projections.
Axonal degeneration in AMN causes selective length‐dependent injury to both the corticospinal tract and dorsal columns. We find microglial activation to be the predominant pathology of the spinal cord in both humans and mice with AMN. In ABCD1‐deficient mice, IBA1 expression is already significantly elevated at 2 months of age, a year before markers of axonal degeneration are detectable. We confirmed past reports21, 22, 23 that within human AMN spinal cord, inflammation is mild or absent. Furthermore, Abcd1–/– vessels in spinal cord were intact (data not shown), and human tissue showed no blood‐borne lymphocytes, no inflammatory lesions, and only minimal clustering of macrophages around vessels (Fig 8).
If microglial activation is an early change yet no inflammation is observed in spinal cord, what mediates pathology? Unexpectedly, we found that even in young Abcd1–/– mice, several key receptors and signaling molecules for phagocytosis are elevated. Trem2 gene expression is markedly increased early on, and over time increased expression of milk fat globule EGF factor 8 (MFGE8; also known as lactadherin or SED1) and C1q are observed. MFGE8 is known to opsonize dying cells and bind to integrins on the surface of phagocytic cells, thus mediating engulfment. Importantly, the aberrant lipid accumulating in ALD, LPC C26:0, further aggravates ABCD1‐deficient microglia, leading to even higher MFGE8 expression. Damage to the neuron ultimately arises from the combination of altered microglial function and the specific chemical environment. Our findings are in line with recent observations that microglial engulfment of live neurons plays a significant role in neurodegenerative diseases.24, 25
Both the literature26, 27, 28 and our own experiments confirm that phagocytosis of neurons and axons with exposed PS can be mediated by MFGE8. In general, two prerequisites are necessary for microglial engulfment of live neurons and axons. The first is activated microglia with upregulated microglial receptors and opsonins like MFGE8, which can recognize a stressed neuron and tag it for engulfment. The second is PS exposure on the neuronal cell surface, which can occur as a result of oxidative stress, an increase in calcium levels, or adenosine triphosphate depletion, among other possible mechanisms.29, 30, 31 PS exposure is not itself toxic to neurons, but rather marks the neuron for selective removal by microglia. If activated microglia are present, this results in phagocytosis of the PS‐exposed neurons.26, 27, 28, 32 In line with this thinking, our data suggest that LPC C26:0, in particular at low dose (15 µM), does not cause significant neuronal toxicity in culture despite leading to PS exposure.
In addition to upregulation of phagocytosis, we found evidence of aberrant complement activation in Abcd1–/– spinal cord, which may provide further mechanistic insights into the pathogenesis of neurodegeneration attributed to ABCD1 deficiency. Colocalization of C1q and synaptophysin in Abcd1–/– mice of different ages suggests that microglia mediate synaptic pruning. During postnatal development and in the normal aging process, the complement pathway plays a critical role in the refinement of neural circuits.10, 33, 34, 35, 36 In AMN, abnormal synaptic pruning attributed to excessive microglial activation may instead promote neurodegeneration, as also observed in many neurodegenerative disease models.10, 36
By what mechanism are MFGE8 and C1q upregulated in Abcd1–/– mouse spinal cord? In vitro CRISPR knockout of ABCD1 gene in N9 microglia did not show upregulation of C1q or MFGE8 (data not shown), suggesting an indirect non‐cell‐autonomous process. Khalifeh‐Soltani et al reported MFGE8 upregulation by high‐fat treatment and demonstrated a role of MFGE8 in absorption of dietary triglycerides and the cellular uptake of fatty acids.37 In our study, increased VLCFA, in particular C26:0 LPC, triggered the expression of MFGE8, suggesting the altered metabolic milieu as one potential factor impacting MFGE8. In addition, we found increased TGFb1 and TGFb2 expression in Abcd1–/– spinal cord (Fig 3). Given that VLCFAs have no significant impact upon TGFb1 expression in primary microglia (data not shown), the mechanism by which MFGE8 and C1q are increased in AMN spinal cord are likely multifactorial.
The TGF signaling pathway has long been considered to play a key role in the regulation of inflammation and microglia activation.38, 39 It has also been shown to be a key regulator of C1q expression and synaptic pruning in the developing visual system.40 Besides, TGFb1 can also upregulate MFGE8 expression and increase microglia‐mediated engulfment of apoptotic cells.20 Hence, the increased TGFb signaling could potentially stimulate both C1q and MFGE8. Many cell types in the central nervous system can produce TGFb1, including microglia, astrocytes, endothelial cells, and neurons. We previously found that ABCD1 silencing in human brain microvascular endothelial cells dramatically increased TGFb1 levels.41
Our data suggest that low‐dose VLCFAs (15 µM) incorporated into phospholipids may contribute to long‐tract axon degeneration, but only in the presence of primed phagocytic microglia. Neither human nor mouse AMN spinal cord displays cell death despite accumulation of LPC C26:0.42 For some time, it has been known that excess VLCFA (40 µM and above) affects membrane function and causes toxicity to adrenocortical cells, oligodendrocytes, astrocytes, and neurons.43, 44 For example, excess free VLCFA induces depolarization of mitochondria and deregulation of the intracellular calcium homeostasis,42 and in the brain, this can cause activation and apoptosis of microglia.4 However, more relevant than these supraphysiological doses are the lower doses that we used, which in isolation do not cause cell death. Our findings call into question whether free VLCFAs are truly toxic under physiological conditions in human disease; rather, the findings suggest that VLCFAs incorporated in LPC induce neuronal stress that leads to phagocytosis by primed, ABCD1‐deficient microglia.
Previously, neuronal loss during brain inflammation had been assumed to be attributed to phagocytosis of neurons subsequent to their apoptotic or necrotic death.45 However, recently it was shown that, under inflammatory conditions in primary rat cultures of neurons and glia, phagocytosis itself actively induces neuronal death.32 Although the development of AMN occurs in the absence of overt inflammation, early oxidative damage including increased oxidative lesions and altered antioxidant defense is detected in the mouse spinal cord and human fibroblast cell lines.46 As the well‐known inducer of phosphatidylserine exposure, oxidative stress in AMN spinal cord may also prime for phagocytosis. Furthermore, activated microglia themselves can also secrete nitric oxide that causes PS exposure and leads to phagocytosis. We observed increased iNOS expression in both primary cultured microglia and 3‐month spinal cord tissue following LPS challenge in Abcd1–/– mice.
Several limitations to our study apply. Human spinal cord tissue sections are limited to rare cases of adult ALD and represent end‐stage pathology. The contribution of other cell types, such as astrocytes, oligodendrocytes, and endothelial cells, was beyond the scope of our current investigation, and these cells may play a role in the cascade of neurodegeneration. Future work evaluating phagocytic receptors in transgenic and knockout animals is needed to corroborate our findings.
In sum, our data indicate a novel form of neurodegeneration, where lack of ABCD1 induces microglial activation and priming, aberrant lipids expose eat‐me signals on otherwise viable neurons, and neurons degenerate through phagocytosis. Ultimately, blocking phagocytosis may prevent some forms of neurodegeneration and thus requires further exploration in AMN.
Author Contributions
Y.G. and F.E. were responsible for conception and design of the study. Y.G., N.S., F.L., M.F., P.M., R.T., D.Y.K., A.B., J.K., and F.E. were responsible for data acquisition and analysis. YG, NS, FL, FE were responsible for drafting the manuscript and figures. All authors have read, critically revised, and approved the manuscript before submission.
Potential Conflicts of Interest
Nothing to report.
Acknowledgment
This work was supported by grants from the Leblang Charitable Foundation, the University of Pennsylvania Orphan Disease Center, the Applied Genetic Technologies Corporation, and NIH (R01 NINDS).
References
- 1. Mosser J, Douar AM, Sarde CO, et al. Putative X‐linked adrenoleukodystrophy gene shares unexpected homology with ABC transporters. Nature 1993;361:726–730. [DOI] [PubMed] [Google Scholar]
- 2. Mosser J, Lutz Y, Stoeckel ME, et al. The gene responsible for adrenoleukodystrophy encodes a peroxisomal membrane protein. Hum Mol Genet 1994;3:265–271. [DOI] [PubMed] [Google Scholar]
- 3. Berger J, Forss‐Petter S, Eichler FS. Pathophysiology of X‐linked adrenoleukodystrophy. Biochimie 2014;98:135–142. [DOI] [PMC free article] [PubMed] [Google Scholar]
- 4. Eichler FS, Ren JQ, Cossoy M, et al. Is microglial apoptosis an early pathogenic change in cerebral X‐linked adrenoleukodystrophy? Ann Neurol 2008;63:729–742. [DOI] [PubMed] [Google Scholar]
- 5. Ho JK, Moser H, Kishimoto Y, Hamilton JA. Interactions of a very long chain fatty acid with model membranes and serum albumin. Implications for the pathogenesis of adrenoleukodystrophy. J Clin Invest 1995;96:1455–1463. [DOI] [PMC free article] [PubMed] [Google Scholar]
- 6. Igarashi M, Schaumburg HH, Powers J, et al. Fatty acid abnormality in adrenoleukodystrophy. J Neurochem 1976;26:851–860. [DOI] [PubMed] [Google Scholar]
- 7. Moser AB, Kreiter N, Bezman L, et al. Plasma very long chain fatty acids in 3,000 peroxisome disease patients and 29,000 controls. Ann Neurol 1999;45:100–110. [DOI] [PubMed] [Google Scholar]
- 8. Hubbard WC, Moser AB, Liu AC, et al. Newborn screening for X‐linked adrenoleukodystrophy (X‐ALD): validation of a combined liquid chromatography‐tandem mass spectrometric (LC‐MS/MS) method. Mol Genet Metab 2009;97:212–220. [DOI] [PubMed] [Google Scholar]
- 9. Fouquet F, Zhou JM, Ralston E, et al. Expression of the adrenoleukodystrophy protein in the human and mouse central nervous system. Neurobiol Dis 1997;3:271–285. [DOI] [PubMed] [Google Scholar]
- 10. Hong S, Beja‐Glasser VF, Nfonoyim BM, et al. Complement and microglia mediate early synapse loss in Alzheimer mouse models. Science 2016;352:712–716. [DOI] [PMC free article] [PubMed] [Google Scholar]
- 11. Ransohoff RM, El Khoury J. Microglia in health and disease. Cold Spring Harb Perspect Biol. 2015. Sep 9. doi: 10.1101/cshperspect.a020560. [Epub ahead of print] [DOI] [PMC free article] [PubMed] [Google Scholar]
- 12. Powers JM, DeCiero DP, Ito M, Moser AB, Moser HW. Adrenomyeloneuropathy: a neuropathologic review featuring its noninflammatory myelopathy. J Neuropathol Exp Neurol 2000;59:89–102. [DOI] [PubMed] [Google Scholar]
- 13. Dumser M, Bauer J, Lassmann H, Berger J, Forss‐Petter S. Lack of adrenoleukodystrophy protein enhances oligodendrocyte disturbance and microglia activation in mice with combined Abcd1/Mag deficiency. Acta Neuropathol 2007;114:573–586. [DOI] [PubMed] [Google Scholar]
- 14. Pujol A, Ferrer I, Camps C, et al. Functional overlap between ABCD1 (ALD) and ABCD2 (ALDR) transporters: a therapeutic target for X‐adrenoleukodystrophy. Hum Mol Genet 2004;13:2997–3006. [DOI] [PubMed] [Google Scholar]
- 15. Tamashiro TT, Dalgard CL, Byrnes KR. Primary microglia isolation from mixed glial cell cultures of neonatal rat brain tissue. J Vis Exp 2012;(66):e3814. [DOI] [PMC free article] [PubMed] [Google Scholar]
- 16. Kim YH, Choi SH, D'Avanzo C, et al. A 3D human neural cell culture system for modeling Alzheimer's disease. Nat Protoc 2015;10:985–1006. [DOI] [PMC free article] [PubMed] [Google Scholar]
- 17. Pujol A, Hindelang C, Callizot N, et al. Late onset neurological phenotype of the X‐ALD gene inactivation in mice: a mouse model for adrenomyeloneuropathy. Hum Mol Genet 2002;11:499–505. [DOI] [PubMed] [Google Scholar]
- 18. Nomura K, Vilalta A, Allendorf DH, Hornik TC, Brown GC. Activated microglia desialylate and phagocytose cells via neuraminidase, galectin‐3, and mer tyrosine kinase. J Immunol 2017;198:4792–4801. [DOI] [PMC free article] [PubMed] [Google Scholar]
- 19. Ribes S, Ebert S, Czesnik D, et al. Toll‐like receptor prestimulation increases phagocytosis of Escherichia coli DH5alpha and Escherichia coli K1 strains by murine microglial cells. Infect Immun 2009;77:557–564. [DOI] [PMC free article] [PubMed] [Google Scholar]
- 20. Spittau B, Rilka J, Steinfath E, Zöller T, Krieglstein K. TGFβ1 increases microglia‐mediated engulfment of apoptotic cells via upregulation of the milk fat globule‐EGF factor 8. Glia 2015;63:142–153. [DOI] [PubMed] [Google Scholar]
- 21. Schaumburg HH, Powers JM, Raine CS, et al. Adrenomyeloneuropathy: a probable variant of adrenoleukodystrophy. II. General pathologic, neuropathologic, and biochemical aspects. Neurology 1977;27:1114–1119. [DOI] [PubMed] [Google Scholar]
- 22. Powers JM. Adreno‐leukodystrophy (adreno‐testiculo‐leukomyelo‐neuropathic‐complex). Clin Neuropathol 1985;4:181–199. [PubMed] [Google Scholar]
- 23. van Geel BM, Koelman JH, Barth PG, Ongerboer de Visser BW. Peripheral nerve abnormalities in adrenomyeloneuropathy: a clinical and electrodiagnostic study. Neurology 1996;46:112–118. [DOI] [PubMed] [Google Scholar]
- 24. Brown GC, Neher JJ. Microglial phagocytosis of live neurons. Nat Rev Neurosci 2014;15:209–216. [DOI] [PubMed] [Google Scholar]
- 25. Brown GC, Vilalta A. How microglia kill neurons. Brain Res 2015;1628(pt B):288–297. [DOI] [PubMed] [Google Scholar]
- 26. Neher JJ, Emmrich JV, Fricker M, et al. Phagocytosis executes delayed neuronal death after focal brain ischemia. Proc Natl Acad Sci U S A 2013;110:E4098–E4107. [DOI] [PMC free article] [PubMed] [Google Scholar]
- 27. Fricker M, Neher JJ, Zhao JW, et al. MFG‐E8 mediates primary phagocytosis of viable neurons during neuroinflammation. J Neurosci 2012;32:2657–2666. [DOI] [PMC free article] [PubMed] [Google Scholar]
- 28. Neniskyte U, Brown GC. Lactadherin/MFG‐E8 is essential for microglia‐mediated neuronal loss and phagoptosis induced by amyloid beta. J Neurochem 2013;126:312–317. [DOI] [PubMed] [Google Scholar]
- 29. Suzuki J, Fujii T, Imao T, et al. Calcium‐dependent phospholipid scramblase activity of TMEM16 protein family members. J Biol Chem 2013;288:13305–13316. [DOI] [PMC free article] [PubMed] [Google Scholar]
- 30. Tyurina YY, Basova LV, Konduru NV, et al. Nitrosative stress inhibits the aminophospholipid translocase resulting in phosphatidylserine externalization and macrophage engulfment: implications for the resolution of inflammation. J Biol Chem 2007;282:8498–8509. [DOI] [PubMed] [Google Scholar]
- 31. Suzuki J, Denning DP, Imanishi E, Horvitz HR, Nagata S. Xk‐related protein 8 and CED‐8 promote phosphatidylserine exposure in apoptotic cells. Science 2013;341:403–406. [DOI] [PubMed] [Google Scholar]
- 32. Neher JJ, Neniskyte U, Zhao JW, et al. Inhibition of microglial phagocytosis is sufficient to prevent inflammatory neuronal death. J Immunol 2011;186:4973–4983. [DOI] [PubMed] [Google Scholar]
- 33. Walport MJ. Complement. First of two parts. N Engl J Med 2001;344:1058–1066. [DOI] [PubMed] [Google Scholar]
- 34. Schafer DP, Lehrman EK, Kautzman AG, et al. Microglia sculpt postnatal neural circuits in an activity and complement‐dependent manner. Neuron 2012;74:691–705. [DOI] [PMC free article] [PubMed] [Google Scholar]
- 35. Stephan AH, Madison DV, Mateos JM, et al. A dramatic increase of C1q protein in the CNS during normal aging. J Neurosci 2013;33:13460–13474. [DOI] [PMC free article] [PubMed] [Google Scholar]
- 36. Lui H, Zhang J, Makinson SR, et al. Progranulin deficiency promotes circuit‐specific synaptic pruning by microglia via complement activation. Cell 2016;165:921–935. [DOI] [PMC free article] [PubMed] [Google Scholar]
- 37. Khalifeh‐Soltani A, McKleroy W, Sakuma S, et al. Mfge8 promotes obesity by mediating the uptake of dietary fats and serum fatty acids. Nat Med 2014;20:175–183. [DOI] [PMC free article] [PubMed] [Google Scholar]
- 38. Paglinawan R, Malipiero U, Schlapbach R, Frei K, Reith W, Fontana A. TGFbeta directs gene expression of activated microglia to an anti‐inflammatory phenotype strongly focusing on chemokine genes and cell migratory genes. Glia 2003;44:219–231. [DOI] [PubMed] [Google Scholar]
- 39. Butovsky O, Jedrychowski MP, Moore CS, et al. Identification of a unique TGF‐beta‐dependent molecular and functional signature in microglia. Nat Neurosci 2014;17:131–143. [DOI] [PMC free article] [PubMed] [Google Scholar]
- 40. Bialas AR, Stevens B. TGF‐beta signaling regulates neuronal C1q expression and developmental synaptic refinement. Nat Neurosci 2013;16:1773–1782. [DOI] [PMC free article] [PubMed] [Google Scholar] [Retracted]
- 41. Musolino PL, Gong Y, Snyder JM, et al. Brain endothelial dysfunction in cerebral adrenoleukodystrophy. Brain 2015;138(pt 11):3206–3220. [DOI] [PMC free article] [PubMed] [Google Scholar]
- 42. Gong Y, Mu D, Prabhakar S, et al. Adenoassociated virus serotype 9‐mediated gene therapy for x‐linked adrenoleukodystrophy. Mol Ther 2015;23:824–834. [DOI] [PMC free article] [PubMed] [Google Scholar]
- 43. Hein S, Schonfeld P, Kahlert S, Reiser G. Toxic effects of X‐linked adrenoleukodystrophy‐associated, very long chain fatty acids on glial cells and neurons from rat hippocampus in culture. Hum Mol Genet 2008;17:1750–1761. [DOI] [PubMed] [Google Scholar]
- 44. Whitcomb RW, Linehan WM, Knazek RA. Effects of long‐chain, saturated fatty acids on membrane microviscosity and adrenocorticotropin responsiveness of human adrenocortical cells in vitro. J Clin Invest 1988;81:185–188. [DOI] [PMC free article] [PubMed] [Google Scholar]
- 45. Kinsner A, Pilotto V, Deininger S, et al. Inflammatory neurodegeneration induced by lipoteichoic acid from Staphylococcus aureus is mediated by glia activation, nitrosative and oxidative stress, and caspase activation. J Neurochem 2005;95:1132–1143. [DOI] [PubMed] [Google Scholar]
- 46. Fourcade S, López‐Erauskin J, Galino J, et al. Early oxidative damage underlying neurodegeneration in X‐adrenoleukodystrophy. Hum Mol Genet 2008;17:1762–1773. [DOI] [PubMed] [Google Scholar]