

Abstract
A new approach to intraoperative radiotherapy makes use of a mobile electron linear accelerator delivering therapeutic radiation doses in an operating room suite. This unconventional technology has raised questions concerning protection for personnel and the necessity of shielding the adjoining areas. In this study, the leakage and scatter radiation from the mobile electron accelerator is measured and characterized in a series of spherical projections. An analysis is performed to determine the need for shielding or, alternatively, patient‐based load restrictions in the operating room. This investigation provides a resource to assess shielding and/or patient load restrictions for any facility performing intraoperative radiotherapy with a similar unit. The data presented indicates that the mobile electron accelerator may be operated in an area with little or no shielding under nominal patient load expectations.
PACS number(s): 87.52.–g, 87.53.–j
Keywords: intraoperative radiotherapy, electrons, shielding, radiation protection
INTRODUCTION
The Mobetron® (Mobetron is a registered trademark of IntraOp Medical, Inc.) is a Mobile Electron Beam Intraoperative Treatment System designed for electron beam radiotherapy treatments in the operating room. 1 The attraction of this type of treatment is the ability to deliver a very large uniform dose to a surgically exposed target volume in a single fraction. Doses of 10–25 Gray are delivered while the patient is managed under anesthesia. The electron fields may be collimated and shaped, depending on the clinical presentation. This versatility reduces the dose to the surrounding tissue, as well as to other critical structures. The Mobetron is designed as a mobile unit for Intraoperative Radiotherapy (IORT). Its mobility is possible because of a substantial reduction in weight and size of the accelerator. The size reduction is largely due to its X‐band technology and also to the lack of a bending magnet. The highly collimated electron beam, low radiation leakage, and the beam stop are designed to allow the Mobetron to be operated in a room with little or no shielding. The intent of this report is to provide a basis to calculate shielding requirements and/or workload restrictions for the Mobetron. The radiation leakage characteristics and exposure (air kerma) levels are reported in a series of spherical projections. Appropriate use of this data illustrates a standardized method to determine allowable workloads that ensure radiation levels are kept below the regulatory limit while using the Mobetron in any facility. The unit is pictured in Fig. 1.
Figure 1.
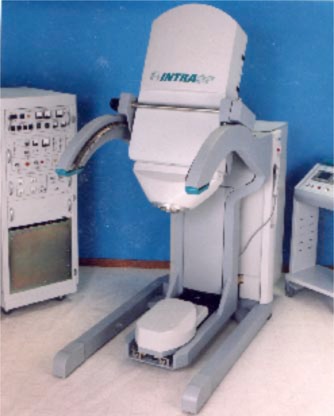
Mobetron.
MATERIALS AND METHODS
The Mobetron operation results in photon leakage and scatter, as well as electron scatter in the operating room. Due to the limited range of the scattered electrons, the conventional wall material, two sheets of ‐inch drywall, is sufficient to eliminate any radiation hazard from electrons outside the operating room. The photon contamination of the most energetic electron beam, 12 MeV, is around 2 percent. There is only a slight contribution from the Compton interaction within the patient and applicator to the measured photon fluence. Consequently, photon scatter from the patient represents only a small contribution to the overall measured radiation. The primary source of the measured photon fluence is from head leakage. In conventional accelerators the bending magnet is a major source of radiation leakage. The Mobetron uses two X‐band (3 cm wavelength 10 GHz frequency) colinear accelerators. This design eliminates the need for a bending magnet, thus effecting a reduction in photon leakage. The Mobetron has two points of potential leakage: the area where the two colinear accelerators meet and the scattering foil. 2 During measurements, a cylindrical, aluminum applicator with a 10 cm diameter and 32 cm length was attached to a polyethylene phantom with a 13.5 cm diameter and 8.5 cm length. This assembly was used to simulate machine leakage and patient scatter in the treatment configuration. Our measurement surface was a sphere centered on the flattening filter at a radius of 2 meters and bisected by X Y, and Z planes. The X plane, visualized in a top view, contains the measurements that surround the machine at the height of the flattening filter. The X plane measurements are applicable to determine the risk of personnel that work on the same floor near the operating room. The Y plane is visualized in a side view, while the Z plane is visualized in a frontal view of the Mobetron. These measurements help to characterize the radiation risk to floors above and below the unit. The measurement location was chosen to provide optimal geometry for measurement of leakage and scatter from multiple source points along the gantry.
The measurements were taken at the Mobetron production facility (Siemens Medical Systems Oncology Care Systems, Concord, California). During testing, the Mobetron was operated at the calibrated dose rate of 1000 MU/min. for all electron energies, 4, 6, 9, and 12 MeV. The nominal measurements were taken at 2 meters from the scattering foil, in each plane, using a Standard
Imaging Premier 3000 Electrometer (Standard Imaging, Inc., Middleton, WI) and a Capintec Model PM‐30 Ionization Chamber (Capintec, Inc, Ramsey, NJ) with 1 cm buildup cap. Two ‐inch sheets of drywall were placed between the source and the chamber to attenuate scattered electrons. The chamber was secured in position using a multipositional clamp. Readings were corrected for temperature and pressure. The measurements were made every 22.5° in the X, Y, and Z planes with respect to the gantry. The quality of the leakage and scatter was obtained at two meters and 0 degrees in the X plane, which is directly in front of the unit, and at 22.5° in the Z plane, which is just lateral to the beam stop. Lead sheets 99.9% pure, with a thickness from 0 to 60 mm, were used to determine the quality of the scatter and leakage.
RESULTS
For a given energy, the radiation quality two meters in front of the unit was equivalent to the quality just lateral to the beam stop. Beam quality results are presented in Table I.
Table I.
Mobetron combined leakage and scatter radiation quality by energy.
| Quality\Energy | 4 MeV | 6 MeV | 9 MeV | 12 MeV |
|---|---|---|---|---|
| First half value layer, mm lead | 10.8 | 12.1 | 13.3 | 13.6 |
| Second half value layer, mm lead | 14.8 | 16 | 16.2 | 16.5 |
| Tenth value layer, mm lead | 45.1 | 49.3 | 50.8 | 51.9 |
The first and second half value layers (HVL's) and tenth value layers (TVL's) were calculated using a least squares fit analysis of the data. The least squares fit model overestimates the first HVL; however, this model was chosen to provide a conservative estimate for radiation safety and protection purposes.
In this analysis, it was assumed all energies would contribute equally to the workload of the accelerator. All subsequent data presentations average the exposure rate measurements over all energies, thus assuming an equal workload contribution. An average first HVL over all beam energies of 12.4 mm lead was used to calculate the shielding thickness and allowable monitor units. The measurement results for each plane are presented in Figs. 2, 3, and 4. The results are presented in air kerma (μGy) per 1000 monitor units at two meters from the scattering foil. The measurements are taken every 22.5° in each plane. Given the nominal Mobetron dose rate of , the results also may be presented in equivalent.
Figure 2.
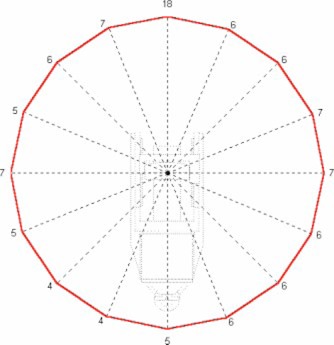
μGy/1000 monitor units at 2 meters in the X plane.
Figure 3.
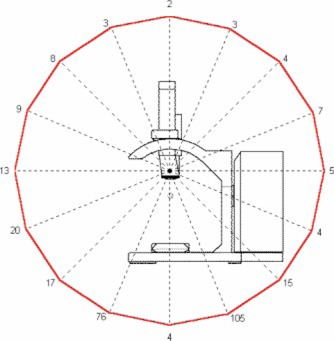
μGy/1000 monitor units at 2 meters in the Y plane.
Figure 4.
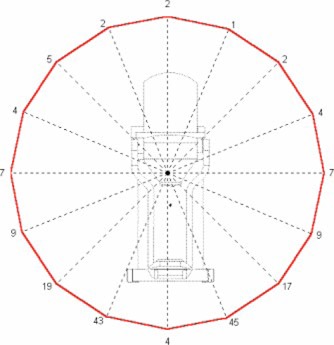
μGy/1000 monitor units at 2 meters in the Z plane.
The and 50 exposure curves in each plane are presented in Figs. 5, 6, and 7. The peak exposure occurs at the 0° angle in the X plane, which is directly in front of the unit (see Fig. 5). The peak intensity in this plane is most likely due to the leakage from the scattering foil and the colinear accelerator junction. The exposure curve occurs at the maximum distance of 0.8 meters and the line at 1.2 meters. In the Y plane the peak exposures occur at just lateral to the beam stop (see Fig. 6). The curve occurs at a maximum distance of 2.0 meters and the curve at 2.8 meters.
Figure 5.
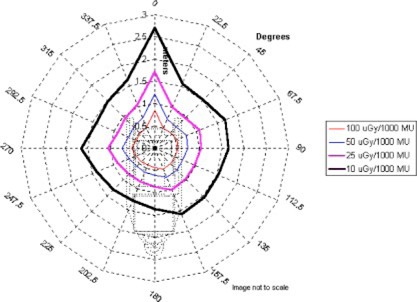
Exposure curves in the X plane.
Figure 6.
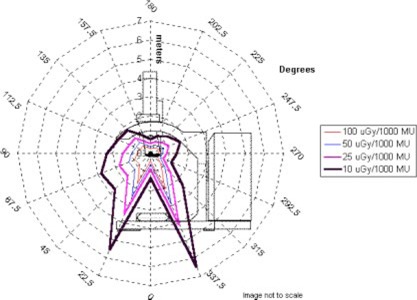
Exposure curves in the Y plane.
Figure 7.
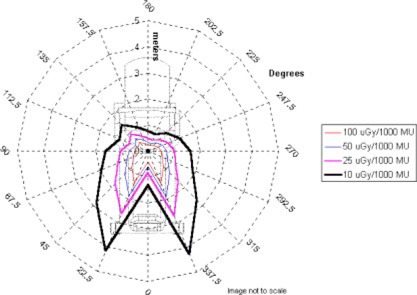
Exposure curves in the Z plane.
As expected, the Z plane peak exposure occurs again at , just lateral to the beam stop (see Fig. 7). The line occurs at a maximum distance of 1.3 meters and at 1.9 meters. The peak intensity in these areas for the Y and Z plane is due to forward scatter, originating in the phantom and applicator, which is not attenuated by the beam stop.
From our measurements we were able to calculate an allowable workload in monitor units per week for all occupied areas surrounding the Mobetron. The calculations are based upon an average air kerma for all energies weighted equally and all treatment positions weighted equally. The allowable monitor unit calculations are derived from the inverse square law and half value thickness for each material. Table II presents workload limits in monitor units per week for the adjoining areas on the same floor. The calculations include workloads for both controlled and noncontrolled areas. Based upon current regulatory limits, the allowable exposure level for noncontrolled areas is considered to be 1 mSv , which corresponds to approximately 0.02 mSv . 3 In addition, considering occupancy, in a noncontrolled area no more than 0.02 mSv is allowed during any one hour. The regulatory limits allow controlled areas an exposure 50 mSv . 4 This limit corresponds to an exposure of 1 mSv . Controlled areas must be labeled appropriately and access for members of the public should be limited. Occupancy factors were all considered to be in unity for this analysis.
Table II.
Allowable monitor units per week for walls.
| Lead (mm) | Concrete (mm) | Noncontrolled | ||||
|---|---|---|---|---|---|---|
| Distance to occupied area (meters) | ||||||
| 1 | 2 | 3 | 4 | 5 | ||
| 0 | 0 | 600 | 2400 | 5 400 | 9 500 | 15 000 |
| 5 | 25 | 800 | 3100 | 7 100 | 13 000 | 19 600 |
| 10 | 50 | 1000 | 4200 | 9 300 | 17 000 | 26 000 |
| 15 | 75 | 1400 | 5500 | 12 000 | 22 000 | 34 000 |
| 20 | 100 | 1800 | 7200 | 16 000 | 29 000 | 45 000 |
| 25 | 125 | 2400 | 9600 | 22 000 | 38 000 | 59 800 |
| 1000 MU/min | ||||||
|---|---|---|---|---|---|---|
| Controlled | ||||||
| Lead (mm) | Concrete (mm) | Distance to occupied area (meters) | ||||
| 1 | 2 | 3 | 4 | 5 | ||
| 0 | 0 | 29 700 | 120 000 | 270 000 | 480 000 | 740 000 |
| 5 | 25 | 39 000 | 160 000 | 350 000 | 630 000 | 980 000 |
| 10 | 50 | 52 000 | 210 000 | 470 000 | 830 000 | 1 300 000 |
| 15 | 75 | 69 000 | 270 000 | 620 000 | 1 100 000 | 1 700 000 |
| 20 | 100 | 91 000 | 360 000 | 810 000 | 1 400 000 | 2 300 000 |
| 25 | 125 | 120 000 | 480 000 | 1 100 000 | 1 900 000 | 2 980 000 |
| 1000 MU/min | ||||||
Table III represents workload limits for the areas below the Mobetron and Table IV represents the areas above. All calculations in Tables III and IV were made using an occupancy factor of one. Modifications with respect to occupancy can be made easily using these tables by dividing the allowable workload by the occupancy factor associated for the adjacent area.
Table III.
Allowable monitor units per week for floor below.
| Lead (mm) | Concrete (mm) | Noncontrolled | ||||
|---|---|---|---|---|---|---|
| Distance to occupied area (meters) | ||||||
| 1 | 2 | 3 | 4 | 5 | ||
| 0 | 0 | 70 | 300 | 600 | 1000 | 1600 |
| 5 | 25 | 90 | 400 | 800 | 1400 | 2100 |
| 10 | 50 | 120 | 500 | 1000 | 1800 | 2800 |
| 15 | 75 | 150 | 600 | 1400 | 2400 | 3700 |
| 20 | 100 | 200 | 800 | 1800 | 3200 | 5000 |
| 25 | 125 | 300 | 1100 | 2400 | 4200 | 6500 |
| 1000 MU/min | ||||||
|---|---|---|---|---|---|---|
| Lead (mm) | Concrete (mm) | Controlled | ||||
| Distance to occupied area (meters) | ||||||
| 1 | 2 | 3 | 4 | 5 | ||
| 0 | 0 | 3 200 | 13 000 | 29 000 | 52 000 | 81 000 |
| 5 | 25 | 4 300 | 17 000 | 38 000 | 69 000 | 110 000 |
| 10 | 50 | 5 600 | 23 000 | 51 000 | 90 000 | 140 000 |
| 15 | 75 | 7 500 | 30 000 | 67 000 | 120 000 | 190 000 |
| 20 | 100 | 10 000 | 40 000 | 89 000 | 160 000 | 250 000 |
| 25 | 125 | 13 000 | 52 000 | 120 000 | 210 000 | 330 000 |
| 1000 MU/min | ||||||
Table IV.
Allowable monitor units per week for ceiling.
| Lead (mm) | Concrete (mm) | Noncontrolled | ||||
|---|---|---|---|---|---|---|
| Distance to occupied area (meters) | ||||||
| 1 | 2 | 3 | 4 | 5 | ||
| 0 | 0 | 2200 | 8 800 | 19 800 | 35 000 | 55 000 |
| 5 | 25 | 3000 | 12 000 | 26 000 | 46 000 | 73 000 |
| 10 | 50 | 3800 | 15 000 | 35 000 | 61 000 | 96 000 |
| 15 | 75 | 5100 | 20 000 | 46 000 | 81 000 | 130 000 |
| 20 | 100 | 6700 | 27 000 | 60 000 | 110 000 | 170 000 |
| 25 | 125 | 8800 | 35 000 | 79 500 | 140 000 | 220 000 |
| 1000 MU/min | ||||||
|---|---|---|---|---|---|---|
| Lead (mm) | Concrete (mm) | Controlled | ||||
| Distance to occupied area (meters) | ||||||
| 1 | 2 | 3 | 4 | 5 | ||
| 0 | 0 | 110 000 | 440 000 | 990 000 | 1 800 000 | 2 700 000 |
| 5 | 25 | 150 000 | 580 000 | 1 300 000 | 2 300 000 | 3 600 000 |
| 10 | 50 | 190 000 | 770 000 | 1 700 000 | 3 100 000 | 4 800 000 |
| 15 | 75 | 250 000 | 1 000 000 | 2 300 000 | 4 100 000 | 6 300 000 |
| 20 | 100 | 330 000 | 1 300 000 | 3 000 000 | 5 400 000 | 8 400 000 |
| 25 | 125 | 440 000 | 1 800 000 | 3 970 000 | 7 100 000 | 11 000 000 |
| 1000 MU/min | ||||||
Prior to use at the University of Louisville Hospital, a protection survey was performed for the two operating room suites proposed for Mobetron procedures. The measurements were performed at 22 surrounding locations for each room and readings for all energies were averaged. The protection survey data are presented in Table V for six locations that approximate the 0°, 90°, 180°, and 270° positions in the X Plane. The 22.5° and 337.5° positions averaged in the Y and Z planes correspond to the floor below, and the 157.5°, 180°, and 202.5° positions averaged in the Y and Z planes correspond to the floor above. The predicted exposure rate values correspond well with measured values from the protection survey.
Table V.
Mobetron radiation survey for operating rooms 8 and 5.
| Degrees | Expected | Measured O.R. #8 | Measured O.R. #5 |
|---|---|---|---|
| 0 | 24 | 18 | 18 |
| 90 | 14 | 12 | 18 |
| 180 | 7 | 7 | 8 |
| 270 | 31 | 31 | 35 |
| Floor above | 0.3 | 0.4 | 0.4 |
| Floor above | 11 | 8 | 10 |
CONCLUSION
The data and methodology demonstrate that for normal room dimensions the walls and the ceiling pose a minor restriction on patient load. The most restrictive workload values occur at the floor below. If the area is occupied and noncontrolled, assuming standard building material and standard distances, the facility may be restricted to only 2000 to 3000 MU per week. However, this conservative restriction can be averted if the area below the Mobetron is deemed a controlled area, or the occupancy of that area is less than one. The protection survey results obtained at the University of Louisville confirm that the data measured at the Mobetron Production Facility may be used to estimate exposure rate values for a Mobetron site location.
Tables II, III, and IV may be used to determine allowable patient workload values for any facility and any building configuration. Assuming standard building materials, this method demonstrates a conservative workload of 3 to 4 patients per week, including warm‐up. Normal patient loads of 3 patients per week, receiving approximately 20 Gy, including warm‐up, fit well within the confines of workload limitations calculated here. The measurements and subsequent calculations clearly demonstrate that the Mobetron can be operated in a room with little or no shielding.
ACKNOWLEDGMENTS
The authors express their appreciation to Tom Cook, Service Manager, IntraOp Med. Inc., Rich Simon, VP Operations, IntraOp Med. Inc., and Sarah Hughes, Brachytherapy Technologist, Department of Radiation Oncology, University of Louisville, for their assistance. This investigation was supported by a grant from IntraOp Medical, Incorporated.
Contributor Information
Jodi L. Daves, Email: jldave0l@gwise.louisville.edu
Michael D. Mills, Email: mdm@bcc.louisville.edu
References
- 1. Meurk M. L., Goer D. A., Spalek G., and Cook T., “The Mobetron: Anew concept for IORT,” Front. Radiat. Ther. Oncol. 31, 65–70 (1997). [DOI] [PubMed] [Google Scholar]
- 2. Mills M. D., Almond P. R., Boyer A. L., Ochran T. G., Madigan W., Rich T. A., and Dally E. B., “Shielding Considerations for an Operating Room Based Intraoperative Electron Radiotherapy Unit,” Int. J. Radiat. Oncol., Biol., Phys. 18, 1215–1221 (1990). [DOI] [PubMed] [Google Scholar]
- 3. U. S. Nuclear Regulatory Commission , Title 10 Code of Federal Regulations, 20.1301(a) (US GPO, Washington, D.C., 1998). [Google Scholar]
- 4. U.S. Nuclear Regulatory Commission , Title 10 Code of Federal Regulations, 20.1201 (US GPO, Washington, D.C., 1998). [Google Scholar]