Abstract
As more manufacturing processes and research institutions adopt customized manufacturing as a key element in their design strategies and finished products, the resulting mechanical properties of parts produced through additive manufacturing (AM) must be characterized and understood. In material extrusion (MatEx), the most recently extruded polymer filament must bond to the previously extruded filament via polymer diffusion to form a “weld”. The strength of the weld limits the performance of the manufactured part and is controlled through processing conditions. Under-standing the role of processing conditions, specifically extruder velocity and extruder temperature, on the overall strength of the weld will allow optimization of MatEx-AM parts. Here, the fracture toughness of a single weld is determined through a facile “trouser tear” Mode III fracture experiment. The actual weld thickness is observed directly by optical microscopy characterization of cross sections of MatEx-AM samples. Representative data of weld strength as a function of printing parameters on a commercial 3D printer demonstrates the robustness of the method.
Keywords: material extrusion, fused deposition modeling, ABS, bond strength, mechanical strength, additive manufacturing, 3D printing
Graphical Abstract
1 Introduction
Additive manufacturing (AM) is quickly becoming the technique of choice for customized manufacturing applications. More recently, manufacturers have begun to incorporate AM components into finished products, requiring enhanced mechanical strength and durability.[1–4] Most AM processes, such as laser sintering, photopolymerization/stereolithography, or material extrusion-based techniques, involve the creation of welds, which are inherent weak points in the parts.[5–7] As AM techniques continue to increase in popularity, facile methods that enable the quantification of the mechanical strength of these bonds or welds must be developed.[6]
Material extrusion (MatEx) is currently one of the most widely utilized polymer-based AM techniques due to the relatively low extrusion temperatures and wide range of polymer feedstocks available to designers, engineers, and do-it-yourselfers.[8–10] Similar to other AM techniques, the weakest point of a MatEx-AM part is the attachment point or weld between subsequent layers of extruded material.[5,11,12] As new polymeric printing filament materials are developed, ranging from rubbery to glassy and potentially containing nano- and micro-scale particulate fillers,[13] optimization of processing parameters to achieve the maximum weld strength must be empirically determined.
The objective of this study is to present a straightforward measurement technique to characterize the strength of an individual weld formed between two consecutive roads (a road is a single strand or piece of a layer) produced by MatEx-AM. Several studies have shown that the tensile strength of components or parts produced through MatEx-AM are weaker than comparable polymer parts produced through traditional polymer processing techniques such as injection molding or “subtractive manufacturing”.[14,15] The orientation in which the polymer filament is extruded with respect to the applied uniaxial tensile loading direction directly influences the overall tensile strength of the part.[5,11,12,16–18] When a tensile load is applied orthogonal to the print direction such that the weld is being pulled apart in a Mode I fracture, the overall strength of the part is much lower than when the load is applied parallel to the printing direction.[19,20] However, the determination of the mechanical strength of a single weld formed through MatEx-AM has not been reported.
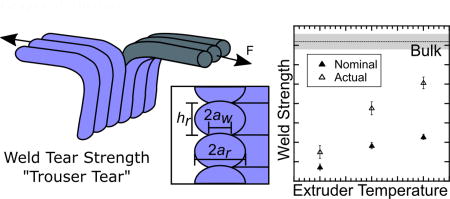
Here, we present a straightforward technique to directly measure the mechanical strength of a MatEx-AM weld through a Mode III torsional “trouser tear” technique. The tearing energy determined through this technique is a direct measurement of weld strength. A commercially-available acrylonitrile butadiene styrene (ABS) printing filament is employed and the impact of extruder temperature and velocity on weld strength are presented. Further, by examining the cross-sectional shape of the weld, the actual tearing energy of the weld is calculated, providing a more accurate metric than the nominal tearing energy based on overall sample thickness. The methodology and analysis approach presented here can readily be adapted and applied to other MatEx-AM materials for the facile characterization of weld strength dependence on processing parameters.
2 Material and methods
2.1 Sample preparation
Samples resembling walls one road thick and 16 roads tall were printed on a modified Replicator 2× 3D printer (MakerBot Industries†, Brooklyn, NY) from commercially-available ABS printer filament (MakerBot Industries, Brooklyn NY). All layers were printed in the same direction, with the extruder moving from left to right (positive × direction). The extruder temperature setting was varied from 210 °C to 250 °C and the extruder velocity was varied from 1 mm/s to 100 mm/s. The layer height machine setting was held fixed at 300 µm ± 3 µm. Stabilizing “feet” (10 mm by 20 mm) were printed as part of the first layer at each end of the 160 mm long walls to provide sufficient adhesion between the sample and the build plate, preventing printing issues that can result from residual stresses during printing. The build plate temperature was held fixed at T = 110 °C, for the printing of all samples (the Replicator 2× does not have temperature controlled chamber). The inner diameter of the extruder nozzle was 400 µm.
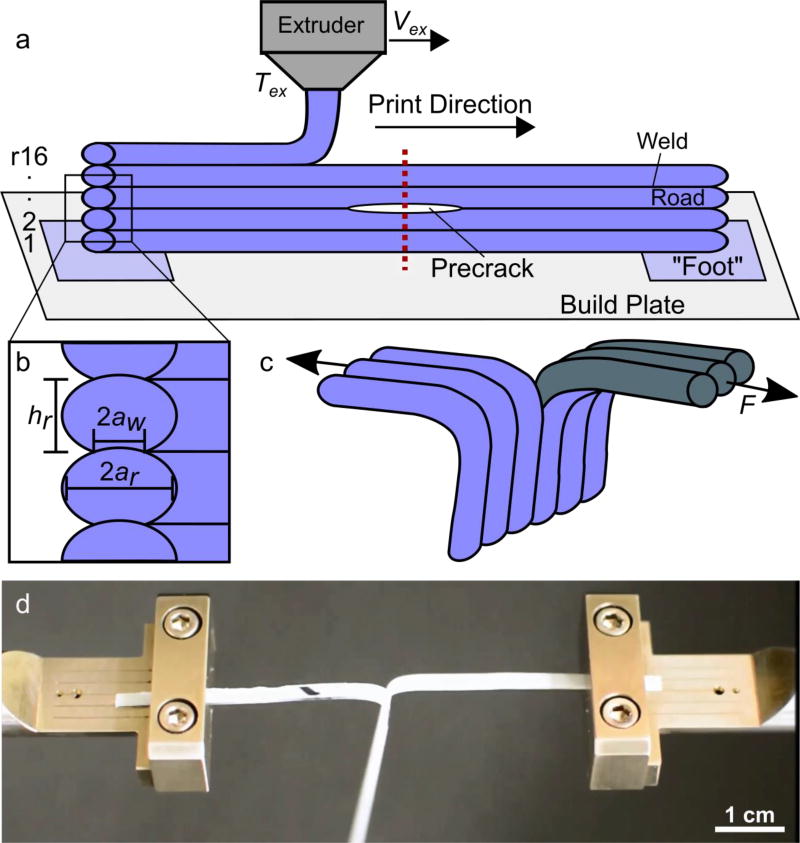
Custom G-code was written to create a constant print director for each layer (positive x). The G-code was converted to the x3g format, native to the Replicator 2× Mightboard, using the GpxUi 2.5.2 utility.[21] Between layers 8 and 9 of each sample, printing was paused for 10 s so that a 25 mm wide piece of polytetrafluoroethylene (PTFE) tape could be draped across the center of the sample. After printing was completed, the tape was carefully removed, leaving behind a pre-crack that served as the initiation site during weld tearing energy testing. The schematic shown in Figure 1 summarizes the sample preparation process.
Figure 1.
Schematic of sample preparation and experimental setup. (a) Single road thick samples were printed with the extruder moving from left to right on each pass. The sequential layers are designated r1–r16 from bottom to top. The dotted vertical line illustrates where each printed sample was cut in half to yield two test specimens. (b) Close up of sample edge shows key length scales and symbols for road height, hr, road width, 2ar, and weld width, 2aw. (c) Typical testing configuration of a single specimen where the two free tabs of the specimen are pulled in parallel but opposite directions, driving crack propagation orthogonal to the applied load, F. (d) Photo of test specimen mounted in tensile grips during testing.
2.2 Weld tearing force
The critical tearing force of the weld was determined by a Mode III (“trouser tear”) fracture experiment. In this technique, the average torsional tearing energy of a long, thin strip of material is ascertained. The experimental geometry and tear testing parameters were modified from the ASTM D1938-14 test method.[22] In this ASTM test method, a small slit or pre-crack is introduced in one of the short ends of the sample and the two resulting tabs are manually separated and clamped in the opposing grips of a standard mechanical testing device. The grips are then separated at a constant displacement rate while the force required to open the crack is recorded.
Mode III fracture was chosen because this fracture mode causes local tearing and is an appropriate test for thin, flat samples such as pressed sheets, fabric, and films. Also, most MatEx-AM welds will be stressed in various directions simultaneously so a local fracture zone is preferable for simulating actual performance and strength. Finally, the Mode III test method is straightforward and can be easily performed with a variety of universal mechanical testing equipment, making it a likely candidate for empirical screening of printing parameters.
For the modified approach presented here, printed samples were carefully cut in half normal to the printing direction so that a 12.5 mm pre-crack was present on one end and a “foot” was present on the other. Layers 1–8 (first tab) and layers 9–16 (second tab) were manually separated, bent apart and clamped into the grips of a uniaxial tensile tester (RSA3, TA Instruments, New Castle, DE) as shown in Figure 1d. Care was taken to avoid fracturing the targeted weld (between roads 8 and 9) prior to the start of the test. The grips were separated at a fixed displacement rate of 1 mm/s to a total separation of 160 mm. During testing, the un-torn portion of each specimen remained orthogonal to the force direction without twisting or rotating as a result of testing. The lack of rotation can be observed more clearly in the video of a representative experiment provided in the Supporting Information. The tearing force was measured directly with a load cell (max load capacity of 35 N).
2.3 Cross-section morphology
To obtain the actual width of the welds resulting from the various extruder temperatures and velocities, cross-sections of representative samples were prepared and imaged with optical microscopy. Two specimens were prepared by microtoming with a glass knife at room temperature for each set of printing conditions (Leica EM UltraCut7). Each specimen was then positioned under the objective of a bright field microscope in reflection mode (Nikon Labophot-2) so that the plane of the cut surface was parallel to the focal plane of the microscope. A small tip-tilt stage was employed to level the cut surface. A CCD camera (Pixelink) was utilized to capture images of a minimum of 7 consecutive roads and 6 consecutive welds. Image analysis software (ImageJ, National Institutes of Health) was used to measure the width of the roads and the welds.
3 Results and Discussion
3.1 Crack-opening force measurement
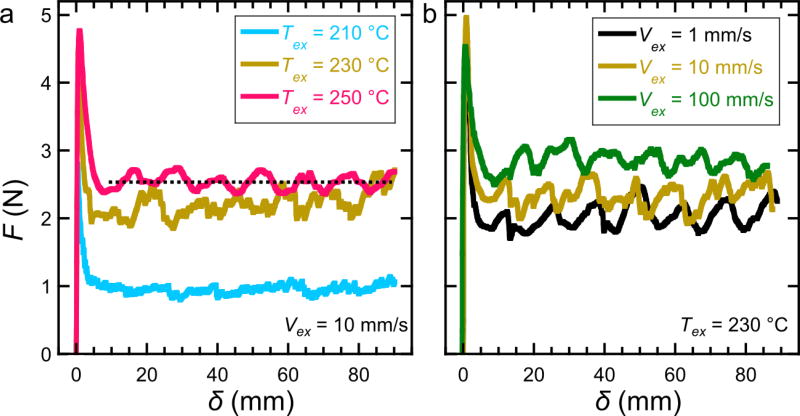
The weld strength of samples prepared through MatEx-AM was measured for a range of extruder velocities, Vex and temperatures, Tex. Note that Vex refers to the rate at which the extruder or printer nozzle translated laterally during printing; in these experiments, the rate that material was extruded from the nozzle was directly proportional to Vex. Figure 2a shows representative results of Mode III tests of ABS MatEx-AM samples printed at three temperatures (Tex = 210 °C, Tex = 230 °C, and Tex = 250 °C) and Vex = 10 mm/s. Figure 2b shows representative results for samples printed at three velocities (Vex = 1 mm/s, Vex = 10 mm/s, and Vex = 100 mm/s) and Tex = 230 °C. The force, F, is plotted as a function of crosshead displacement, δ. The force reaches a maximum to initiate fracture from the precrack. Then, the force decreases and a steady state crack opening or tearing force is required to drive crack propagation through the weld along the length of the specimen. Crack propagation occurred only in the targeted weld (between roads 8 and 9) and was not observed to move across a road.
Figure 2.
Representative force, F, versus crosshead displacement, δ, curves illustrating response of tear testing for samples prepared at various (a) extruder temperatures at a constant extruder velocity (Vex = 10 mm/s) and (b) various extruder velocities at a constant extruder temperature (Tex = 230 °C). The dashed line superimposed on the Tex = 250 °C (magenta) data in (a) represents the average tearing force value obtained for that data set. The values on the y-axis in (a) apply to both plots. The average tear force utilized in calculation of tearing energy is obtained from averaging 5 experimental data sets.
Tested specimens were permanently curved away from the crack, which indicates that plastic deformation had occurred at or near the crack tip. However, the length of the tested specimens was not significantly increased with respect to untested specimens, indicating little to no plastic deformation in the tensile loading direction. Thus, elongation was not considered in the subsequent analysis. Further evidence that tensile elongation did not play a significant role in the tearing energy measurements is that the high crack initiation force was reached very quickly (within 1 mm of crosshead displacement) at the start of each test. Had significant elongation occurred, a much more gradual, lower initial slope would be evident on the force versus displacement plots shown in Figure 2. Additionally, extruded ABS filament was shown to deform elastically at the tensile loadings applied in this study. For more compliant MatEx-AM materials or stronger welds (where the weld strength approaches the plastic yield stress of the material), sample elongation must be accounted for in determining the tearing energy of a weld.[22]
3.2 Weld strength determination
By considering the force values during steady state crack propagation, an average tearing force can be determined for an individual test specimen (illustrated by the dotted line in Figure 2a). A corresponding tearing energy, σT, can be calculated by normalizing the average tearing force by the nominal sample thickness:
where FT is the average tearing force and 2ar is the nominal thickness of the sample measured by image analysis (see Section 2.3).[23] The nominal thickness was 480 µm ±25 µm for all samples. The tearing energy was calculated by taking the average tearing force of 5 to 10 individual specimens for each processing condition. No difference was observed in the tearing energy whether the crack opening direction was parallel or anti-parallel to the print.
3.3 Nominal versus actual tearing energy
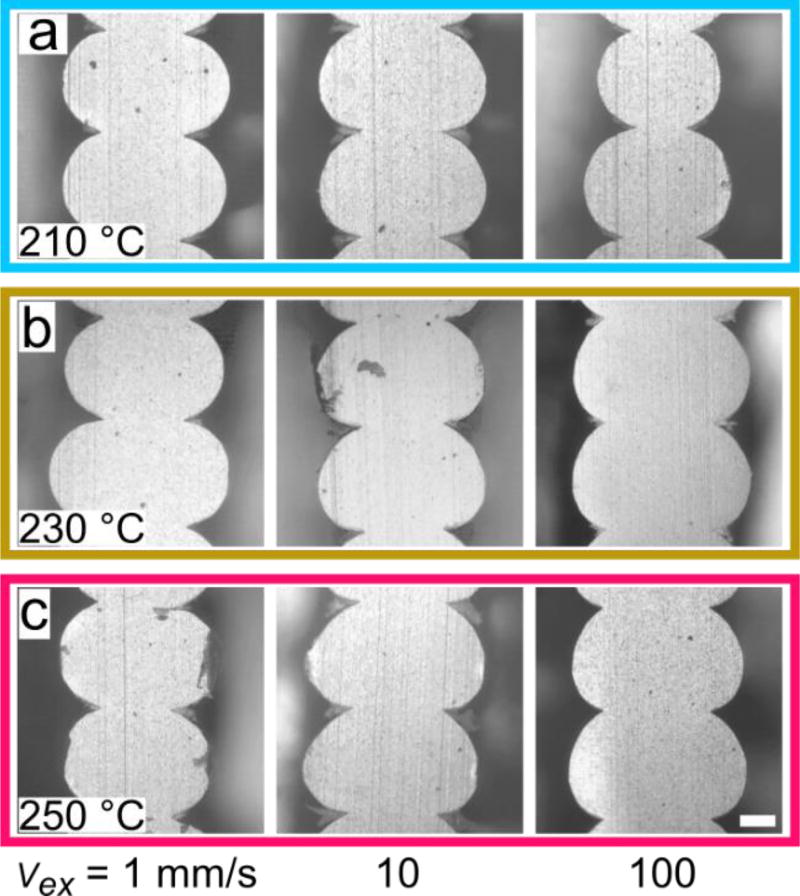
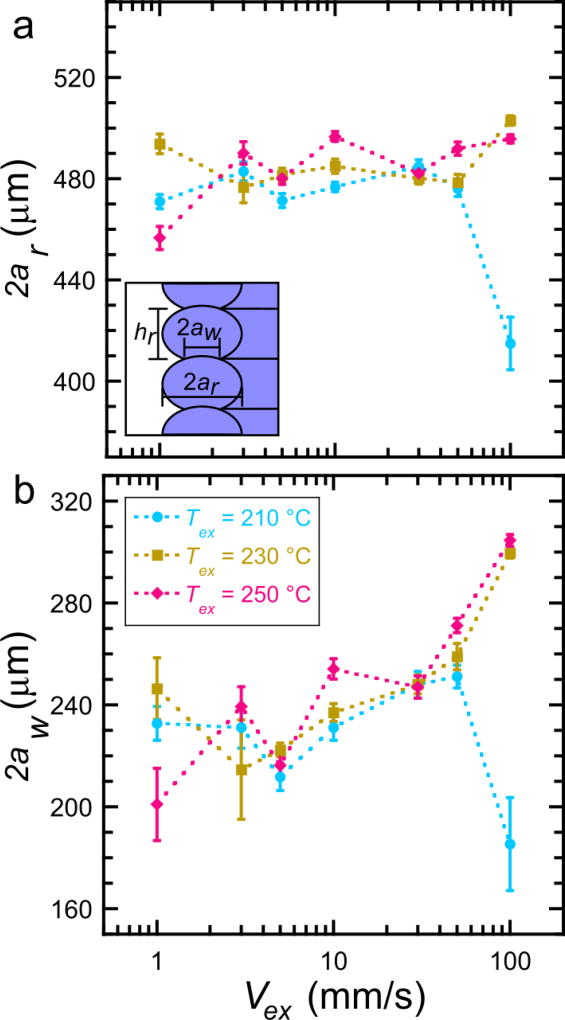
While the use of the nominal sample thickness is more easily measured with calipers or a thickness gauge, it is important to consider the actual thickness of the weld in determining the tearing energy. Cross-sectional images were made by methods described in Section 2.3, and are displayed in Figure 3. Using image analysis software, the relevant thickness, 2aw, was measured and found to vary with both Tex and Vex as shown in Figure 4. In the same analysis, 2ar, was largely independent of either of the printing variables with the notable exception of low temperature, high velocity samples, which all had significantly smaller, more varied road thicknesses. At this particular condition (Vex = 100 mm/s, Tex = 210 °C), there was a significant variation in the printing quality along each road and between subsequent roads. The resulting samples had very low average tearing forces as well. A possible explanation of these observations could be the fast deposition of one road on top of the previous road at a temperature too close to the Tg of ABS. The chains at the interface do not have enough energy/mobility to entangle sufficiently across the interface.
Figure 3.
Representative cross-section images of samples prepared at various processing conditions. Each row of images show samples prepared at (a) Tex = 210 °C, (b) Tex = 230 °C, and (c) Tex = 250 °C. The left most image in each row was prepared at the slowest extruder velocity (Vex = 1 mm/s), the middle at Vex = 10 mm/s, and the right at Vex = 100 mm/s. The scale bar is 100 µm and applies to all images.
Figure 4.
Weld thickness determination by optical microscopy. (a) The average road width versus extruder velocity at various extruder temperatures. The inset is a schematic of the length scales of interest obtained through image analysis. (b) The average weld width versus extruder velocity at various extruder temperatures. Error bars represent one standard deviation. The values on the x-axis and the legend in (b) apply to both plots.
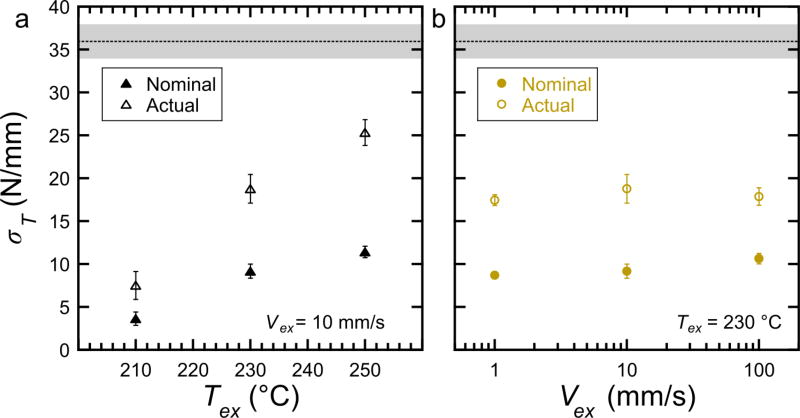
The nominal tearing energy was found to be dependent on Tex, increasing with Tex for most extruder velocities as shown in Figure 5a. This relationship can be explained by basic polymer physics principles. If the extrusion temperature is too low, the polymer chains do not have sufficient thermal mobility to diffuse effectively across the interface between two roads, leading to a weak weld and a low tearing energy. As Tex increases, chain diffusion is increased and polymer chains reptate and entangle more thoroughly across the interface formed between the previous road and the printing road, leading to a stronger weld. The tearing energy was also found to increase very slightly with Vex as shown in Figure 5b. The influence of Tex and Vex on tearing energy will be investigated more thoroughly in the context of printing temperature gradients in a future study.
Figure 5.
Tearing energy, σT, as a function of (a) extruder temperature and (b) extruder velocity. In both figures, filled symbols show the nominal σT while open symbols represent the actual σT averages. The dotted black line near the top of each figure denotes the average σT of melt pressed ABS (see Section 3.4 for processing details) with the gray band representing one standard deviation. Error bars represent one standard deviation. The values on the y-axis in (a) apply to both plots.
Utilizing the different, more accurate film thickness values, the tearing energies of the welds shown in Figure 5 were recalculated. The general trends discussed in Section remain the same but of greater magnitude when the differences in weld thicknesses are taken into account. By measuring the actual geometry of the cross-section for a given sample, the accuracy of the tearing energy measurement can be improved.
3.4 MatEx-AM weld tear strength versus bulk tear strength
The strength of MatEx-AM produced parts is typically lower than that of traditionally manufactured materials formed through molding and/or extrusion.[15] To quantify the difference in the tearing energy of ABS MatEx-AM welds with respect to bulk ABS, portions of ABS printing filament were melt pressed to a thickness of 250 µm (representative of the average actual weld thickness determined by optical microscopy (Figure 3)). The tearing energy of these melt pressed films was determined by Mode III fracture using the same experimental testing conditions described in Section 2.2. The dotted line and gray band in each plot in Figure 5 is the average tearing energy and one standard deviation, respectively, taken from five tearing energy experiments performed on the melt pressed ABS films. The average bulk tearing energy was 35.9 N/mm with a standard deviation of 2.1 N/mm. The nominal tearing energy of the MatEx-AM welds ranged from 10 % to 35 % of the bulk tearing energy while the actual tearing energy ranged from 20 % to 70% as shown by the dotted lines on both plots in Figure 5.
4 Conclusions
A facile method for the direct measurement of the strength of welds in material extrusion additive manufactured parts has been presented. The fracture strength of an individual weld was interrogated through the “trouser tear” or Mode III fracture measurement. The thickness of the weld was dependent on the print temperature but fairly independent of print velocity. By accounting for the weld thickness of each printed sample, the actual weld strength was determined. The print temperature and velocity also impacted the actual weld strength. The maximum weld strength was found to occur in samples prepared at the highest extruder temperature of 250 °C and at the fastest extruder velocity. This measurement technique is a straightforward, rapid method for determining the weld strength of a commercial ABS part produced through MatEx-AM. These methods can be applied as a way to quickly assess the impact of MatEx-AM processing parameters on the mechanical strength of the welds. Additionally, this trouser tear method can be used to optimize processing parameters and for fundamental studies of the critical factors that lead to development of weld strength.
Supplementary Material
Acknowledgments
The authors wish to thank K.B. Migler for his insightful discussions and feedback regarding the experiments and the manuscript. Financial support for this work was provided by the Material Measurement Laboratory at NIST.
Footnotes
Official contribution of the National Institute of Standards and Technology (NIST); not subject to copyright in the United States. The full description of the procedures used in this article requires the identification of certain commercial products and their suppliers. The inclusion of such information should in no way be construed as indicating that such products or suppliers are endorsed by NIST or are recommended by NIST or that they are necessarily the best materials, instruments, software or suppliers for the purposes described.
References
- 1.Stratasys, Stratasys Chosen by Airbus to Produce 3D Printed Parts for A350 XWB, Press Release. [accessed October 14, 2016];2015 http://blog.stratasys.com/2015/05/06/airbus-3d-printing/
- 2.Wohlers T, Caffrey T. Wohlers Report 2015: 3D Printing and Additive Manufacturing State of the Industry Annual Worldwide Progress Report. 2014 [Google Scholar]
- 3.Bourell DL. Perspectives on Additive Manufacturing. Annu. Rev. Mater. Res. 2016;46:1–18. doi: 10.1146/annurev-matsci-070115-031606. [DOI] [Google Scholar]
- 4.Campbell I, Bourell D, Gibson I. Editorial Additive manufacturing : rapid prototyping comes of age. Emerald. 2012;18:255–258. doi: 10.1108/13552541211231563. [DOI] [Google Scholar]
- 5.Ahn S, Montero M, Odell D, Roundy S, Wright PK. Anisotropic material properties of fused deposition modeling ABS. Rapid Prototyp. J. 2002;8:248–257. doi: 10.1108/13552540210441166. [DOI] [Google Scholar]
- 6.Forster AM. Materials Testing Standards for Additive Manufacturing of Polymer Materials. Nist.Ir.8059. 2015 doi: http://dx.doi.org/10.6028/NIST.IR.8059.
- 7.Coogan TJ, Kazmer DO. Bond and part strength in fused deposition modeling. Rapid Prototyp. J. 2017;23 doi: 10.1108/RPJ-03-2016-0050. [DOI] [Google Scholar]
- 8.Wohlers T. 2014. Wohlers Report 2014. 3D Printing and Additive Manufacturing State of the Industry. doi: [Google Scholar]
- 9.Newswire PR. 3D Printing Materials 2015–2025: Status, Opportunities. Market Forecasts. 2015 http://search.ebscohost.com/login.aspx?direct=true&db=bwh&AN=201503171818PR.NEWS.USPR.BR57577&lang=pt-br&site=ehost-live.
- 10.3D Printing Market Watch - Q4 2015. [accessed January 1, 2016];Aniwaa Beta. 2015 http://www.aniwaa.com/3d-printing-market-watch-q4-2015/
- 11.Bellini A, Güçeri S. Mechanical characterization of parts fabricated using fused deposition modeling. Rapid Prototyp. J. 2003;9:252–264. doi: 10.1108/13552540310489631. [DOI] [Google Scholar]
- 12.Hill N, Haghi M. Deposition direction-dependent failure criteria for fused deposition modeling polycarbonate. Rapid Prototyp. J. 2014;20:221–227. doi: 10.1108/RPJ-04-2013-0039. [DOI] [Google Scholar]
- 13.Spackman CC, Frank CR, Picha KC, Samuel J. 3D printing of fiber-reinforced soft composites: Process study and material characterization. J. Manuf. Process. 2015;23:296–305. doi: 10.1016/j.jmapro.2016.04.006. [DOI] [Google Scholar]
- 14.Torrado AR, Shemelya CM, English JD, Lin Y, Wicker RB, Roberson DA. Characterizing the effect of additives to ABS on the mechanical property anisotropy of specimens fabricated by material extrusion 3D printing. Addit. Manuf. 2015;6:16–29. doi: 10.1016/j.addma.2015.02.001. [DOI] [Google Scholar]
- 15.Dawoud M, Taha I, Ebeid SJ. Mechanical behaviour of ABS: An experimental study using FDM and injection moulding techniques. J. Manuf. Process. 2016;21:39–45. doi: 10.1016/j.jmapro.2015.11.002. [DOI] [Google Scholar]
- 16.Fodran E, Koch M, Menon U. Mechanical and dimensional characteristics of fused deposition modeling build styles. Solid Free. Fabr. Proceedings, Sept. 1996. 1996 Aug;:419–442. [Google Scholar]
- 17.Torrado AR, Roberson DA. Failure Analysis and Anisotropy Evaluation of 3D-Printed Tensile Test Specimens of Different Geometries and Print Raster Patterns. J. Fail. Anal. Prev. 2016;16:154–164. doi: 10.1007/s11668-016-0067-4. [DOI] [Google Scholar]
- 18.Hillborg H, Tomczak N, Olàh A, Schönherr H, Vancso GJ, Ola A, Scho H, Vancso GJ. Nanoscale Hydrophobic Recovery : A Chemical Force Microscopy Study of UV / Ozone-Treated Cross-Linked Poly (dimethylsiloxane) Symp. A Q. J. Mod. Foreign Lit. 2004;20:785–794. doi: 10.1021/la035552k. http://www.ncbi.nlm.nih.gov/pubmed/15773106. [DOI] [PubMed] [Google Scholar]
- 19.Torrado Perez AR, Roberson DA, Wicker RB. Fracture surface analysis of 3D-printed tensile specimens of novel ABS-based materials. J. Fail. Anal. Prev. 2014;14:343–353. doi: 10.1007/s11668-014-9803-9. [DOI] [Google Scholar]
- 20.Ziemian C, Sharma M, Ziemian S. Anisotropic mechanical properties of ABS parts fabricated by fused deposition modelling. Mech. Eng. 2012:159–180. doi: 10.5772/34233. [DOI] [Google Scholar]
- 21.GitHub, Inc. [accessed October 20, 2016];2015 https://github.com/
- 22.ASTM D 1004 - 3, Standard Test Method for Propagation Tear Resistance of Plastic Film and Thin Sheeting. 2003;i:1–7. doi: 10.1520/D1922-09.2. [DOI] [Google Scholar]
- 23.Griffith AA. The Phenomena of Rupture and Flow in Solids. Philos. Trans. R. Soc. A Math. Phys. Eng. Sci. 1921;221:163–198. doi: 10.1098/rsta.1921.0006. [DOI] [Google Scholar]
Associated Data
This section collects any data citations, data availability statements, or supplementary materials included in this article.


