

Summary
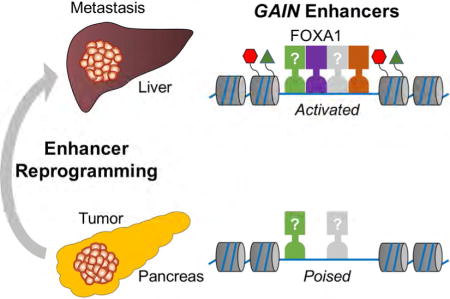
Pancreatic ductal adenocarcinoma (PDA) is one of the most lethal human malignancies, owing in part to its propensity for metastasis. Here, we used an organoid culture system to investigate how transcription and the enhancer landscape become altered during discrete stages of disease progression in a PDA mouse model. This approach revealed that the metastatic transition is accompanied by massive and recurrent alterations in enhancer activity. We implicate the pioneer factor FOXA1 as a driver of enhancer activation in this system, a mechanism that renders PDA cells more invasive and less anchorage-dependent for growth in vitro, as well as more metastatic in vivo. In this context, FOXA1-dependent enhancer reprogramming activates a transcriptional program of embryonic foregut endoderm. Collectively, our study implicates enhancer reprogramming, FOXA1 upregulation, and a retrograde developmental transition in PDA metastasis.
Graphical Abstract
Introduction
Pancreatic ductal adenocarcinoma (PDA) is the fourth leading cause of cancer deaths in the United States, owing in part to its early onset of metastasis. Most PDA patients will already have metastases at the time of diagnosis, a point in which surgical or chemotherapeutic interventions have minimal benefit (Ryan et al., 2014). Consequently, the prognosis for PDA patients is dismal, with only 8% of patients surviving more than 5 years after diagnosis (Siegel et al., 2017). One obstacle underlying these clinical challenges is our limited understanding of molecular mechanisms of PDA metastasis, in particular with regard to the origin of metastatic traits.
Unlike the deep understanding of mutational mechanisms that initiate PDA, a genetic basis for metastasis in this disease is unclear. The initiating genetic event in most PDA patients is an activating mutation of KRAS in an acinar or ductal cell, which is sufficient to initiate a pre-malignant (also known PanIN; pancreatic intraepithelial neoplasia) lesion of disorganized epithelial architecture. Subsequent inactivating mutations of tumor suppressor genes (e.g. TP53) are sufficient to drive tumor formation at the primary site, a finding supported by genetically engineered mouse models (GEMMs) of PDA (Guerra and Barbacid, 2013). In contrast, a recurrent metastasis-specific mutation has yet to be identified (Campbell et al., 2010; Makohon-Moore et al., 2017; Yachida et al., 2010). It has been proposed that fluctuations of gene expression or signal transduction among cells within the primary tumor are critical for the acquisition of metastatic potential (Neureiter et al., 2014). Candidate metastasis-promoting mechanisms include signaling cues from the tumor microenvironment, as well as pathways regulating self-renewal and epithelial-to-mesenchymal transitions (EMT) (Kong et al., 2011; Krebs et al., 2017; Ohlund et al., 2014).
Alteration of epigenetic pathways is an emerging mechanism of PDA progression. Whole-genome sequencing studies have identified inactivating mutations of chromatin modifiers as frequent genetic events in PDA tumors (Waddell et al., 2015). In addition, small-molecules that target readers, writers, or erasers of histone modifications have shown promising therapeutic effects in mouse models of PDA by altering transcription of cancer genes (Hessmann et al., 2017). A recent study has shown that disruption of large heterochromatin domains is associated with the metastatic transition in PDA, as a consequence of aberrant oxidative pentose phosphate metabolism (McDonald et al., 2017). However, the direct functional evidence that links chromatin regulation to PDA metastasis remains limited.
Enhancers are a class of regulatory DNA elements composed of clusters of transcription factor (TF) binding sites, which are uniquely capable of stimulating transcription over large genomic distances (Spitz and Furlong, 2012). At enhancers, TFs trigger the recruitment of chromatin modifying enzymes to establish a stereotypical pattern of covalent histone modifications on adjacent nucleosomes, such as histone H3 lysine 27 acetylation (H3K27ac) and histone H3 lysine 4 mono-methylation (H3K4me1) (Long et al., 2016). As a result, genome-wide measurements of H3K27ac and H3K4me1 enrichment using chromatin immunoprecipitation (ChIP-seq) or chromatin accessibility (e.g. using the Assay for Transposase-Accessible Chromatin [ATAC-seq]) allow for the annotation of active enhancer landscapes in different cellular states (Yue et al., 2014). One study has applied ChIP-seq analysis to human PDA cell lines to expose enhancer profiles and TFs that correlate with the degree of epithelial differentiation, or disease ‘grade’ (Diaferia et al., 2016). However, it has yet to be determined how the enhancer landscape evolves during each stage of PDA progression.
We recently developed an organoid culture model of PDA, which preserves the unique biological characteristics of normal, PanIN, tumor, and metastatic lesions and allows for direct biochemical comparisons during each stage of disease progression (Boj et al., 2015; Chio et al., 2016). Here, we used this system to characterize how the enhancer landscape evolves during PDA progression and identified dramatic changes in enhancer activity associated with metastasis. We implicate the developmental TF FOXA1 in promoting aberrant enhancer activation in this setting, which we show can promote metastatic phenotypes in vivo. Collectively, our findings suggest that reprogramming of the enhancer landscape can promote the acquisition of metastatic traits.
Results
Paired Tumor- and Metastasis-derived Organoids Provide a Model to Study Mechanisms of PDA Progression
We previously demonstrated that normal and neoplastic pancreatic ductal cells can be cultured as organoids, which retain the attributes of the stage of PDA from which they were derived when re-introduced into mice (Boj et al., 2015). We hypothesized that epigenomic comparisons of organoid cultures might reveal mechanisms that promote PDA progression. To carry out this study, we expanded our collection of pancreatic organoids derived from autochthonous primary tumors (T) and paired metastases (M) from the KPC (Kras+/LSL-G12D; Trp53+/LSL-R172H; Pdx1-Cre) GEMM of PDA (Figure 1A). Matched primary tumor and metastatic lesions were excised from the liver, peritoneum, or diaphragm of six independent KPC mice, and organoids were prepared (Figure 1B and S1A). Consistent with our prior observations, all of the M organoids have lost the remaining wild-type Trp53 allele, which is common for disease progression in this system (Figure S1B) (Boj et al., 2015).
Figure 1. Paired Tumor- and Metastasis-derived Organoids Provide a Model to Study Mechanisms of PDA Progression.
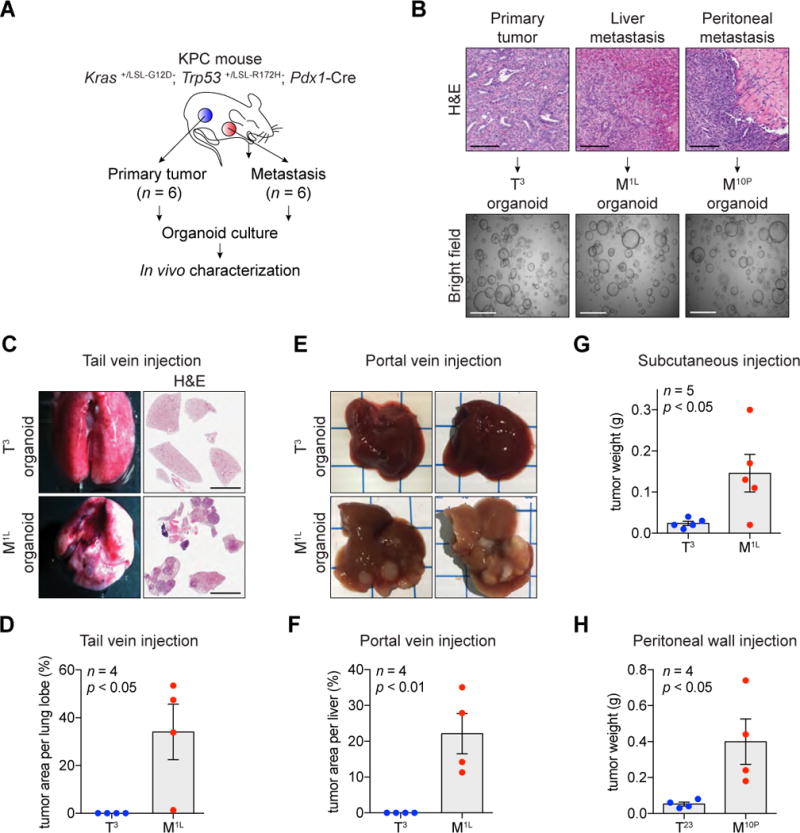
(A) Schematic diagram demonstrating establishment of paired primary tumor- and metastasis-derived organoid cultures from the KPC mouse model of pancreatic cancer.
(B) Hematoxylin and eosin (H&E) staining of murine primary tumor and metastases derived from KPC mice (top) and bright field images of established organoids (bottom). Scale bars, 100 μm (top) and 1 mm (bottom).
(C and D) Representative bright field images (C, left) and H&E staining (C, right) of lung and quantification (D) 2 months after tail vein injection of T3 and M1L organoids (5 × 10⁵ cells per each injection, n = 4) in C57Bl/6J mice. Scale bars, 5 mm.
(E and F) Representative bright field images (E) and quantification (F) one month after portal vein injection of T3 and M1L organoids (5 × 10⁵ cells per each injection, n = 4) in C57Bl/6J mice.
(G) Quantification of subcutaneous tumors 6 weeks after injection of T3 and M1L organoids (5 × 10⁵ cells per each injection, n = 5) in C57Bl/6J mice.
(H) Quantification of tumor weight 4 weeks after peritoneal wall injection of T23 and M10P organoids (5 × 10⁵ cells per each injection, n = 4) in C57Bl/6J mice.
For bar charts, each dot represents a mouse and the mean +/- SEM is shown. p-value was determined by Student’s t-test.
See also Figure S1.
We evaluated whether pairs of T and M organoids derived from the same animal retain their respective disease properties when re-transplanted into mice. When injected orthotopically into the pancreas, a single-cell suspension of M organoids formed macroscopic tumors within 4 weeks associated with metastatic spread, whereas T organoids required 3–4 months to form PDA with metastases (Figure S1C). In addition, when injected into the tail vein of mice, cells from M organoids readily colonized the lung parenchyma within 9 weeks, whereas cells from T organoids lacked this capability (Figure 1C–D and S1D). After portal vein or intra-splenic injection, M organoid cells colonized the liver more efficiently than T organoid cells, and grew more readily when injected into the peritoneal wall and subcutaneous space (Figure 1E–H and S1E–H). Collectively, these findings indicate that M organoids have evolved to a more aggressive state than their paired T organoids, and hence comparisons of these cultures might expose mechanisms that promote metastasis.
Epigenomic Analysis of PDA Organoids Identifies Recurrent Changes in Enhancer Activity Associated with the Metastatic Transition
RNA-seq profiling of the organoid culture series revealed overlapping transcriptional changes to those observed in a prior microarray evaluation of human PDA samples (Moffitt et al., 2015), including upregulation of known regulators of PDA metastasis, Lin28b, Pdgfrb, and Runx3 (Figure S2A–B) (Kugel et al., 2016; Weissmueller et al., 2014; Whittle et al., 2015). To evaluate how the enhancer landscape becomes altered during PDA progression, we profiled genome-wide enrichment of H3K27ac in organoid cultures derived from two normal pancreatic ducts (hereafter referred to as N), two PanIN lesions (hereafter referred to as P, from the Kras+/LSL-G12D; Pdx1-Cre mice), and the 6 pairs of T and M organoids described above. We performed a global analysis to identify all genomic intervals with greater than 10-fold changes in H3K27ac in any of the P, T, or M organoid cultures relative to the N organoids (Figure 2A). While the global level of H3K27ac was similar across these samples, our analysis recovered 857 regions with increased and 1,709 regions with decreased H3K27ac, which we hereafter refer to as GAIN and LOSS regions, respectively (Figure 2A and S2C). These acetylation changes were almost exclusively identified in the M organoids and occurred in a recurrent manner across the six independent samples, irrespective of the anatomic site of the metastatic lesion (Figure 2B–C and S2C–G). An unsupervised hierarchical clustering analysis of global H3K27ac enrichment further supported the epigenomic divergence of M organoids from earlier stages of disease, as well as the convergence of the six M organoids with one another (Figure 2D). This analysis suggests that the metastatic transition in the KPC model is accompanied by dramatic and recurrent changes in H3K27 acetylation.
Figure 2. Massive enhancer reprogramming accompanies the metastatic transition.
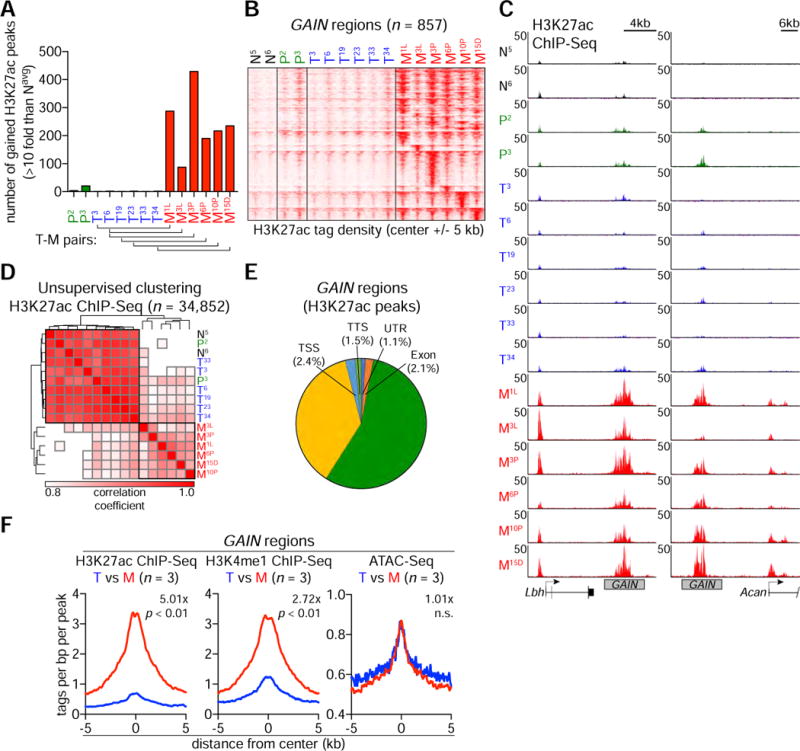
(A) Distribution of gained H3K27ac peaks across the indicated P, T and M organoids. From a total of 34,852 H3K27ac ChIP-seq peaks, gained H3K27ac peaks are defined by more than 10-fold increase of H3K27ac signal relative to the average of N5 and N6 (Navg). Bottom brackets indicate the pairs of matching T and M organoids.
(B) Heatmap representation of GAIN regions based on H3K27ac occupancy in organoids. The 857 GAIN regions were identified from the union of all gained H3K27ac peaks described in Figure 2A. 10-Kb around the center of GAIN regions are displayed for each organoid. Each row represents a single region (n = 857). Each column represents an individual organoid (n = 16).
(C) Representative H3K27ac ChIP-seq profiles of GAIN regions at Lbh and Acan loci in N, P, T and M organoids.
(D) Heatmap representation of unsupervised hierarchical clustering based on H3K27ac occupancy at total H3K27ac ChIP-seq peaks. Samples were clustered based on Spearman correlation coefficient with average linkage.
(E) Pie chart showing the genomic annotations of 857 GAIN regions according to the location of a given peak. TSS, ‘−1-kb to +100-bp’ of transcription start sites. TTS, ‘−100-bp to +1-Kb’ of transcription termination sites. UTR includes both 5′ and 3′ UTRs.
(F) Metagene representation of the mean ChIP-seq signal for the indicated histone marks (left and middle) or the mean ATAC-seq signal (right) across GAIN regions in the indicated organoids. Metagenes are centered on the middle of GAIN regions and 10-Kb around the center of GAIN regions are displayed. To compare relative signal changes (denoted as value-x), the mean signal of each biological replicate was determined by averaging signals of 2-Kb (H3K27ac or H3K4me1 ChIP-seq) or 1-Kb (ATAC-seq) around the center of GAIN regions. p-value was determined by Kolmogorov–Smirnov test.
More than 90% of GAIN and LOSS regions lie outside of promoter regions and correlate with expression changes of nearby genes, suggesting they represent enhancer elements (Figure 2E and S2H–I). We focused our subsequent analysis on GAIN regions, which we hypothesized might have a role in promoting PDA progression and metastasis. While GAIN regions were defined in murine samples, we found that H3K27ac was enriched at the corresponding locations in human PDA cell lines and in patient-derived PDA organoids (Figure S2J). To further validate that GAIN regions are active enhancer elements, we profiled two other enhancer-associated chromatin features in three pairs of T and M organoids: H3K4me1 using ChIP-seq and chromatin accessibility using ATAC-seq. As expected, GAIN regions were enriched for H3K27ac, H3K4me1, and chromatin accessibility in M organoids (Figure 2F and S2K–M, red line). While H3K27ac and H3K4me1 were increased when comparing T to M organoids, we noted that chromatin accessibility pre-existed at these sites in all four types of organoids (Figure 2F and S2K). This suggests that GAIN regions exist in a ‘poised’ state of accessibility in normal ductal cells (Zentner and Scacheri, 2012). An ontology analysis of genes located near GAIN regions revealed a significant association with developmental functions, with the most enriched signature being related to tube development (Figure S2N). While EMT is a known developmental pathway associated with metastasis (Ye and Weinberg, 2015), our RNA-seq analysis did not identify consistent changes in EMT genes (Figure S2O).
Elevated FOXA1 Expression and Occupancy is Associated with PDA Metastasis and GAIN Enhancer Activation
We reasoned that identifying TFs that activate GAIN enhancers would allow us to determine whether these cis elements are functionally important for PDA metastasis. To this end, we evaluated whether specific TF motifs were enriched within GAIN regions using the TRAP algorithm (Thomas-Chollier et al., 2011). The top enriched motifs at GAIN regions included binding sites for the AP1, SOX, Forkhead families of TFs (Figure 3A and S3A). We focused on the Forkhead family TF FOXA1, as we noted in our RNA-seq analysis of organoids that Foxa1 was upregulated in M organoids, while its homolog Foxa2 was down-regulated (Figure 3B and S3B–C). In addition, we identified a GAIN enhancer at the Foxa1 locus (Figure S3B). In accordance with our motif analysis, ChIP-seq analysis of FOXA1 confirmed its elevated occupancy at GAIN regions in M organoids (Figure 3C–D and S3D). An RNA fluorescence in situ hybridization (RNA-FISH) analysis in the KPC mice revealed sporadic regions of focal Foxa1 upregulation in primary PDA tumors (Figure 3E, white arrows), which became homogeneously upregulated in metastatic lesions (Figure 3E). These findings implicate FOXA1 in GAIN enhancer activation.
Figure 3. Elevated FOXA1 Expression and Occupancy is Associated with PDA Metastasis and GAIN Enhancer Activation.
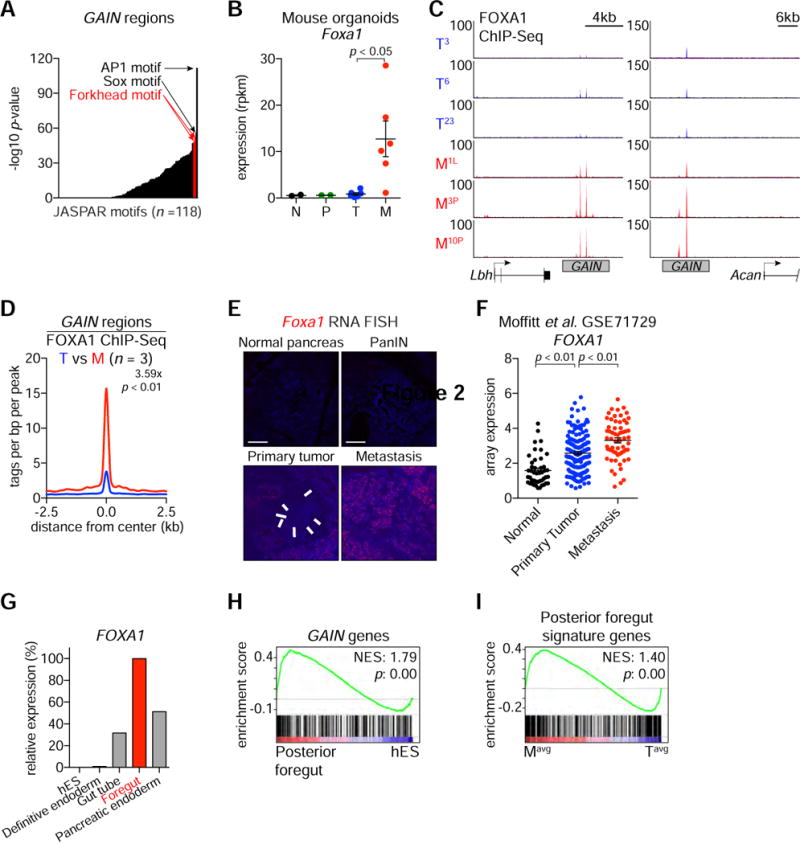
(A) Representation of motifs enriched at GAIN regions. Mouse promoters were used as the comparison library. p-values correspond to the corrected p in the output. AP1 motif is ranked first; SOX motif is ranked second; FOXD1 and FOXA2 motifs are ranked third and fourth, respectively. Position weight matrices for FOXD1 and FOXA2 are represented as Forkhead motifs.
(B) RNA-seq based Foxa1 mRNA expression in organoids. Each dot represents an independent organoid culture and the mean +/− SEM is shown. p-value was determined by Student’s t-test. N, normal; P, PanIN; T, primary tumor; M, metastasis; rpkm, reads per kilobase per million mapped reads.
(C) Representative FOXA1 ChIP-seq profiles of GAIN regions at Lbh and Acan loci in the indicated organoids.
(D) Metagene representation of the mean FOXA1 ChIP-seq signal across GAIN regions in the indicated organoids. The mean signal of each biological replicate was determined by averaging signals of 1-Kb around the center of the indicated regions. p-value was determined by Kolmogorov–Smirnov test.
(E) RNA fluorescence in situ hybridization (RNA-FISH) of the indicated tissue sections including diaphragm metastasis from KPC mice using a Foxa1-specific probe (red). Two independent KPC primary tumor and metastatic lesions were examined. White arrows indicate areas of focal Foxa1 mRNA expression in primary PDA tumors. Counterstain, DAPI (blue). Scale bars, 100 μm.
(F) Microarray based FOXA1 mRNA expression in publicly available PDA patient data. Each dot represents individual patient. The mean +/− SEM is shown. p-values were determined by Student’s t-test.
(G) FOXA1 expression during pancreatic differentiation of human embryonic stem cells (hES) relative to foregut stage.
(H) Gene set enrichment analysis (GSEA) of posterior foregut versus hES RNA-seq using a signature of GAIN genes. Normalized enrichment score (NES) and nominal p-value (p) were provided according to GSEA.
(I) GSEA of averaged six M (Mavg) versus averaged six T (Tavg) RNA-seq using posterior foregut signature genes.
We next evaluated whether FOXA1 upregulation occurs during human PDA progression. In a prior microarray study of human PDA samples (Moffitt et al., 2015), we identified FOXA1 upregulation in primary tumors, which became further elevated in metastatic lesions (p < 0.01) (Figure 3F). We confirmed this overall pattern of FOXA1 upregulation by RT-qPCR analysis of human PDA organoids and by immunohistochemical staining of PDA tissue derived from a rapid autopsy program (Figure S3E–G). In addition, levels of FOXA1 expression were correlated with the degree of GAIN enhancer activation in human PDA cell lines (Figure S2J) (Diaferia et al., 2016). These results validate that FOXA1 upregulation occurs during human PDA progression.
FOXA proteins are pioneer factors that are essential for the specification of foregut cell fates from primitive endoderm tissues during embryonic development (Figure 3G) (Zaret et al., 2016). Using published datasets, we found that GAIN regions/genes became activated during the differentiation of human embryonic stem cells into foregut endoderm (Figure 3H–I and S3H–I) (Loh et al., 2014; Xie et al., 2013). These findings raised the possibility that FOXA1 upregulation during PDA progression activates an embryonic foregut endoderm transcriptional program.
FOXA1 Overexpression Promotes GAIN Enhancer Activation and Metastasis-related Phenotypes in murine and human PDA Cell Lines
Prior studies have associated low FOXA1 expression with the acquisition of mesenchymal features in PDA cell lines (Diaferia et al., 2016; Song et al., 2010). However, no study to date has evaluated the functional consequences of FOXA1 upregulation in PDA. We initially investigated this in vitro using a 2D cell line derived from a T organoid (hereafter referred to as KPC-2D cells), which allowed us to perform in vitro assays of metastatic potential. Adaptation of T organoids to 2D cultures selects for cells with loss of the wild-type Trp53 allele (Boj et al., 2015), as well as for modest increases in FOXA1 expression and H3K27ac enrichment at GAIN regions (Figure S4A–B). However, CRISPR-based inactivation of Trp53 in T organoids was insufficient to cause FOXA1 upregulation and GAIN enhancer activation, indicating that p53 loss and enhancer reprogramming occur independently during PDA progression (Figure S4C–G).
Since GAIN enhancers in KPC-2D cells exist in a partially activated state, we evaluated whether these elements could be fully activated by FOXA1 overexpression. Retroviral transduction of KPC-2D cells with the FOXA1 cDNA led to increased FOXA1 occupancy and H3K27ac disproportionately at GAIN regions (Figure 4A–B and S4H). RNA-seq analysis showed that FOXA1 expression caused an increase in the expression of GAIN genes and of a foregut endoderm gene signature (Figure 4C). When cultured as a 2D monolayer, we found that FOXA1 expression had no effect on cell proliferation, clonogenic growth, or cell migration (Figure S4I–K). However, when cultured as tumor spheres on ultra-low adhesion plates, FOXA1 expression enhanced anchorage-independent growth (Figure 4D). FOXA1-overexpressing KPC-2D cells were also more invasive when placed in Matrigel-coated Boyden chamber assays (Figure 4E). When injected via tail vein into recipient mice, FOXA1 also enhanced the ability of KPC-2D cells to colonize the lung parenchyma (Figure 4F). We observed enhanced tumor sphere formation when overexpressing FOXA1 in human PDA cell lines, which paralleled an increase in H3K27ac at GAIN regions and transcriptional activation of foregut development genes (Figure 4G–J and S4L). These results show that FOXA1 overexpression in PDA cell lines promotes GAIN enhancer activation and the acquisition of metastatic phenotypes.
Figure 4. FOXA1 Promotes Enhancer activation and Metastatic Capabilities in 2D PDA Cell Lines.
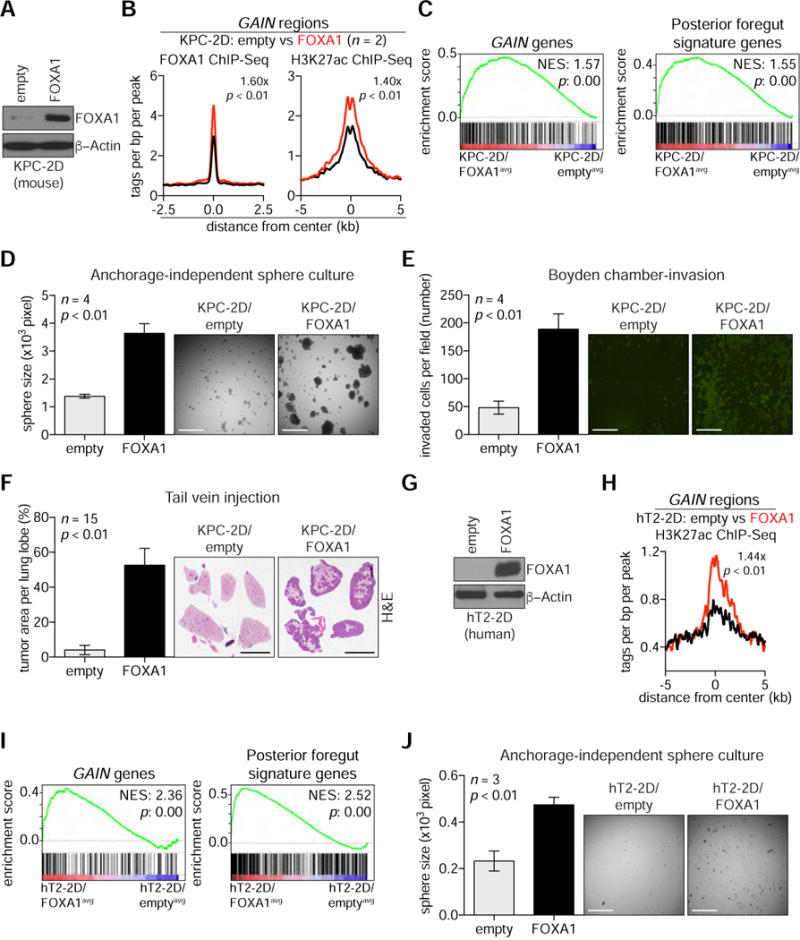
(A) Western blot analysis with the indicated antibodies and whole cell lysates prepared from KPC-2D cells stably expressing FOXA1 cDNA (KPC-2D/FOXA1) or control (KPC-2D/empty).
(B) Metagene representation of the mean FOXA1 (left) or H3K27ac (right) ChIP-seq signal across GAIN regions in the indicated organoids. The mean signal of each biological replicate was determined by averaging signals of 1-Kb (FOXA1) or 2-Kb (H3K27ac) around the center of the indicated regions. p-value was determined by Kolmogorov–Smirnov test.
(C) GSEA of averaged KPC-2D/FOXA1 (FOXA1avg) versus averaged KPC-2D/empty (emptyavg) RNA-seq using GAIN genes (left), and posterior foregut signature genes (right).
(D) Anchorage-independent sphere formation assay of KPC-2D/empty and KPC-2D/FOXA1 cells (n = 4). Bright field images were taken from 4x field after 2 weeks of culture and the size of spheres were measured for quantification. The mean +/− SEM is shown and p-value was determined by Student’s t-test. Scale bars, 500 μm.
(E) Boyden-chamber invasion assay of KPC-2D/empty and KPC-2D/FOXA1 cells (n = 4). Invaded cells were stained with Syto13 (GFP) 24 hours after cell seeding. Fluorescent microscopic images were taken from 4× field (right) to quantify the number of invaded cells (left). The mean +/− SEM is shown and p-value was determined by Student’s t-test. Scale bars, 500 μm.
(F) Tail vein injection of KPC-2D/empty and KPC-2D/FOXA1 cells (2.5 × 10⁵ cells) into C57Bl/6J mice to assess lung colonization at 4 weeks post-injection. Representative images of H&E staining are shown (right). Percent tumor area per lung lobe (%) was determined by dividing the whole surface area of the largest lung lobe with lung tumor area of the given lobe. The mean +/− SEM is shown and p-value was determined by Student’s t-test (n = 15). Scale bars, 5 mm.
(G) Western blot analysis with the indicated antibodies and whole cell lysates prepared from hT2-2D cells stably expressing FOXA1 cDNA (hT2-2D/FOXA1) or control (hT2-2D/empty).
(H) Metagene representation of H3K27ac ChIP-seq signal across GAIN regions in hT2-2D cells. The mean signal of each biological replicate was determined by averaging signals of 2-Kb H3K27ac around the center of the indicated regions. p-value was determined by Kolmogorov– Smirnov test.
(I) GSEA of hT2-2D/FOXA1 versus hT2-2D/empty using a signature of GAIN genes (left) and posterior foregut signature genes (right). Normalized enrichment score (NES) and nominal p-value (p) were provided according to GSEA.
(J) Anchorage-independent sphere formation assay of hT2-2D/empty and hT2-2D/FOXA1 cells (n = 3). Bright field images were taken from 4x field after 2 weeks of culture and the size of spheres were measured for quantification. The mean +/− SEM is shown and p-value was determined by Student’s t-test. Scale bars, 500 μm.
FOXA1-mediated Enhancer Reprogramming Promotes PDA Progression in an Organoid Transplantation Model
We next considered whether FOXA1 upregulation was sufficient for the entirety of GAIN enhancer activation observed in M organoids. To this end, we retrovirally overexpressed FOXA1 in two independent T organoids (T3 and T23) and carried out H3K27ac ChIP-seq. We observed that FOXA1 expression only elevated H3K27ac to ~25% of the level observed in matched M organoids (Figure 5A–B and S5A). This result led us to search for other candidate TFs that might cooperate with FOXA1 to promote enhancer activation. Our TRAP analysis of FOXA1 peaks and GAIN regions revealed an association with motifs recognized by GATA5, BATF2, PRRX2, and PAX9, which are each upregulated at the transcriptional level in M organoids and to varying degrees in human PDA samples (Figure S3A and S5B–D). We also found that LOSS regions were enriched for a motif recognized by ONECUT1, which is transcriptionally silenced during PDA progression (Figure S5E–G) (Moffitt et al., 2015). While overexpressing GATA5, BATF2, PRRX2, or PAX9 in KPC-2D cells each led to enhanced invasiveness in vitro (Figure S5H), we focused on GATA5, since this TF is similar to FOXA1 in being upregulated during both endoderm development and PDA progression (Figure S5I–J). GATA5 overexpression in KPC-2D cells led to enhanced clonogenic growth and lung colonization (Figure S5K–L). The Gata5 locus also acquired a GAIN enhancer in M organoids (Figure S3B).
Figure 5. FOXA1 Cooperates with GATA5 to Activate GAIN Enhancers and Promote PDA Progression in vivo.
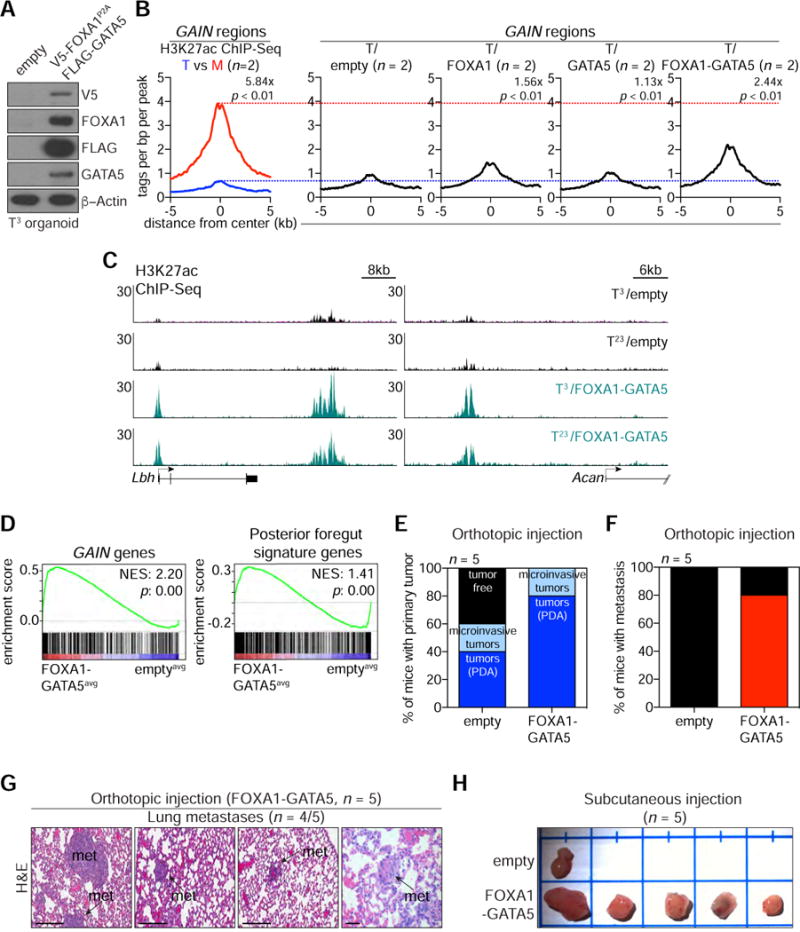
(A) Western blot analysis of T3/empty or T3/FOXA1-GATA5 organoids with the indicated antibodies.
(B) Metagene representation of the mean H3K27ac ChIP-seq signal across GAIN regions in the indicated organoids. Mean H3K27ac signal of two parental T organoids (T3 and T23) and their matched M organoids (M1L and M10P) are displayed (left). T3 and T23 organoids stably expressing control, FOXA1, GATA5 or FOXA1-GATA5 construct were subjected to H3K27ac ChIP-seq to compare with parental T (blue dotted line) or matched M (red dotted line) organoids. Parental T organoids were compared with matched M organoids, and T/FOXA1 or T/FOXA1-GATA5 organoids were compared with T/empty organoids. The mean signal of each biological replicate was determined by averaging signals of 2-Kb around the center of the indicated regions. p-value was determined by Kolmogorov–Smirnov test.
(C) Representative H3K27ac ChIP-seq profiles of GAIN regions at Lbh and Acan loci in the indicated organoids.
(D) GSEA of averaged T/FOXA1-GATA5 (FOXA1-GATA5avg) versus averaged T/empty (emptyavg) RNA-seq using GAIN genes (left) or posterior foregut signature genes (right).
(E-F) Quantification of the number of mice with primary tumors at injection site (pancreas, E) and metastases (F) after orthotopic injection of T3/empty or T3/FOXA1-GATA5 organoids in athymic nu/nu mice (n = 5). 5 × 10⁵ cells were orthotopically injected and mice were sacrificed at 12 weeks post-injection. Frequency of PDA and microinvasive PDA development in orthotopic injection is 40% (n = 2/5) and 20% (n = 1/5), respectively for T3/empty and 80% (n = 4/5) and 20% (n = 1/5), respectively for T3/FOXA1-GATA5.
(G) H&E staining of lung micrometastases (n = 4/5, arrows) upon orthotopic injection of T3/FOXA1-GATA5 organoids. Scale bars, 200 μm.
(H) Tumor development after subcutaneous injection of T3/empty and T3/FOXA1-GATA5 organoids. 5 × 10⁵ of cells were subcutaneously injected into C57Bl/6J mice and mice were sacrificed at 11 weeks post-injection. Note, four of T3/empty-injected mice (n = 5) did not show apparent subcutaneous tumor formation in a syngeneic background.
We considered whether GATA5 cooperates with FOXA1 to promote GAIN enhancer activation in the organoid culture model. GATA5 expression alone had only a 1.1-fold effect on H3K27ac at GAIN regions in T organoids, but co-expression of GATA5 with FOXA1 led to a more robust activation of GAIN enhancers than expressing either TF alone, which recapitulated ~42% of the H3K27ac enrichment seen in M organoids (Figure 5B–C and S5M). Overexpressing FOXA1/GATA5 in T organoids also led to upregulation of GAIN genes and the foregut endoderm gene signature (Figure 5D). T organoids overexpressing FOXA1/GATA5 or empty vector were injected into the pancreas of recipient mice, followed by evaluation of disease progression using ultrasound imaging. At a 12-week time-point, mice transplanted with FOXA1/GATA5-expressing tumors required sacrifice due to their moribund condition, which was correlated with more rapid PDA tumor formation at the primary site than control mice (Figure 5E–F). Histological assessment of sacrificed animals revealed a higher frequency of metastasis in mice transplanted with FOXA1/GATA5-expressing cells (Figure 5G and S5N–P). We also found that FOXA1/GATA5 co-expressing T organoids developed larger tumors when injected subcutaneously, which resembles the aggressiveness of M organoids (Figure 1G and 5H). These findings show that GATA5 cooperates with FOXA1 to activate GAIN enhancers and promote PDA progression in vivo.
We next evaluated the necessity of FOXA1 to maintain the aggressive properties of M organoids by generating FOXA1-deficient M1L organoids with short hairpin RNA-mediated knockdown or with CRISPR-Cas9 genome editing. shRNA-expressing cells had reduced FOXA1 occupancy in association with reduced H3K27ac at GAIN regions (Figure 6A–C and S6A–C). RNA-seq analysis of FOXA1-deficient M organoids revealed downregulation of GAIN genes and of the foregut endoderm gene signature (Figure 6D). This result prompted us to investigate PDA progression following transplantation of FOXA1-deficient M1L organoids into the pancreas of recipient mice. At 6 weeks post-transplant, FOXA1 knockdown led to significantly smaller primary tumors in the pancreas (average tumor weight of 10 mice, shRen; 0.91g/shFoxa1 0.57g, p < 0.01) (Figure 6E). In addition, we identified metastases in 4/10 control mice, whereas Foxa1 knockdown was associated with metastasis in only 1/10 of the mice (Figure 6F and S6D). Similar findings were observed using CRISPR-based targeting of Foxa1 (Figure S6E–J). Taken together, these findings suggest that FOXA1-dependent enhancer reprogramming PDA progression and metastasis in vivo.
Figure 6. Suppression of FOXA1 Deactivates GAIN Enhancers and Diminishes the Aggressiveness of Metastasis-derived PDA Organoids.
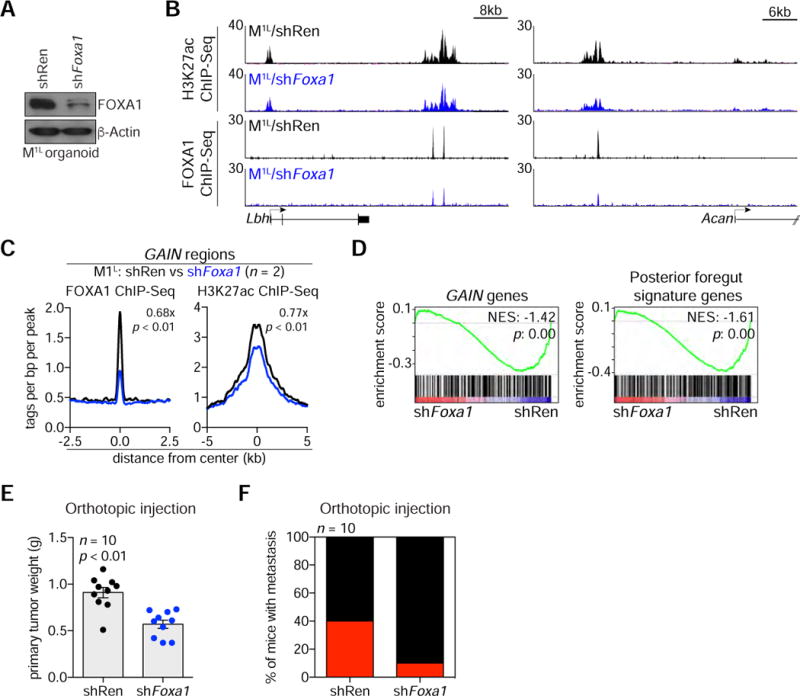
(A) Western blotting of M1L organoids stably expressing shRen (M1L/shRen) or shFoxa1.2959 construct (M1L/shFoxa1) with the indicated antibodies.
(B) Representative H3K27ac ChIP-seq profiles of GAIN regions at Lbh and Acan loci in the indicated organoids.
(C) Metagene representation of the mean FOXA1 (left) or H3K27ac (right) ChIP-seq signal across GAIN regions in the indicated organoids. The mean signal of each biological replicate was determined by averaging signals of 1-Kb (FOXA1) or 2-Kb (H3K27ac) around the center of the indicated regions. p-value was determined by Kolmogorov–Smirnov test.
(D) GSEA of M1L/shFoxa1 versus M1L/shRen using GAIN genes (left) or posterior foregut signature genes (right).
(E) Quantification of primary tumor weight from injection site (pancreas) after orthotopic injection of M/shRen or M/shFoxa1 organoids in athymic nu/nu mice (n = 10). 5 × 10⁵ cells were orthotopically injected and mice were sacrificed at 6 weeks post-injection. Each dot represents a mouse and the mean +/− SEM is shown. p-value was determined by Student’s t-test.
(F) Quantification of the number of mice bearing metastasis upon orthotopic injection of M/shRen or M/shFoxa1 organoids (n = 10).
Discussion
The central conclusion of our study is that a reorganization of the enhancer landscape promotes metastasis in pancreatic cancer. The initial support for this conclusion comes from our epigenomic profiling of organoid cultures derived from each stage of PDA progression in the KPC mouse model, which revealed prominent gains and losses of enhancer activity associated with the metastatic transition. The recurrent pattern of enhancer activation among independent metastatic lesions suggests a functional role for these cis elements during metastatic progression. We identify FOXA1 upregulation as a key driver of this process, which can promote enhancer activation and metastasis in vivo. In this setting, FOXA1 activates an embryonic foregut endoderm transcriptional program which, to our knowledge, is a process that has not been previously implicated as a source of metastatic traits.
During embryonic development, FOXA1 functions redundantly with FOXA2 to specify the definitive endoderm and to allow development of foregut-derived organs, which includes the pancreas (Gao et al., 2008). While FOXA2 expression is high in the normal adult pancreatic ductal epithelium, its expression decreases and becomes replaced by FOXA1 during PDA progression. Our transcriptional profiling experiments have suggested that the aberrant upregulation of FOXA1 in PDA leads to activation of foregut endoderm genes. This finding implies that genes expressed during developmental transition can be repurposed to endow tumor cells with metastatic capabilities. We note that many of the foregut endoderm genes activated by FOXA1 in PDA metastasis encode signaling molecules that might allow for anchorage-independent growth or invasive properties, e.g. RGL1 (Vigil et al., 2010). Foregut endoderm development is also a process of rapid cell proliferation and branching morphogenesis of epithelial cells that invade into mesenchymal tissues (Larsen and Grapin-Botton, 2017). Such cellular characteristics bear an obvious commonality with the characteristics of metastatic cancer cells, and may explain the re-emergence of developmental programs during PDA progression.
A link between FOXA1 and PDA metastasis was unexpected, as prior studies have shown that FOXA1 is expressed at lower levels in mesenchymal (also referred to as ‘high-grade’) PDA cell lines (Bailey et al., 2016; Diaferia et al., 2016; Song et al., 2010). However, our analysis of murine and human PDA samples shows that FOXA1 upregulation is a prevalent feature among advanced primary tumors and metastatic lesions in this disease (Moffitt et al., 2015). This discrepancy can be accounted for by considering the recently identified subtypes of PDA revealed by transcriptome analysis (Bailey et al., 2016). FOXA1 upregulation is associated with a ‘progenitor’ (also known as classical) subtype of PDA, whereas FOXA1 expression is low in the ‘squamous’ (also known as quasi-mesenchymal) subtype (Bailey et al., 2016; Collisson et al., 2011). Both of these PDA subtypes are highly metastatic, with only small differences in overall patient survival (Bailey et al., 2016). This raises the possibility that these subtypes achieve their metastatic potential through distinct mechanisms, which may explain why high FOXA1 expression does not correlate with an exceptionally poor patient outcome (data not shown).
Our functional experiments demonstrate that FOXA1-mediated enhancer reprogramming enhances metastatic potential, but also confers a fitness advantage to cells in the primary tumor. This observation is consistent with measurements of FOXA1 expression in mouse and human PDA samples, in which we observe progressive FOXA1 upregulation in primary tumors and metastasis. In the KPC model we observe the most striking FOXA1 upregulation in metastatic lesions, with only occasional regions of focal expression detected in primary tumors. In human PDA, FOXA1 becomes upregulated in primary tumors in a manner that correlates with disease stage, with additional FOXA1 upregulation in metastatic lesions (Moffitt et al., 2015). These species-specific differences are likely due to distinct clonal dynamics in the genetically engineered mouse model versus the spontaneous genetic events that drive the human disease. Nevertheless, a priority for future investigation will be to map enhancers at single cell resolution in matched primary tumors and metastases from human PDA patients to gain a deeper understanding of how enhancer reprogramming participates in the clonal evolution of this heterogeneous disease.
TP53 mutations occurs frequently during PDA progression, particularly in the late stage of PanINs (Hruban et al., 2000). Laser capture microdissection studies on PDA specimens have revealed that p53 loss-of-heterozygosity (LOH) occurs in focal areas of primary tumors and is frequently found in invasive lesions (Sakai et al., 2000; Yamano et al., 2000). Recurrent p53 LOH and FOXA1 upregulation in M organoids raised the possibility that FOXA1 upregulation might be caused by p53 LOH during metastasis. However, our data indicates that FOXA1-mediated enhancer reprogramming occurs independently of p53 LOH. Since p53 has been proposed to regulate epigenetic states (Levine and Greenbaum, 2012) and p53 LOH has been shown as an important driver of PDA progression (Muzumdar et al., 2016), it is still possible that tumor cells with p53 LOH become more permissive to epigenetic alterations in certain contexts, such as stromal cues or metabolic challenges. Nonetheless, this requires further investigation to determine whether cooperativity exists between enhancer reprogramming and p53 LOH in PDA progression and metastasis in vivo.
An emerging body of evidence implicates chromatin deregulation in the acquisition of metastatic traits. In a recent study, small cell lung cancer metastasis was associated with widespread increases in chromatin accessibility across the genome, as a consequence of NFIB amplification (Denny et al., 2016). This mechanism appears to be distinct from our observations in PDA, since we did not observe generalized increases in chromatin accessibility associated with metastasis in this setting. Disruption of large heterochromatin domains of H3K9/H4K20 methylation has also recently been linked with PDA metastasis (McDonald et al., 2017). Within this larger body of evidence of epigenetic deregulation in metastasis, our study calls attention to alterations of the enhancer landscape as a mechanism by which tumor cells gain metastatic potential. These findings raise the possibility that targeting enhancer-binding proteins, such as the writers, readers, and erasers of chromatin marks, will provide a means of eliminating metastatic disease.
STAR Methods
Contact for Reagent and Resource Sharing
Further information and requests for resources and reagents should be directed to the Lead Contact, Christopher R. Vakoc (vakoc@cshl.edu).
Experimental Model and Subject Details
Mice
KPC mice (Kras+/LSL-G12D; Trp53+/LSL-R172H; Pdx1-Cre) have been described previously (Hingorani et al., 2005). KPC mice have been backcrossed onto the C57Bl/6J mouse strain obtained from The Jackson Laboratory (stock number 000664). Female 6- to 8-week-old syngeneic C57Bl/6J or athymic immune-compromised mice (nu/nu) were purchased from The Jackson Laboratory and Charles River Laboratory, respectively. All mice were housed in specific pathogen free conditions prior to use. Prior to the described studies, mice were regularly monitored and determined to be healthy by the veterinary staff. All animal procedures and studies were conducted in accordance with the Institutional Animal Care and Use Committee (IACUC) at Cold Spring Harbor Laboratory.
Organoids, cell lines and culture conditions
In order to derive primary tumor and metastatic organoid cultures from tumor-bearing KPC mice, primary tumor and metastatic tissues were carefully dissected avoiding adjacent normal pancreas or other tissue contamination (Boj et al., 2015). Dissected tissues were minced with surgical scalpels and incubated in digestion buffer (DMEM, 1% FBS, penicillin, streptomycin, 0.125 mg/mL Collagenase Type XI, 0.125 mg/mL Dispase II) for 2 hours at 37 °C with gentle rocking. Digested tissues were further digested with TrypLE for 10 min at 37 °C with gentle agitation. Cells were resuspended with Matrigel and plated in ultra-low attachment 24 well plates. Once Matrigel was solidified, pancreatic organoid media was added. Pancreatic organoid media contains advanced DMEM/F12, HEPES 10 mM, Glutamax 1X, A83-01 500 nM, mEGF 50 ng/mL, mNoggin 100 ng/mL, hFGF10 100 ng/mL, Gastrin I 0.01 μM, N-acetylcysteine 1.25 mM, Nicotinamide 10 mM, B27 supplement (1X final), R-spondin conditioned media (10% final). For dissociating organoids into single cell suspension, organoids were incubated in 2 mg/ml dispase followed by 10 min TrypLE incubation. Cells were filtered with 40 μm cell strainer. To generate KPC-2D cell lines from tumor organoid cultures, organoids were dissociated into single cells as described above, resuspended with DMEM supplemented with 10% FBS, penicillin and streptomycin and plated in tissue culture plates. For human samples, tissues were minced and incubated in digestion media (5 mg/mL Collagenase XI, 10 μg/mL DNAse I, 10.5 μM Y-27632 in Human complete Feeding Medium) at 37 ˚C with mild agitation for up to 1 hour. Cells were plated with Matrigel and grown in Human complete Feeding Medium (advanced DMEM/F12, HEPES 10 mM, Glutamax 1X, A83-01 500 nM, hEGF 50 ng/mL, mNoggin 100 ng/mL, hFGF10 100 ng/mL, hGastrin I 0.01 μM, N-acetylcysteine 1.25 mM, Nicotinamide 10 mM, PGE2 1 μM, B27 supplement (1X final), R-spondin1 conditioned media (10 % final), Afamin/Wnt3A conditioned media (50 % final) (Mihara et al., 2016). hT2 organoids were generated from a patient derived xenograft (PDX) obtained from Champions Oncology. Tumor dissociation and organoid culture was performed as described above. To establish a 2D culture, organoids were seeded in a 6-well plate with RPMI, 10% FBS, and 1X Penicillin/Streptomycin and allowed to form a confluent monolayer. Human PDA cell line, MiaPaCa-2 was obtained from ATCC. Organoid cultures and cell lines were regularly verified to be free of mycoplasma contamination. The genotype of murine organoids and organoid-derived cell lines was authenticated by PCR-based DNA genotyping.
Human specimens
Normal pancreatic tissue was obtained from islet transplant programs at the University of Illinois at Chicago and University of Miami Miller School of Medicine as described previously (Boj et al., 2015). Pancreatic cancer tissue was obtained from patients undergoing surgical resection or tissue biopsy at Memorial Sloan Kettering, Stony Brook University (GI biobank), Johns Hopkins University, Weill Cornell University, University of California Davis, Thomas Jefferson University Hospital, and Champions Oncology. Human liver metastasis tissue was obtained from Rapid Autopsy Program at University of Nebraska Medical Center. All tissue donations and experiments were reviewed and approved by the Institutional Review Board of Cold Spring Harbor Laboratory and all clinical institutions. Written informed consent was obtained prior to acquisition of tissue from all patients. Samples were confirmed to be tumor or normal based on pathologist assessment. For the patients included in this study 36% were female, 52 % were male, 12% were undetermined and the median age was 69 years old.
Method Details
Next-generation sequencing library constructions
Chromatin immunoprecipitation (ChIP) assay
For ChIP experiments with PDA organoids, organoids were dissociated into single cells to yield 106 cells as described above. For ChIP experiments with KPC-2D cells, cells were trypsinized into single cells to yield 5 × 10⁶ cells. Cells were crosslinked for 10 min at room temperature with formaldehyde (1 % final) and then quenched with 0.125 M glycine for 10 min. PBS-washed cells were then lysed with 200 μl of Cell lysis buffer (10 mM Tris-Cl pH 8.0, 10 mM NaCl, 0.2 % NP-40) with protease inhibitor and incubated for 10 min at 4 °C. Chromatin was isolated by centrifugation at 7,400 rpm for 30 sec and pellets were lysed with 200 μl of Nuclei lysis buffer (50 mM Tris-Cl pH 8.0, 10 mM EDTA, 1 % SDS) with protease inhibitor followed by incubation for 10 min at 4 °C. Lysed chromatin was then sonicated for 10 cycles (30 sec on/30 sec off, low amplitude) using Bioruptor (Diagenode). After sonicated chromatin was centrifuged at 14,000 rpm for 10 min at 4 °C, the supernatants were incubated for 1 hour with 800 μl of IP dilution buffer (20 mM Tris-Cl pH 8.0, 2 mM EDTA, 150 mM NaCl, 1 % Triton X-100, 0.01 % SDS), 10 μg of rabbit IgG and 50 μl of Protein A magnetic beads for pre-clearing sheared chromatin. Immunoprecipitation was further performed with 1 ml of pre-cleared chromatin, 2 μg of antibody and 20 μl of Protein A magnetic beads overnight at 4 °C with rotation. Next day, immunocomplexes were washed as follows – first wash once with IP Wash I buffer (20 mM Tris-Cl pH 8.0, 2 mM EDTA, 50 mM NaCl, 1 % Triton X-100, 0.1 % SDS), second wash twice with High salt buffer (20 mM Tris-Cl pH 8.0, 2 mM EDTA, 500 mM NaCl, 1 % Triton X-100, 0.01 % SDS), third wash once with IP Wash II buffer (10 mM Tris-Cl pH 8.0, 1 mM EDTA, 0.25 M LiCl, 1 % NP-40, 1 % Na-deoxycholate) and final wash twice with TE pH 8.0. The washed immunocomplexes were eluted with 200 μl of elution buffer (1 % SDS, 0.1 M NaHCO3) at 45 °C for 30 min and reverse-crosslinked with RNase A (1 μg/μl) and 0.25 M NaCl overnight at 65 °C water bath. Next day, immunoprecipitated DNA was treated with Proteinase K (0.2 mg/ml) for 2 hours at 45 °C and purified with QIAquick gel extraction kit in 55 μl of EB elution buffer.
ChIP-seq library construction
ChIP-seq libraries were constructed using the TruSeq ChIP Sample Prep Kit (Illumina) according to the manufacturer’s instructions. Briefly, 50 μl of purified ChIP DNA was end-repaired for dA-tailing, followed by adaptor ligation. Adapter-ligated ChIP-DNA was size-selected (250 – 300 bp) via agarose-gel electrophoresis, gel-extracted with QIAquick gel extraction kit and used for 15 cycles of PCR amplification. Amplified DNA was finally size-selected with SPRI clean-up by AMPure XP beads (1:1). Quality of ChIP-seq library was determined by Bioanalyzer using the High Sensitivity chip (Agilent) and the average size of ChIP-seq libraries ranged from 250 to 350 bp. For multiplexing, equal molar quantities of libraries were combined by considering sequencing depth per sample (20 to 40 million reads per library). ChIP-seq libraries were sequenced using an Illumina HiSeq2500 or NextSeq platform with single-end reads of 50 bases.
RNA-seq library construction
For RNA-seq experiments with PDA organoids, organoids were dissociated into single cells to yield 5 × 10⁵ cells. For KPC-2D cells, cells were trypsinized into single cells to yield 2 × 10⁶ cells. Total RNA was extracted with TRIzol reagent (Thermo Fisher) according to the manufacturer’s instructions. Briefly, cells were lysed with 1 mL of TRIzol and 200 μl of chloroform, followed by incubation for 10 min at 4 °C. After centrifuging lysed RNA at 12,000 g for 10 min at 4 °C, the supernatants were incubated with the same volume of 2-isopropanol for 15 min at room temperature. RNA was precipitated at 10,000 g for 10 min at 4 °C, washed with 75 % EtOH in DEPC-treated water and eluted in RNase-free water. RNA-seq libraries were constructed using the TruSeq sample Prep Kit V2 (Illumina) according to the manufacturer’s instructions. Briefly, 2 μg of purified RNA was poly-A selected and fragmented with fragmentation enzyme. After first and second strand synthesis from a template of poly-A selected/fragmented RNA, other procedures from end-repair to PCR amplification were done according to ChIP-seq library construction steps. Quantity of RNA-seq library was determined by Nanodrop, and average quantity of RNA-seq libraries ranged from 40 to 80 ng/μl. Multiplexing for sequencing was performed as described for ChIP-seq library construction. RNA-seq libraries were sequenced using an Illumina HiSeq2500 or NextSeq platform with single-end reads of 50 bases.
ATAC-seq library construction
ATAC-seq library construction was performed as previously described with minor modifications (Buenrostro et al., 2013). For ATAC-seq experiments with PDA organoids, organoids were dissociated into single cells to yield 50,000 cells and lysed with 50 μl of Lysis buffer (10 mM Tris-Cl pH 7.4, 10 mM NaCl, 3 mM MgCl2, 0.1 % NP-40, 0.1 % Tween-20, protease inhibitor) and incubated for 5 min at 4 °C. After centrifuging at 6,000 g for 10 min at 4 °C, pellets (nuclei) were resuspended with 50 μl of transposition mix (Illumina; 1X Tagment DNA buffer, Tn5 Transposase, 0.05 % Tween-20, nuclease-free DW) and incubated for 30 min at 37 °C in the Thermomixer by shaking at 300 rpm. Transposition was terminated by adding 50 mM EDTA, followed by quenching excessive EDTA with 45 mM MgCl2. Transposed DNA was purified using QIAgen MinElute columns, subsequently amplified with Nextera sequencing primers and NEB high fidelity 2X PCR master mix for 12 cycles (New England Biolabs). PCR-amplified DNA was purified using QIAgen MinElute columns and sequenced using NextSeq platform with single-end reads of 50 bases.
Protein and DNA/RNA-related experiments
Cloning
Foxa1 cDNA (Addgene #33003) (Sekiya and Suzuki, 2011), Gata5 cDNA (GE Healthcare, Clone ID: 40046620), Prrx2 (Addgene #21010) (Stelnicki et al., 1998), Batf2 (GE Healthcare, Clone ID: 4984403) and Pax9 (GE Healthcare, Clone ID: 3707718) cDNA were subcloned into MSCV-PGK-Neo-IRES-GFP. The amino acid sequences for P2A linker; GSG-ATNFSLLKQAGDVEENPGP. miR30-based shRNAs were designed and cloned as previously described (Fellmann et al., 2013). Sequence information for shRNAs can be found in Table S6.
CRISPR-mediated genome editing in organoids
Guide RNAs were designed using CRISPR Design (http://crispr.mit.edu). gRNAs were cloned into LRG vector (Addgene #65656) (Shi et al., 2015) or LRNG vector. LRNG vector was generated by inserting Neo-IRES cassette in front of GFP cassette in LRG vector. Lenti-Cas9-Blasticidin or Lenti-Cas9-Puro was lentivirally introduced into T or M organoids. After antibiotics selection, gRNA was lentivirally introduced. For Trp53 inactivation in T organoids, LRNG-sgTrp53 introduced cells were selected with G418 (1 mg/mL). For DNA-binding domain mutation of Foxa1 in M organoids, LRG-sgFoxa1 introduced cells were sorted by GFP positivity with flow cytometry. To validate CRISPR-Cas9 mediated mutation efficiency, genomic DNA (~500bp) containing sgRNA binding region was PCR amplified from total genomic DNA. For qPCR-based quantification of editing efficiency, pairs of primers proximal to PAM sequence of each gRNA were designed. Relative efficiency for genomic DNA amplification was measured by qPCR-based 2ˆ(delta)(delta)CT method, compared to sgRosa expressing cells as a control.
Genomic DNA isolation from organoids
Organoids were harvested from two wells of 24 well plate and centrifuged with 10,000 g for 1 min at 4 °C. Cell pellets were resuspended with 40 μl of lysis buffer (10 mM Tris-HCl, 50 mM KCl, 2.5 mM MgCl2, 0.45 % Nonidet P-40, 0.45 % Tween20 and 60 μg/mL Proteinase K) and incubated at 55 °C for 1 hour and subsequently at 96 °C for 10 min. 1 μl of crude DNA extract was used for further genotyping analysis.
Western blotting
For western blotting experiments with PDA organoids, organoids were dissociated into single cells to yield 5 × 10⁵ cells. For western blotting experiments with KPC-2D cells, cells were trypsinized into single cells to yield 5 × 10⁵ cells. To prepare whole-cell lysates, cell pellets were directly lysed with 100 μl of PBS, 100 μl of 2× Laemmli buffer (BIO-RAD) and 4 μl of 2-Mercaptoethanol. Extracts from 30,000 – 50,000 cells were loaded into each lane of SDS-PAGE gel electrophoresis, followed by transfer to nitrocellulose for immunoblotting.
Extraction of total histones
500,000 cells were prepared from each organoids as described above, and proceeded to isolate total histones with Histone Extraction Kit (Abcam, ab113476) according to manufacturer’s protocol.
cDNA synthesis and RT-qPCR
Using TRIzol reagents according to the manufacturer’s instructions, total RNA was extracted as described in RNA-seq experiments. DNase I treatment was subsequently performed to eliminate contaminating genomic DNA upon RNA isolation. cDNA was synthesized with Q-script cDNA SuperMix (Quanta Bio), which primes RNA with a blend of random hexamer and oligo-dT. All results were quantified by qPCR performed using power SYBR green (Thermo Fisher) on an ABI 7900HT (ABI) and quantified using the 2ˆ(delta)(delta)CT method with housekeeping gene Gapdh as the control gene for internal normalization. All qPCR primer sequences used in this study are listed in the Table S6.
Cell culture-related experiments
Retrovirus/lentivirus production and infection of organoids
Retrovirus was produced in ecotropic Phoenix cells by transfecting plasmids with X-tremeGENE9 transfection reagent. Ecotropic Phoenix cells were plated a day before transfection with 70–80% confluency in 10 cm tissue culture plate. Media was changed with 9.6 mL of antibiotic-free DMEM supplemented with 10% FBS. 10 μg of plasmid DNA and 15 μl of X-tremeGENE9 reagent was mixed in 400 μl of DMEM and incubated for 20 min at room temperature. Transfection mixture was added to the cells. After 24 hours, media was removed and fresh DMEM supplemented with 10 % FBS was added. Retrovirus-containing supernatant was harvested at 48 hours and 72 hours after transfection and filtered through a 0.45 μm filter. To concentrate retrovirus, one volume of Retro-X™ concentrator with 3 volumes of supernatant was mixed and incubated at 4 °C overnight. After centrifugation at 1,500 × g for 45 min at 4 °C, the virus pellet was resuspended with organoid media (10 times concentrated from the initial volume). To infect organoids with retrovirus, organoid cultures were dissociated into single cells as described above and spinoculated by centrifugation. In brief, 100,000 cells were mixed with 500 μl of concentrated virus, supplemented with polybrene (final concentration; 8 μg/mL) and placed in a 24 well low-attachment plate. The plate was centrifuged with 600 × g for 1 hour at room temperature, and incubated at 37 °C CO2 incubator for 6 hours. Then, cells were resuspended with 200 μl of Matrigel, plated in 4 wells of 24-well plate and grown as organoids. Two days after infection, G418 (1 mg/mL, final concentration), puromycin (2 μg/mL, final concentration) or blasticidin (10 μg/mL, final concentration) was added for antibiotic selection.
Lentivirus was produced in 293T cells by transfecting plasmids and packaging plasmids (pMD2 and psPAX2) with X-tremeGENE9 transfection reagent. To concentrate lentivirus, Lenti-X™ concentrator was used. All other procedures were done as described for retrovirus production.
Retrovirus production and infection of KPC-2D cells
For retroviral packaging, Plat-E cells were used for the transient transfection with PEI (polyethyleneimine) according to standard protocols. The viral supernatants were harvested twice at 48 and 72 hours post-transfection and cell debris removed from the supernatant using 0.45 μm filter prior to transduction of KPC-2D cells. To maximize transduction efficiency, polybrene (10 μg/mL) was supplemented during retroviral infection. Two days after infection, G418 (1 mg/mL, final concentration) was added for antibiotic selection.
Boyden chamber-invasion assay
For in vitro invasion assay, BioCoat Matrigel invasion chambers with 8.0 μm PET membrane in 24-well plates (Corning) were used. Once invasion chamber was thawed, 500 μl or 800 μl of serum-free DMEM was added to the interior of insert and the bottom of the well, respectively. After incubating for 2 hours in a tissue culture incubator for rehydration, KPC-2D cells (50,000 cells) were resuspended in 500 μl of serum-free DMEM and added to the upper chamber. In the lower chamber, 800 μl of DMEM with 10 % FBS was added as a chemoattractant. After 24 hours of incubation in a tissue culture incubator, the upper well containing membrane was scrubbed carefully several times with a cotton swab soaked in PBS to remove non-invaded cells. The lower membrane of the well was rinsed with PBS carefully several times. Invaded cells were stained with Syto13 (Thermo Fisher, 1:10,0000 in PBS) for 15 min in the dark, and pictures were taken under a 4× GFP fluorescence microscope for counting. Invasion was calculated as the average number of cells per 4× field, determined by ImageJ software (NIH).
Anchorage-independent sphere culture
KPC-2D cells (25,000 cells) were resuspended in 1.5 mL of serum free DMEM supplemented with 20 μl/mL B27, 20 ng/mL EGF and 20 ng/mL bFGF in ultra-low attachment 6-well plates (Corning). Every 3 days, 200 μl of fresh media was added. Spheres grown in anchorage-independent condition (or tumor spheres) were photographed at day 14 under a 4× microscope with the bright-field. Before taking pictures, cells were gently transferred from 6-well to 24-well plate, to increase the density of spheres per well. Sphere sizes were determined by ImageJ software (NIH).
Clonogenic growth assay
KPC-2D cells (1,000 cells) were resuspended in DMEM with 10 % FBS, then plated in regular 6-well plates. Colonies were briefly stained with 0.05 % crystal violet in 95 % EtOH and washed slowly running water from the tap. Images of plates were taken with a gel documentation system. Clonogenic growth was calculated as the average % area of colonies per well, determined by ImageJ software (NIH).
KPC-2D cells (300,000 cells) were resuspended in 100 μl of DMEM and incubated with an ORIS insert in a 96-well plate to allow attachment overnight (Platypustech). Next day, the insert was removed using a stopper tool to reveal a migration zone of 2 mm diameter. In a control well, the insert was left in as a pre-migration control. Once wells were gently washed with PBS, 100 μl of fresh media was added to allow migration overnight. Next day, wells were gently washed with PBS and stained with Syto13 (Thermo Fisher, 1:10,0000 in PBS) for 15 min in the dark and images were taken under a 4x GFP fluorescence microscope for counting. Migration was calculated as the average number of cells in 2 mm-migration zone, determined by ImageJ software (NIH).
Generation of T organoid clones with Trp53 LOH
Two gRNAs targeting the first and second intron of Trp53 locus were lentivirally introduced in Cas9 expressing T organoids. First intron targeting gRNA was designed to recognize only wild-type allele due to the loxP sequence in Trp53 mutant allele. After introduction of the two gRNAs in LRNG vector followed by G418 selection (1 mg/mL) for 4 days, single cell dissociated organoids were grown in DMEM supplemented with 10 % FBS and penicillin/streptomycin for 2 days. Single cell-derived organoids were dissolved in 10 mL of ice-cold PBS, manually picked under the microscope, transferred to fresh Matrigel and expanded in organoid media. Absence of wild-type Trp53 was further validated by PCR genotyping and Sanger sequencing of Trp53 cDNA.
In vivo experiments
In vivo transplantation assays
For orthotopic, intraperitoneal, intrasplenic and subcutaneous injections, mice were anesthetized using an automatic delivery system (Isoflurane Vaporizer). Iodine solution was applied to the surgery site. For orthotopic or intraperitoneal injection, a small incision (~1 cm) in the skin of the upper left quadrant of the abdomen was made. Cells were resuspended with 50 μl of Matrigel and injected into the parenchyma of the pancreas or peritoneal wall, respectively.
Intrasplenic injection of cancer cells for modeling hepatic metastases has been described in detail elsewhere (Soares et al., 2014). Briefly, the spleen was divided by placing two ligating clips (Teleflex, #002200) in the center of the spleen, and cells resuspended with 200 μl PBS were slowly injected into the exposed hemispleen. By applying a ligating clip (Teleflex, #001200) to the most distal aspect of pancreas and splenic vessels, the pancreas and splenic vessels were ligated by cutting above the clips. An incision at the peritoneal cavity was sutured using Coated Vicryl suture (Johnson & Johnson, J392H) and stainless steel wound clips (Reflex7, CellPoint Scientific, Inc. #203-1000) were applied to the skin. For the subcutaneous injection, mice were anesthetized as described above. Cells resuspended with 50 μl of Matrigel were injected into the subcutaneous space of the left flanks. One flank per mouse was injected. For tail vein injection, mice were restrained and cells (resuspendied in 200 μl of PBS) were injected intravenously through the tail vein.
For portal vein injection, dissociated organoid cells (5 × 10⁵) resuspended in sterile phosphate buffered saline (PBS, 100 μl) were injected in the portal vein of 10-week-old male C57BL/6 mice (Charles Rivers Laboratories): a midline incision was made through skin and peritoneum cutting from the xiphoid process and 10–15 mm caudal. The intestine was gently displaced on sterile gauze to reveal the portal vein. Cells were injected directly into the portal vein and Gelfoam sterile Compressed Sponge (Pfizer) was kept on the injection site until achieving hemostasis. The intestine was returned to the abdominal cavity and the incisions in peritoneum and skin closed by sutures. Four weeks after injection, mice were transcardially perfused with PBS followed by 4% PFA solution in PBS. Livers and lungs were harvested and processed for paraffin embedding.
Human tissue microarrays
Human tissue microarrays containing primary tumors and metastases were obtained from Rapid Autopsy Program at University of Nebraska Medical Center. Human pancreatic, metastatic, and unaffected specimens from decedents who have previously been diagnosed with pancreatic ductal carcinoma were obtained from the University of Nebraska Medical Center’s Tissue Bank through the Rapid Autopsy Pancreatic program in compliance with IRB 091-01. To ensure minimal degradation of tissue, organs were harvested within three hours post mortem and the specimens placed in formalin for immediate fixation. The tissue microarrays were made from paraffin blocks of formalin fixed tissue from rapid autopsies. Large 2.0 and/or 3.0 mm cores were used to construct the tissue arrays. The cores were imbedded in agarose recipient blocks (Tissue-Tek® Quick-Ray™). The tissue microarray blocks were cut into 4 μm thick sections and mounted on charged slides.
Histology
Lung tissues were perfused by intratracheal injection of 10% neutral buffered formalin (NBF) and postfixed with 10% NBF overnight. All other tissues were fixed with 10% NBF overnight. Tissues were processed with standard tissue processing protocol, embedded in paraffin and 6 μm sections cut. Formalin fixed paraffin-embedded (FFPE) tissue sections were stained with hematoxylin and eosin, or used for immunohistochemical staining and RNA fluorescence in situ hybridization.
Immunohistochemistry
FFPE sections were deparaffinized and rehydrated. For antigen retrieval, slides were incubated with boiling 0.01 M Citrate buffer (pH 6.0) for 20 min. Endogenous peroxidase activity was quenched in 3% H2O2. Section were incubated with goat polyclonal anti-Foxa1 antibody (1:200) overnight at 4 °C. Antibody was visualized by ImmPRESS™ HRP Anti-Goat IgG (Peroxidase) Polymer Detection kit and ImmPACT DAB Peroxidase (HRP) Substrate. Cover slides were mounted with Cytoseal 60.
RNA Fluorescence in situ hybridization (FISH)
RNA FISH was performed according to ViewRNA ISH Tissue 2-Plex Assay (Affymetrix) manufacturer’s protocol using 10 min pre-treatment and 10 min protease treatment. In brief, RNA FISH was performed on freshly prepared FFPE tissue sections. Mouse Foxa1 (VB1-16714, type 1) was used. 4′, 6-diamidino-2-phenylindole (DAPI) was used for counterstaining. Cover slides were mounted with Permanent Mounting Media. Images were taken with a Leica SP8 confocal microscope (Leica Biosystems).
Quantification
In brief, H&E slides were scanned in Aperio scanoscope and analyzed by Aperio Imagescope software. To quantify lung metastasis, clusters of cells with abnormal nuclei were defined as metastasis. Among lung lobes, the biggest and a representative lobe was chosen. For the percentage area of each metastasis, area of metastatic lesions was divided by total area. The number of metastatic nodules per entire lung lobes was also counted. H&E slides of lung and liver tissues were examined for micrometastases. Metastasis frequency was represented as the percentage of mice with macroscopic or microscopic metastases in each cohort. To measure tumor weight from orthotopic, subcutaneous and intra-peritoneal wall injections of organoids, tumor tissues were harvested from the sacrificed mice. Adjacent non-tumor tissues were carefully removed from tumor using scalpel and tumor weight was measured.
Computational analyses
Alignment of ChIP-seq and ATAC-seq reads
Raw reads from fastq files were aligned to the reference mouse genome assembly mm9 using Bowtie with defaults except allowing two-mismatches for only unique alignment; −v 2 −m 1 (Langmead et al., 2009). To avoid clonal artifacts introduced in the library amplification steps, duplicated mapped reads were further removed using Samtools (Li et al., 2009). Finally, bam files were subjected to other analyses with HOMER suites (Heinz et al., 2010).
Identification of ChIP-seq enriched peaks
Processed bam files were subjected to identify peaks and calculate ChIP-seq tags using findPeaks tool with the parameter of finding histone-enriched regions (-style histone). Once ChIP-seq peaks were identified from 16 different organoids (N, P, T and M), mergePeaks tool with default setting (maximum distance between peak centers to merge: 100 bp) was used to combine all peaks, and yielded union of ChIP-seq peaks (ALL regions, n = 34,852). Once union of peaks were identified, ChIP-seq tags were re-calculated at a given interval by normalizing to a read depth of 10 million tags with annotatePeaks tool.
Identification of 857 GAIN regions
From 34,852 union peaks of H3K27ac ChIP-seq in organoids, relative fold changes of each H3K27ac peaks from P, T and M organoids were calculated by comparing with averaged H3K27ac signals of two N organoids (Navg: average of N5 and N6). With this, 857 peaks (GAIN regions) were defined as the union of H3K27ac peaks – more than 10-fold increase of H3K27 signal in any of P, T and M organoids compared to Navg.
Displaying ChIP-seq and ATAC-seq data
To generate browser tracks for visualizing with UCSC genome browser, the makeBigWig tool was used. To create a metagene plot or heatmap-density plot, the annotatePeaks tool was used by centering ChIP-seq or ATAC-seq regions extended to +/− 5,000 bp (H3K27, H3K4me1 ChIP-seq and ATAC-seq), or +/− 2,500 bp (FOXA1) with 25 bp bins.
Quantitative analysis of ChIP-seq and ATAC-seq meta-profiles
To measure differential enrichment from ChIP-seq or ATAC-seq meta-profiles, 2-kb from peaks center (H3K27ac and H3K4me1 ChIP-seq) or 1-kb from peaks center (FOXA1 ChIP-seq and ATAC-seq) were compared. From each bin of the given regions described above, average signals were calculated (81 bins for 2-kb and 41-bins for 1-kb regions, including a bin of center) and compared. Kolmogorov–Smirnov test was used to obtain p-value from above comparisons of distribution.
Motif enrichment in GAIN regions
To find enriched motifs in GAIN regions, the 1-kb from the center of GAIN regions was used to extract genomic sequences from the mm9 genome using UCSC table browser. These genomic sequences were further analyzed with TRAP algorithm to identify enriched motifs, compared to JASPAR vertebrates with mouse promoters as the control, and Benjamini-Hochberg as the correction (Thomas-Chollier et al., 2011). To further calculate the actual enrichment of given motif in GAIN regions, the intervals of putative motif binding sites were predicted with TRAP (weight score threshold is 5.0) and intersected with GAIN regions using BEDtools (Quinlan and Hall, 2010). If there was more than 1-bp overlap, the given interval of motif was considered as GAIN regions-overlapping.
Gene ontology (GO) analysis of genes associated with GAIN regions
Genes associated with GAIN regions were determined by GREAT tool with a default setting (basal plus extension) (McLean et al., 2010). A list of the defined genes was then used as an input for GO analysis with Metascape tool (Tripathi et al., 2015), further ranked by -log10 p-value to reveal top GO terms in Figure S2M.
ChIP-seq peak annotation
To annotate ChIP-seq peaks, the annotatePeaks tool was used to determine whether a peak was in the TSS (transcription start site), TTS (transcription termination site), exon (Coding), 5′UTR exon, 3′ UTR exon, intronic, or intergenic. In this study, 5′ UTR and 3′ UTR exons were unified as exon.
Analysis of publicly available ChIP-seq data
To analyze publicly available ChIP-Seq data, each SRA files were downloaded from NCBI Gene Expression Omnibus (https://www.ncbi.nlm.nih.gov/geo/), and analyzed with same ChIP-Seq analysis pipeline used in this study.
Identification of GAIN regions in human genome
To identify GAIN regions in human genome, 857 genomic annotations of GAIN regions defined in mouse genome assembly (mm9) were converted to human genome assembly (hg19) using lift Over tool of UCSC genome browser (http://genome.ucsc.edu/cgi-bin/hgLiftOver). To match the sequences of GAIN regions between mouse and human assembly, 20-bp center of 857 GAIN regions were used with minimum ratio of bases that must remap as 0.1 (default), which yieded 475 GAIN regions of hg19 assembly.
ChIP-Seq analysis of GAIN regions in non-pancreatic cancer
To analyze H3K27ac or H3K4me1 signals at GAIN regions in non-pancreatic human cancer cells, genomic annotations of GAIN regions converted to hg19 assembly as described above were used. Non-pancreatic cancer cells with its H3K27ac ChIP-Seq dataset deposited in NCBI GEO database are listed as follows (cancer type-cell line-Sequence Read Archive (SRA) name): TALL_MOLT4: SRR3098559, T-ALL_MV4-11: SRR3098560, Neuroblastoma_NB1643: SRR3098561, Neuroblastoma_NGP: SRR3098562, T-ALL_P12-ICHIKAWA SRR3098563, T-ALL_PEER SRR3098564, B-ALL_SEM SRR3098566, NSCLC_H82 SRR1613966, NSCLC_GLC16 SRR1613964, Multiple myeloma_MM1S SRR444454 (available from NCBI GEO: GSE76783, GSE62412, GSE36354).
Differential gene expression of RNA-seq
Raw reads from fastq files were aligned to the reference mouse genome assembly mm9 using Tophat allowing no mismatch (Trapnell et al., 2009). Differentially expressed genes were analyzed using Cufflinks tools, by masking structural RNAs (e.g. ribosomal or mitochondrial RNA) to keep total reads-based normalization from undesired effect by heavily mapped reads (Trapnell et al., 2010). From all annotated genes, two filtering steps were followed to define expressed genes in organoids. First, all miRNAs and snoRNAs were manually excluded from a list of annotated genes to focus on protein-coding genes. Second, genes were removed if the rpkm status of Cufflink output is other than ‘OK’ in any of 16 organoids (N, P, T and M) as they are likely to have low reads depth to assign the genes. With this, 14,007 genes expressed in organoids were defined.
Unsupervised hierarchical clustering analysis
To cluster organoids based on similar matrix in ChIP-seq or RNA-seq datasets, GENE-E tool was used (broadinstitute.org). Similarity was determined by Spearman correlation coefficients with average-linkage clustering method.
Gene set enrichment analysis (GSEA)
Gene set enrichment analyses were performed according to the instructions. To generate a custom gene set for GAIN regions, genes with the closest TSS from 857 GAIN regions were assigned as peak-associated genes. Gene sets for human PDA signatures and posterior foregut development signature were obtained from previous studies (Loh et al., 2014; Moffitt et al., 2015).
Quantification and Statistical analysis
Statistical significance for all experiments was evaluated by comparing p-values determined by Prism software with unpaired two-tailed Student t-test, except for meta-profile comparisons with Kolmogorov-Smirnov test.
Supplementary Material
(A) Table shows six pairs of matched primary tumor- and metastasis-derived organoids used in this study.
(B) PCR-based genotyping for assessing loss-of-heterozygosity of the Trp53 allele in T and M organoids used in this study.
(C) Representative images of H&E staining of orthotopic transplants of T3 or M1L organoids in C57Bl/6J mice. Mice were sacrificed at the indicated time after injection. Insets show higher magnification of the indicated area. Scale bars, 100 μm.
(D) Quantification of the number of lung tumor nodules per section after tail vein injection of indicated organoids (n = 4).
(E-F) Representative bright field images (E, left) and H&E staining (E, right) of liver and percentage of mice with liver tumor (F) 2 months after intra-splenic injection of T3 and M1L organoids (n = 4) in C57Bl/6J mice. Scale bars, 100 μm.
(G-H) Representative bright field images (G, left) and H&E staining (G, right) of tumors and quantification of the peritoneal tumor size (H) after peritoneal wall injection of indicated organoids (n = 4). Scale bars, 500 μm.
For bar charts, each dot represents a mouse and the mean +/− SEM is shown. p-value was determined by Student’s t-test.
(A) GSEA-based comparison of patient- and organoid-derived gene expression profiles at matched stage of PDA progression.
(B) Column-normalized heat map representation of known drivers of PDA metastasis in N, P, T and M organoids.
(C) Number of H3K27ac peaks decreased more than 10-fold relative to Navg in the indicated organoids.
(D) Recurrence of GAIN and LOSS regions in M organoids. Fraction of GAIN or LOSS regions that are present in more than two M organoids is shown as red or blue, respectively.
(E) Western blot analysis of H3K27ac in total histones from the indicated organoids.
(F) Heatmap representation of LOSS regions based on H3K27ac occupancy in organoids. The 1,709 LOSS regions were identified from the union of all gained H3K27ac peaks described in Figure 2B. 10-Kb around the center of LOSS regions are displayed for each organoid. Each row represents a single region (n = 1,709). Each column represents an individual organoid (n = 16).
(G) Representative H3K27ac ChIP-seq profiles of LOSS regions at Onecut1 and Fgfr2 loci in N, P, T and M organoids.
(H) Pie chart showing the genomic annotations of 1,709 LOSS regions according to the location of a given peak. TSS, ‘−1-kb to +100-bp’ of transcription start sites. TTS, ‘−100-bp to +1-Kb’ of transcription termination sites. UTR includes both 5′ and 3′ UTRs.
(I) GSEA of averaged Mavg versus averaged Tavg RNA-seq using GAIN (top) and LOSS genes (bottom).
(J) Metagene representation of H3K27ac signal in GAIN regions of human PDA cell lines (left) and patient-derived PDA organoids (right). Other cancers include 6 leukemia, 2 neuroblastoma and 2 non-small cell lung cancer cell lines (Abraham et al., 2017; Christensen et al., 2014; Lin et al., 2012).
(K) Metagene representation of the mean ATAC-seq signal at GAIN regions in the indicated organoids.
(L) Metagene representation of the mean ChIP-seq signal for H3K27ac (left), H3K4me1 (middle) and ATAC-seq (right) at ALL regions in the indicated organoids.
(M) Metagene representation of the mean ChIP-seq signal for H3K27ac at LOSS regions in the indicated organoids.
(N) Gene ontology (GO) analysis of genes proximal to 857 GAIN regions with Metascape. Default gene regulatory domain definition of GREAT tool (basal plus extension) was used to assign GAIN regions-associated genes, which yielded 1,090 genes. Only the top 10 GO terms ranked by their significance (p-value) are shown.
(O) Column-normalized heat map representation of epithelial-mesenchymal transition (EMT)-related gene in N, P, T and M organoids. Each row represents an indicated organoid, and each column represents an individual EMT-related gene; genes indicated as red are known to be upregulated during EMT, and genes indicated as blue are known to be downregulated during EMT.
(A) Representation of motifs enriched in GAIN regions, related to Figure 3A.
(B) H3K27ac ChIP-seq profiles at Foxa1 and Gata5 loci in N, P, T and M organoids.
(C) RNA-seq based Foxa2 mRNA expression in organoids. Each dot represents an independent organoid culture, and the mean +/− SEM is shown. p-value was determined by Student’s t-test.
(D) Metagene representation of the mean FOXA1 ChIP-seq signal at ALL regions in the indicated organoids.
(E) RT-qPCR of FOXA1 mRNA expression in human normal organoids (n = 3) and patient-derived PDA organoids (n = 21). The mean +/- SEM is shown. p-values were determined by Student’s t-test.
(F-G) Representative immunohistochemistry (IHC) staining of anti-FOXA1 antibody and semi-quantitative analysis of FOXA1 staining intensity in human normal pancreas (F, n = 5), PDA primary tumors (n = 35) and metastases (n = 38; 36 liver, 1 small bowel and 1 diaphragm) tissue microarrays and sections from Rapid Autopsy Program (G). FOXA1 nuclear staining intensity is classified into negative, weak, moderate and strong. The insets show a higher magnification of the indicated area. Scale bars, 100 μm.
(H) Table shows GSEA summary for assessing differential enrichment of GAIN genes in the indicated stages of primitive gut tube differentiation from hES.
(I) Metegene representation of H3K27ac signal at GAIN regions during foregut differentiation of hES cells.
(A) Representation of RNA-seq based Foxa1 expression in T3/empty organoid or KPC- 2D/empty cells.
(B) Metagene representation of the mean H3K27ac ChIP-seq signal across GAIN regions in T3 organoid and KPC-2D/empty cells.
(C-D) Western blot (C) and RT-qPCR analysis (D) of Foxa1 expression in T6 organoid with Trp53 loss.
(E) Metagene representation of H3K27ac signal of T6/sgRosa, T6/sgTrp53 and M3L organoids at GAIN regions.
(F) Trp53 wild-type allele specific inactivation strategy using two gRNAs and representative chromatograms of Trp53 cDNA Sanger sequencing at R172H region in T organoid clones with Trp53 LOH.
(G) RT-qPCR analysis of Foxa1 expression in clonally derived Trp53 LOH clones (n = 14).
(H) Metagene representation of the mean FOXA1 (left) or H3K27ac (right) ChIP-seq signal across ALL regions in KPC-2D/empty and KPC-2D/FOXA1 cells.
(I) The cumulative proliferation of KPC-2D/empty and KPC-2D/FOXA1 cells (n = 3). The number of viable cells was counted by trypan blue exclusion. The mean +/− SEM is shown and p-value was determined by Student’s t-test.
(J) Clonogenic growth assay of KPC-2D/empty and KPC-2D/FOXA1 cells. One week after plating, colonies were stained with crystal violet to visualize and quantify clonogenic growth of KPC-2D cells.
(K) Exclusion zone based cell migration assay of KPC-2D/empty and KPC-2D/FOXA1 cells.
(L) Anchorage-independent sphere formation assay of MiaPaCa-2/empty and MiaPaCa-2/FOXA1 cells (n = 3). Bright field images were taken from 4x field after 2 weeks of culture and the size of spheres were measured for quantification. The mean +/− SEM is shown and p-value was determined by Student’s t-test. Scale bars, 500 μm.
(A) Metagene representation of the mean H3K27ac ChIP-seq signal across ALL regions in indicated organoids.
(B) TF motifs identified from 1,403 FOXA1 ChIP-seq peaks at GAIN regions.
(C-D) RNA-seq or microarray based GATA5, BATF2, PRRX2 and PAX9 mRNA expression in normal and neoplastic murine pancreatic organoids (C) or human PDA tumors (D), respectively. The mean +/− SEM is shown. p-value was determined by Student’s t-test.
(E) Enrichment of ONECUT1 motif in LOSS regions.
(F-G) RNA-seq or microarray based ONECUT1 mRNA expression in murine normal and neoplastic pancreatic organoids (F) or human PDA tumors (G). The mean +/− SEM is shown. p-value was determined by Student’s t-test.
(H) Boyden-chamber invasion assay of KPC-2D/empty, BATF2, GATA5, PRRX2 and PAX9 cells (n = 4 each). The mean +/− SEM is shown and p-value was determined by Student’s t-test. Scale bars, 500 μm.
(I) GATA5 expression during pancreatic differentiation of hES relative to gut tube stage.
(J) RT-qPCR analysis of GATA5 expression in human normal (n = 3) and patient-derived PDA organoids (n = 21).
(K) Clonogenic growth assay of KPC-2D/empty and KPC-2D/GATA5 cells. One week after plating, colonies were stained with crystal violet to visualize and quantify clonogenic growth of KPC-2D cells.
(L) Tail vein injection of KPC-2D/empty and KPC-2D/GATA5 cells (2.5 × 10⁵ cells) into C57Bl/6J mice to assess lung colonization at 4 weeks post-injection. Representative images of H&E staining are shown (right). Percent tumor area per lung lobe (%) was determined by dividing the whole surface area of the largest lung lobe with lung tumor area of the given lobe. The mean +/− SEM is shown and p-value was determined by Student’s t-test (n = 15).
(M) RT-qPCR validation of GAIN genes for a comparison of T3/empty vs T3/FOXA1-GATA5 (averaged from three biological replicates).
(N-O) Representative images of H&E staining of orthotopic injections of T3/empty and T3/FOXA1-GATA5 organoids. Scale bars, 100 μm.
(P) Summary of orthotopic injections of T3/empty and T3/FOXA1-GATA5 organoids.
(A) RT-qPCR analysis of Foxa1 mRNA in M1L/shRen or M1L/shFoxa1 (n = 3). The mean +/-SEM is shown. p-value was determined by Student’s t-test.
(B) Metagene representation of the mean FOXA1 (left) or H3K27ac (right) ChIP-seq signal across ALL regions in the indicated organoids.
(C) RT-qPCR validation of GAIN genes for a comparison of M1L/shRen vs M1L/shFoxa1 (averaged from three biological replicates).
(D) Summary of distant organ metastasis upon orthotopic injections of M/shRen or M/shFoxa1 (n = 10).
(E) CRISPR strategy targeting DNA-binding domain (DBD) of FOXA1 and qPCR validation of editing efficiency.
(F) GSEA of M1L/shFoxa1 versus M1L/sgFoxa1 using each top 100 downregulated genes.
(G) GSEA of M1L/sgFoxa1 versus M1L/sgRosa using GAIN genes (left), or posterior foregut signature genes (right).
(H) Quantification of primary tumor weight from injection site (pancreas) after orthotopic injection of M/sgRosa or M/sgFoxa1 organoids in athymic nu/nu mice (n = 5). 5 × 10⁵ cells were orthotopically injected and mice were sacrificed at 4 weeks post-injection. Each dot represents a mouse and the mean +/− SEM is shown. p-value was determined by Student’s t-test.
(I) Quantification of the number of mice bearing metastases upon orthotopic injection of M/sgRosa or M/sgFoxa1 organoids (n = 5).
(J) Summary of orthotopic injections of M1L/sgRosa and M1L/sgFoxa1 organoids.
Table S1. (Related to Figure 2) H3K27ac ChIP-seq signals at all 34,852 union peaks including 857 GAIN regions, from N, P, T and M organoids.
Table S2. (Related to Figure 2) RNA-seq profiling of N, P, T and M organoids (14,007 genes).
Table S3. (Related to Figure 3) Details of 118 JASPAR motifs enriched in GAIN regions.
Table S4. (Related to Figure 4–6) RNA-seq profiling of KPC-2D cells, hT2-2D cells, T organoids (T3 and T23) and M1L organoids.
Table S6. (Related to Figure 6 and Figure S6) Sequences of shRNAs (97-mers), sgRNAs and primers for genomic DNA-qPCR and RT-qPCR used in this study.
Highlights.
Recurrent changes in enhancer activity are associated with PDA metastasis
FOXA1 drives enhancer reprograming during PDA progression
Manipulation of FOXA1 in PDA cells alters enhancer activity and disease aggressiveness
FOXA1 drives an aberrant developmental transition in PDA towards embryonic endoderm
Acknowledgments
We would like to thank all members of the C.R.V. and D.A.T laboratories for helpful discussions and suggestions throughout the course of this study. The authors would like to thank the Cold Spring Harbor Cancer Center Support Grant (CCSG) shared resources: Bioinformatics Shared Resource, Microscope, Animal & tissue imaging, and the Animal Facility. We are grateful to Dr. Junichi Takagi at Osaka University for sharing the Afamin/Wnt3A cell line. The CCSG is funded by the National Cancer Institute. This project was funded by NCI 5P01CA013106-Project 4 (C.R.V.), a Career Development Award from the Pancreatic Cancer Action Network-AACR (C.R.V.), the Lustgarten Foundation, where D.A.T. is a distinguished scholar and Director of the Lustgarten Foundation–designated Laboratory of Pancreatic Cancer Research. D.A.T. is also supported by the Cold Spring Harbor Laboratory Association, the National Institutes of Health (NIH; 5P30CA45508-29, 5P50CA101955-07, 1U10CA180944-02, 5U01CA168409-5, 1R01CA188134-01, and 1R01CA190092-03), and the V Foundation. In addition, we are grateful for support from the following: Stand Up to Cancer/KWF (D.A.T.), NCI (1F32CA180717-01A1 for C.-I.H. and P50CA127297 for P.M.G, M.A.H., J.L.G., A.J.L. and J.A.G), Daiichi Sankyo Foundation of Life Science fellowship and Uehara memorial foundation research fellowship (K.M.), Stony Brook pilot project grant (J.M.B.), ASGE (J.M.B.), SWOG ITSC (E.J.K, D.A.T., H.T.) and NIH (R50CA211506-01 for Y.P., P20CA19299402 for J.M.B., D.A.T. and 5T32CA126607-08 for R.A.B.).
Footnotes
Publisher's Disclaimer: This is a PDF file of an unedited manuscript that has been accepted for publication. As a service to our customers we are providing this early version of the manuscript. The manuscript will undergo copyediting, typesetting, and review of the resulting proof before it is published in its final citable form. Please note that during the production process errors may be discovered which could affect the content, and all legal disclaimers that apply to the journal pertain.
Author contributions
J.-S.R., C.-I.H., D.A.T. and C.R.V. conceptualized this study and designed the experiments. J.-S.R. and C.-I.H. performed the majority of the experiments and contributed equally to this work. C.-I.H., E.J.L., B.D.S., D.F., B.C. and Y.P. established and characterized murine PDA organoids used in this study. J.-S.R. and C.-I.H. conducted ChIP-seq, ATAC-seq and RNA-Seq experiments. J.-S.R. conducted the majority of bioinformatics analysis. C.-I.H. conducted the majority of in vivo experiments. C.-I.H. and D.A.T. interpreted in vivo experiments. J.-S.R. conducted and interpreted in vitro metastasis assay experiments. J.-S.R., C.-I.H. and J.P.M. conducted and interpreted tail vein injection experiments. T.D.D.S. profiled gene expression in human organoid samples and performed in vitro assays with human cell lines. H.T., C.M.Y., K.M., R.A.B optimized human organoid methods and isolated patient-derived organoids. R.A.B., J.M.B., and E.J.K. provided clinical specimens. L.M. and M.E. performed portal vein injection experiments and assisted in vitro and in vivo metastasis experiments. P.M.G., M.A.H., J.L.G., A.J.L. and J.A.G. were involved in rapid autopsy program for human specimens. J.-S.R., C.-I.H., D.A.T. and C.R.V. wrote this manuscript. D.A.T. and C.R.V. supervised throughout the study.
Date and Software Availability
The accession number for the data for ChIP-seq, RNA-seq, and ATAC-seq reported in this study is NCBI GEO: GSE99311.
References
- Abraham BJ, Hnisz D, Weintraub AS, Kwiatkowski N, Li CH, Li Z, Weichert-Leahey N, Rahman S, Liu Y, Etchin J, et al. Small genomic insertions form enhancers that misregulate oncogenes. Nat Commun. 2017;8:14385. doi: 10.1038/ncomms14385. [DOI] [PMC free article] [PubMed] [Google Scholar]
- Bailey P, Chang DK, Nones K, Johns AL, Patch AM, Gingras MC, Miller DK, Christ AN, Bruxner TJ, Quinn MC, et al. Genomic analyses identify molecular subtypes of pancreatic cancer. Nature. 2016;531:47–52. doi: 10.1038/nature16965. [DOI] [PubMed] [Google Scholar]
- Boj SF, Hwang CI, Baker LA, Chio II, Engle DD, Corbo V, Jager M, Ponz-Sarvise M, Tiriac H, Spector MS, et al. Organoid models of human and mouse ductal pancreatic cancer. Cell. 2015;160:324–338. doi: 10.1016/j.cell.2014.12.021. [DOI] [PMC free article] [PubMed] [Google Scholar]
- Buenrostro JD, Giresi PG, Zaba LC, Chang HY, Greenleaf WJ. Transposition of native chromatin for fast and sensitive epigenomic profiling of open chromatin, DNA-binding proteins and nucleosome position. Nat Methods. 2013;10:1213–1218. doi: 10.1038/nmeth.2688. [DOI] [PMC free article] [PubMed] [Google Scholar]
- Campbell PJ, Yachida S, Mudie LJ, Stephens PJ, Pleasance ED, Stebbings LA, Morsberger LA, Latimer C, McLaren S, Lin ML, et al. The patterns and dynamics of genomic instability in metastatic pancreatic cancer. Nature. 2010;467:1109–1113. doi: 10.1038/nature09460. [DOI] [PMC free article] [PubMed] [Google Scholar]
- Chio II, Jafarnejad SM, Ponz-Sarvise M, Park Y, Rivera K, Palm W, Wilson J, Sangar V, Hao Y, Ohlund D, et al. NRF2 Promotes Tumor Maintenance by Modulating mRNA Translation in Pancreatic Cancer. Cell. 2016;166:963–976. doi: 10.1016/j.cell.2016.06.056. [DOI] [PMC free article] [PubMed] [Google Scholar]
- Christensen CL, Kwiatkowski N, Abraham BJ, Carretero J, Al-Shahrour F, Zhang T, Chipumuro E, Herter-Sprie GS, Akbay EA, Altabef A, et al. Targeting transcriptional addictions in small cell lung cancer with a covalent CDK7 inhibitor. Cancer Cell. 2014;26:909–922. doi: 10.1016/j.ccell.2014.10.019. [DOI] [PMC free article] [PubMed] [Google Scholar]
- Collisson EA, Sadanandam A, Olson P, Gibb WJ, Truitt M, Gu S, Cooc J, Weinkle J, Kim GE, Jakkula L, et al. Subtypes of pancreatic ductal adenocarcinoma and their differing responses to therapy. Nat Med. 2011;17:500–503. doi: 10.1038/nm.2344. [DOI] [PMC free article] [PubMed] [Google Scholar]
- Denny SK, Yang D, Chuang CH, Brady JJ, Lim JS, Gruner BM, Chiou SH, Schep AN, Baral J, Hamard C, et al. Nfib Promotes Metastasis through a Widespread Increase in Chromatin Accessibility. Cell. 2016;166:328–342. doi: 10.1016/j.cell.2016.05.052. [DOI] [PMC free article] [PubMed] [Google Scholar]
- Diaferia GR, Balestrieri C, Prosperini E, Nicoli P, Spaggiari P, Zerbi A, Natoli G. Dissection of transcriptional and cis-regulatory control of differentiation in human pancreatic cancer. EMBO J. 2016;35:595–617. doi: 10.15252/embj.201592404. [DOI] [PMC free article] [PubMed] [Google Scholar]
- Fellmann C, Hoffmann T, Sridhar V, Hopfgartner B, Muhar M, Roth M, Lai DY, Barbosa IA, Kwon JS, Guan Y, et al. An optimized microRNA backbone for effective single-copy RNAi. Cell Rep. 2013;5:1704–1713. doi: 10.1016/j.celrep.2013.11.020. [DOI] [PubMed] [Google Scholar]
- Gao N, LeLay J, Vatamaniuk MZ, Rieck S, Friedman JR, Kaestner KH. Dynamic regulation of Pdx1 enhancers by Foxa1 and Foxa2 is essential for pancreas development. Genes Dev. 2008;22:3435–3448. doi: 10.1101/gad.1752608. [DOI] [PMC free article] [PubMed] [Google Scholar]
- Guerra C, Barbacid M. Genetically engineered mouse models of pancreatic adenocarcinoma. Mol Oncol. 2013;7:232–247. doi: 10.1016/j.molonc.2013.02.002. [DOI] [PMC free article] [PubMed] [Google Scholar]
- Heinz S, Benner C, Spann N, Bertolino E, Lin YC, Laslo P, Cheng JX, Murre C, Singh H, Glass CK. Simple combinations of lineage-determining transcription factors prime cis-regulatory elements required for macrophage and B cell identities. Mol Cell. 2010;38:576–589. doi: 10.1016/j.molcel.2010.05.004. [DOI] [PMC free article] [PubMed] [Google Scholar]
- Hessmann E, Johnsen SA, Siveke JT, Ellenrieder V. Epigenetic treatment of pancreatic cancer: is there a therapeutic perspective on the horizon? Gut. 2017;66:168–179. doi: 10.1136/gutjnl-2016-312539. [DOI] [PMC free article] [PubMed] [Google Scholar]
- Hingorani SR, Wang L, Multani AS, Combs C, Deramaudt TB, Hruban RH, Rustgi AK, Chang S, Tuveson DA. Trp53R172H and KrasG12D cooperate to promote chromosomal instability and widely metastatic pancreatic ductal adenocarcinoma in mice. Cancer Cell. 2005;7:469–483. doi: 10.1016/j.ccr.2005.04.023. [DOI] [PubMed] [Google Scholar]
- Hruban RH, Goggins M, Parsons J, Kern SE. Progression model for pancreatic cancer. Clin Cancer Res. 2000;6:2969–2972. [PubMed] [Google Scholar]
- Kong SL, Li G, Loh SL, Sung WK, Liu ET. Cellular reprogramming by the conjoint action of ERalpha, FOXA1, and GATA3 to a ligand-inducible growth state. Mol Syst Biol. 2011;7:526. doi: 10.1038/msb.2011.59. [DOI] [PMC free article] [PubMed] [Google Scholar]
- Krebs AM, Mitschke J, Lasierra Losada M, Schmalhofer O, Boerries M, Busch H, Boettcher M, Mougiakakos D, Reichardt W, Bronsert P, et al. The EMT-activator Zeb1 is a key factor for cell plasticity and promotes metastasis in pancreatic cancer. Nat Cell Biol. 2017;19:518–529. doi: 10.1038/ncb3513. [DOI] [PubMed] [Google Scholar]
- Kugel S, Sebastian C, Fitamant J, Ross KN, Saha SK, Jain E, Gladden A, Arora KS, Kato Y, Rivera MN, et al. SIRT6 Suppresses Pancreatic Cancer through Control of Lin28b. Cell. 2016;165:1401–1415. doi: 10.1016/j.cell.2016.04.033. [DOI] [PMC free article] [PubMed] [Google Scholar]
- Langmead B, Trapnell C, Pop M, Salzberg SL. Ultrafast and memory-efficient alignment of short DNA sequences to the human genome. Genome Biol. 2009;10:R25. doi: 10.1186/gb-2009-10-3-r25. [DOI] [PMC free article] [PubMed] [Google Scholar]
- Larsen HL, Grapin-Botton A. The molecular and morphogenetic basis of pancreas organogenesis. Semin Cell Dev Biol. 2017 doi: 10.1016/j.semcdb.2017.01.005. [DOI] [PubMed] [Google Scholar]
- Levine AJ, Greenbaum B. The maintenance of epigenetic states by p53: the guardian of the epigenome. Oncotarget. 2012;3:1503–1504. doi: 10.18632/oncotarget.780. [DOI] [PMC free article] [PubMed] [Google Scholar]
- Li H, Handsaker B, Wysoker A, Fennell T, Ruan J, Homer N, Marth G, Abecasis G, Durbin R, Genome Project Data Processing, S The Sequence Alignment/Map format and SAMtools. Bioinformatics. 2009;25:2078–2079. doi: 10.1093/bioinformatics/btp352. [DOI] [PMC free article] [PubMed] [Google Scholar]
- Lin CY, Loven J, Rahl PB, Paranal RM, Burge CB, Bradner JE, Lee TI, Young RA. Transcriptional amplification in tumor cells with elevated c-Myc. Cell. 2012;151:56–67. doi: 10.1016/j.cell.2012.08.026. [DOI] [PMC free article] [PubMed] [Google Scholar]
- Loh KM, Ang LT, Zhang J, Kumar V, Ang J, Auyeong JQ, Lee KL, Choo SH, Lim CY, Nichane M, et al. Efficient endoderm induction from human pluripotent stem cells by logically directing signals controlling lineage bifurcations. Cell Stem Cell. 2014;14:237–252. doi: 10.1016/j.stem.2013.12.007. [DOI] [PMC free article] [PubMed] [Google Scholar]
- Long HK, Prescott SL, Wysocka J. Ever-Changing Landscapes: Transcriptional Enhancers in Development and Evolution. Cell. 2016;167:1170–1187. doi: 10.1016/j.cell.2016.09.018. [DOI] [PMC free article] [PubMed] [Google Scholar]
- Makohon-Moore AP, Zhang M, Reiter JG, Bozic I, Allen B, Kundu D, Chatterjee K, Wong F, Jiao Y, Kohutek ZA, et al. Limited heterogeneity of known driver gene mutations among the metastases of individual patients with pancreatic cancer. Nat Genet. 2017;49:358–366. doi: 10.1038/ng.3764. [DOI] [PMC free article] [PubMed] [Google Scholar]
- McDonald OG, Li X, Saunders T, Tryggvadottir R, Mentch SJ, Warmoes MO, Word AE, Carrer A, Salz TH, Natsume S, et al. Epigenomic reprogramming during pancreatic cancer progression links anabolic glucose metabolism to distant metastasis. Nat Genet. 2017;49:367–376. doi: 10.1038/ng.3753. [DOI] [PMC free article] [PubMed] [Google Scholar]
- McLean CY, Bristor D, Hiller M, Clarke SL, Schaar BT, Lowe CB, Wenger AM, Bejerano G. GREAT improves functional interpretation of cis-regulatory regions. Nat Biotechnol. 2010;28:495–501. doi: 10.1038/nbt.1630. [DOI] [PMC free article] [PubMed] [Google Scholar]
- Mihara E, Hirai H, Yamamoto H, Tamura-Kawakami K, Matano M, Kikuchi A, Sato T, Takagi J. Active and water-soluble form of lipidated Wnt protein is maintained by a serum glycoprotein afamin/alpha-albumin. Elife. 2016;5 doi: 10.7554/eLife.11621. [DOI] [PMC free article] [PubMed] [Google Scholar]
- Moffitt RA, Marayati R, Flate EL, Volmar KE, Loeza SG, Hoadley KA, Rashid NU, Williams LA, Eaton SC, Chung AH, et al. Virtual microdissection identifies distinct tumor- and stroma-specific subtypes of pancreatic ductal adenocarcinoma. Nat Genet. 2015;47:1168–1178. doi: 10.1038/ng.3398. [DOI] [PMC free article] [PubMed] [Google Scholar]
- Muzumdar MD, Dorans KJ, Chung KM, Robbins R, Tammela T, Gocheva V, Li CM, Jacks T. Clonal dynamics following p53 loss of heterozygosity in Kras-driven cancers. Nat Commun. 2016;7:12685. doi: 10.1038/ncomms12685. [DOI] [PMC free article] [PubMed] [Google Scholar]
- Neureiter D, Jager T, Ocker M, Kiesslich T. Epigenetics and pancreatic cancer: pathophysiology and novel treatment aspects. World J Gastroenterol. 2014;20:7830–7848. doi: 10.3748/wjg.v20.i24.7830. [DOI] [PMC free article] [PubMed] [Google Scholar]
- Ohlund D, Elyada E, Tuveson D. Fibroblast heterogeneity in the cancer wound. J Exp Med. 2014;211:1503–1523. doi: 10.1084/jem.20140692. [DOI] [PMC free article] [PubMed] [Google Scholar]
- Quinlan AR, Hall IM. BEDTools: a flexible suite of utilities for comparing genomic features. Bioinformatics. 2010;26:841–842. doi: 10.1093/bioinformatics/btq033. [DOI] [PMC free article] [PubMed] [Google Scholar]
- Ryan DP, Hong TS, Bardeesy N. Pancreatic adenocarcinoma. N Engl J Med. 2014;371:1039–1049. doi: 10.1056/NEJMra1404198. [DOI] [PubMed] [Google Scholar]
- Sakai Y, Yanagisawa A, Shimada M, Hidaka E, Seki M, Tada Y, Harada T, Saisho H, Kato Y. K-ras gene mutations and loss of heterozygosity at the p53 gene locus relative to histological characteristics of mucin-producing tumors of the pancreas. Hum Pathol. 2000;31:795–803. doi: 10.1053/hupa.2000.8442. [DOI] [PubMed] [Google Scholar]
- Sekiya S, Suzuki A. Direct conversion of mouse fibroblasts to hepatocyte-like cells by defined factors. Nature. 2011;475:390–393. doi: 10.1038/nature10263. [DOI] [PubMed] [Google Scholar]
- Shi J, Wang E, Milazzo JP, Wang Z, Kinney JB, Vakoc CR. Discovery of cancer drug targets by CRISPR-Cas9 screening of protein domains. Nat Biotechnol. 2015;33:661–667. doi: 10.1038/nbt.3235. [DOI] [PMC free article] [PubMed] [Google Scholar]
- Siegel RL, Miller KD, Jemal A. Cancer Statistics, 2017. CA Cancer J Clin. 2017;67:7–30. doi: 10.3322/caac.21387. [DOI] [PubMed] [Google Scholar]
- Soares KC, Foley K, Olino K, Leubner A, Mayo SC, Jain A, Jaffee E, Schulick RD, Yoshimura K, Edil B, et al. A preclinical murine model of hepatic metastases. J Vis Exp. 2014:51677. doi: 10.3791/51677. [DOI] [PMC free article] [PubMed] [Google Scholar]
- Song Y, Washington MK, Crawford HC. Loss of FOXA1/2 is essential for the epithelial-to-mesenchymal transition in pancreatic cancer. Cancer Res. 2010;70:2115–2125. doi: 10.1158/0008-5472.CAN-09-2979. [DOI] [PMC free article] [PubMed] [Google Scholar]
- Spitz F, Furlong EE. Transcription factors: from enhancer binding to developmental control. Nat Rev Genet. 2012;13:613–626. doi: 10.1038/nrg3207. [DOI] [PubMed] [Google Scholar]
- Stelnicki EJ, Arbeit J, Cass DL, Saner C, Harrison M, Largman C. Modulation of the human homeobox genes PRX-2 and HOXB13 in scarless fetal wounds. J Invest Dermatol. 1998;111:57–63. doi: 10.1046/j.1523-1747.1998.00238.x. [DOI] [PubMed] [Google Scholar]
- Thomas-Chollier M, Hufton A, Heinig M, O’Keeffe S, Masri NE, Roider HG, Manke T, Vingron M. Transcription factor binding predictions using TRAP for the analysis of ChIP-seq data and regulatory SNPs. Nat Protoc. 2011;6:1860–1869. doi: 10.1038/nprot.2011.409. [DOI] [PubMed] [Google Scholar]
- Trapnell C, Pachter L, Salzberg SL. TopHat: discovering splice junctions with RNA-Seq. Bioinformatics. 2009;25:1105–1111. doi: 10.1093/bioinformatics/btp120. [DOI] [PMC free article] [PubMed] [Google Scholar]
- Trapnell C, Williams BA, Pertea G, Mortazavi A, Kwan G, van Baren MJ, Salzberg SL, Wold BJ, Pachter L. Transcript assembly and quantification by RNA-Seq reveals unannotated transcripts and isoform switching during cell differentiation. Nat Biotechnol. 2010;28:511–515. doi: 10.1038/nbt.1621. [DOI] [PMC free article] [PubMed] [Google Scholar]
- Tripathi S, Pohl MO, Zhou Y, Rodriguez-Frandsen A, Wang G, Stein DA, Moulton HM, DeJesus P, Che J, Mulder LC, et al. Meta- and Orthogonal Integration of Influenza “OMICs” Data Defines a Role for UBR4 in Virus Budding. Cell Host Microbe. 2015;18:723–735. doi: 10.1016/j.chom.2015.11.002. [DOI] [PMC free article] [PubMed] [Google Scholar]
- Vigil D, Martin TD, Williams F, Yeh JJ, Campbell SL, Der CJ. Aberrant overexpression of the Rgl2 Ral small GTPase-specific guanine nucleotide exchange factor promotes pancreatic cancer growth through Ral-dependent and Ral-independent mechanisms. J Biol Chem. 2010;285:34729–34740. doi: 10.1074/jbc.M110.116756. [DOI] [PMC free article] [PubMed] [Google Scholar]
- Waddell N, Pajic M, Patch AM, Chang DK, Kassahn KS, Bailey P, Johns AL, Miller D, Nones K, Quek K, et al. Whole genomes redefine the mutational landscape of pancreatic cancer. Nature. 2015;518:495–501. doi: 10.1038/nature14169. [DOI] [PMC free article] [PubMed] [Google Scholar]
- Weissmueller S, Manchado E, Saborowski M, Morris JPt, Wagenblast E, Davis CA, Moon SH, Pfister NT, Tschaharganeh DF, Kitzing T, et al. Mutant p53 drives pancreatic cancer metastasis through cell-autonomous PDGF receptor beta signaling. Cell. 2014;157:382–394. doi: 10.1016/j.cell.2014.01.066. [DOI] [PMC free article] [PubMed] [Google Scholar]
- Whittle MC, Izeradjene K, Rani PG, Feng L, Carlson MA, DelGiorno KE, Wood LD, Goggins M, Hruban RH, Chang AE, et al. RUNX3 Controls a Metastatic Switch in Pancreatic Ductal Adenocarcinoma. Cell. 2015;161:1345–1360. doi: 10.1016/j.cell.2015.04.048. [DOI] [PMC free article] [PubMed] [Google Scholar]
- Xie R, Everett LJ, Lim HW, Patel NA, Schug J, Kroon E, Kelly OG, Wang A, D’Amour KA, Robins AJ, et al. Dynamic chromatin remodeling mediated by polycomb proteins orchestrates pancreatic differentiation of human embryonic stem cells. Cell Stem Cell. 2013;12:224–237. doi: 10.1016/j.stem.2012.11.023. [DOI] [PMC free article] [PubMed] [Google Scholar]
- Yachida S, Jones S, Bozic I, Antal T, Leary R, Fu B, Kamiyama M, Hruban RH, Eshleman JR, Nowak MA, et al. Distant metastasis occurs late during the genetic evolution of pancreatic cancer. Nature. 2010;467:1114–1117. doi: 10.1038/nature09515. [DOI] [PMC free article] [PubMed] [Google Scholar]
- Yamano M, Fujii H, Takagaki T, Kadowaki N, Watanabe H, Shirai T. Genetic progression and divergence in pancreatic carcinoma. Am J Pathol. 2000;156:2123–2133. doi: 10.1016/S0002-9440(10)65083-3. [DOI] [PMC free article] [PubMed] [Google Scholar]
- Ye X, Weinberg RA. Epithelial-Mesenchymal Plasticity: A Central Regulator of Cancer Progression. Trends Cell Biol. 2015;25:675–686. doi: 10.1016/j.tcb.2015.07.012. [DOI] [PMC free article] [PubMed] [Google Scholar]
- Yue F, Cheng Y, Breschi A, Vierstra J, Wu W, Ryba T, Sandstrom R, Ma Z, Davis C, Pope BD, et al. A comparative encyclopedia of DNA elements in the mouse genome. Nature. 2014;515:355–364. doi: 10.1038/nature13992. [DOI] [PMC free article] [PubMed] [Google Scholar]
- Zaret KS, Lerner J, Iwafuchi-Doi M. Chromatin Scanning by Dynamic Binding of Pioneer Factors. Mol Cell. 2016;62:665–667. doi: 10.1016/j.molcel.2016.05.024. [DOI] [PMC free article] [PubMed] [Google Scholar]
- Zentner GE, Scacheri PC. The chromatin fingerprint of gene enhancer elements. J Biol Chem. 2012;287:30888–30896. doi: 10.1074/jbc.R111.296491. [DOI] [PMC free article] [PubMed] [Google Scholar]
Associated Data
This section collects any data citations, data availability statements, or supplementary materials included in this article.
Supplementary Materials
(A) Table shows six pairs of matched primary tumor- and metastasis-derived organoids used in this study.
(B) PCR-based genotyping for assessing loss-of-heterozygosity of the Trp53 allele in T and M organoids used in this study.
(C) Representative images of H&E staining of orthotopic transplants of T3 or M1L organoids in C57Bl/6J mice. Mice were sacrificed at the indicated time after injection. Insets show higher magnification of the indicated area. Scale bars, 100 μm.
(D) Quantification of the number of lung tumor nodules per section after tail vein injection of indicated organoids (n = 4).
(E-F) Representative bright field images (E, left) and H&E staining (E, right) of liver and percentage of mice with liver tumor (F) 2 months after intra-splenic injection of T3 and M1L organoids (n = 4) in C57Bl/6J mice. Scale bars, 100 μm.
(G-H) Representative bright field images (G, left) and H&E staining (G, right) of tumors and quantification of the peritoneal tumor size (H) after peritoneal wall injection of indicated organoids (n = 4). Scale bars, 500 μm.
For bar charts, each dot represents a mouse and the mean +/− SEM is shown. p-value was determined by Student’s t-test.
(A) GSEA-based comparison of patient- and organoid-derived gene expression profiles at matched stage of PDA progression.
(B) Column-normalized heat map representation of known drivers of PDA metastasis in N, P, T and M organoids.
(C) Number of H3K27ac peaks decreased more than 10-fold relative to Navg in the indicated organoids.
(D) Recurrence of GAIN and LOSS regions in M organoids. Fraction of GAIN or LOSS regions that are present in more than two M organoids is shown as red or blue, respectively.
(E) Western blot analysis of H3K27ac in total histones from the indicated organoids.
(F) Heatmap representation of LOSS regions based on H3K27ac occupancy in organoids. The 1,709 LOSS regions were identified from the union of all gained H3K27ac peaks described in Figure 2B. 10-Kb around the center of LOSS regions are displayed for each organoid. Each row represents a single region (n = 1,709). Each column represents an individual organoid (n = 16).
(G) Representative H3K27ac ChIP-seq profiles of LOSS regions at Onecut1 and Fgfr2 loci in N, P, T and M organoids.
(H) Pie chart showing the genomic annotations of 1,709 LOSS regions according to the location of a given peak. TSS, ‘−1-kb to +100-bp’ of transcription start sites. TTS, ‘−100-bp to +1-Kb’ of transcription termination sites. UTR includes both 5′ and 3′ UTRs.
(I) GSEA of averaged Mavg versus averaged Tavg RNA-seq using GAIN (top) and LOSS genes (bottom).
(J) Metagene representation of H3K27ac signal in GAIN regions of human PDA cell lines (left) and patient-derived PDA organoids (right). Other cancers include 6 leukemia, 2 neuroblastoma and 2 non-small cell lung cancer cell lines (Abraham et al., 2017; Christensen et al., 2014; Lin et al., 2012).
(K) Metagene representation of the mean ATAC-seq signal at GAIN regions in the indicated organoids.
(L) Metagene representation of the mean ChIP-seq signal for H3K27ac (left), H3K4me1 (middle) and ATAC-seq (right) at ALL regions in the indicated organoids.
(M) Metagene representation of the mean ChIP-seq signal for H3K27ac at LOSS regions in the indicated organoids.
(N) Gene ontology (GO) analysis of genes proximal to 857 GAIN regions with Metascape. Default gene regulatory domain definition of GREAT tool (basal plus extension) was used to assign GAIN regions-associated genes, which yielded 1,090 genes. Only the top 10 GO terms ranked by their significance (p-value) are shown.
(O) Column-normalized heat map representation of epithelial-mesenchymal transition (EMT)-related gene in N, P, T and M organoids. Each row represents an indicated organoid, and each column represents an individual EMT-related gene; genes indicated as red are known to be upregulated during EMT, and genes indicated as blue are known to be downregulated during EMT.
(A) Representation of motifs enriched in GAIN regions, related to Figure 3A.
(B) H3K27ac ChIP-seq profiles at Foxa1 and Gata5 loci in N, P, T and M organoids.
(C) RNA-seq based Foxa2 mRNA expression in organoids. Each dot represents an independent organoid culture, and the mean +/− SEM is shown. p-value was determined by Student’s t-test.
(D) Metagene representation of the mean FOXA1 ChIP-seq signal at ALL regions in the indicated organoids.
(E) RT-qPCR of FOXA1 mRNA expression in human normal organoids (n = 3) and patient-derived PDA organoids (n = 21). The mean +/- SEM is shown. p-values were determined by Student’s t-test.
(F-G) Representative immunohistochemistry (IHC) staining of anti-FOXA1 antibody and semi-quantitative analysis of FOXA1 staining intensity in human normal pancreas (F, n = 5), PDA primary tumors (n = 35) and metastases (n = 38; 36 liver, 1 small bowel and 1 diaphragm) tissue microarrays and sections from Rapid Autopsy Program (G). FOXA1 nuclear staining intensity is classified into negative, weak, moderate and strong. The insets show a higher magnification of the indicated area. Scale bars, 100 μm.
(H) Table shows GSEA summary for assessing differential enrichment of GAIN genes in the indicated stages of primitive gut tube differentiation from hES.
(I) Metegene representation of H3K27ac signal at GAIN regions during foregut differentiation of hES cells.
(A) Representation of RNA-seq based Foxa1 expression in T3/empty organoid or KPC- 2D/empty cells.
(B) Metagene representation of the mean H3K27ac ChIP-seq signal across GAIN regions in T3 organoid and KPC-2D/empty cells.
(C-D) Western blot (C) and RT-qPCR analysis (D) of Foxa1 expression in T6 organoid with Trp53 loss.
(E) Metagene representation of H3K27ac signal of T6/sgRosa, T6/sgTrp53 and M3L organoids at GAIN regions.
(F) Trp53 wild-type allele specific inactivation strategy using two gRNAs and representative chromatograms of Trp53 cDNA Sanger sequencing at R172H region in T organoid clones with Trp53 LOH.
(G) RT-qPCR analysis of Foxa1 expression in clonally derived Trp53 LOH clones (n = 14).
(H) Metagene representation of the mean FOXA1 (left) or H3K27ac (right) ChIP-seq signal across ALL regions in KPC-2D/empty and KPC-2D/FOXA1 cells.
(I) The cumulative proliferation of KPC-2D/empty and KPC-2D/FOXA1 cells (n = 3). The number of viable cells was counted by trypan blue exclusion. The mean +/− SEM is shown and p-value was determined by Student’s t-test.
(J) Clonogenic growth assay of KPC-2D/empty and KPC-2D/FOXA1 cells. One week after plating, colonies were stained with crystal violet to visualize and quantify clonogenic growth of KPC-2D cells.
(K) Exclusion zone based cell migration assay of KPC-2D/empty and KPC-2D/FOXA1 cells.
(L) Anchorage-independent sphere formation assay of MiaPaCa-2/empty and MiaPaCa-2/FOXA1 cells (n = 3). Bright field images were taken from 4x field after 2 weeks of culture and the size of spheres were measured for quantification. The mean +/− SEM is shown and p-value was determined by Student’s t-test. Scale bars, 500 μm.
(A) Metagene representation of the mean H3K27ac ChIP-seq signal across ALL regions in indicated organoids.
(B) TF motifs identified from 1,403 FOXA1 ChIP-seq peaks at GAIN regions.
(C-D) RNA-seq or microarray based GATA5, BATF2, PRRX2 and PAX9 mRNA expression in normal and neoplastic murine pancreatic organoids (C) or human PDA tumors (D), respectively. The mean +/− SEM is shown. p-value was determined by Student’s t-test.
(E) Enrichment of ONECUT1 motif in LOSS regions.
(F-G) RNA-seq or microarray based ONECUT1 mRNA expression in murine normal and neoplastic pancreatic organoids (F) or human PDA tumors (G). The mean +/− SEM is shown. p-value was determined by Student’s t-test.
(H) Boyden-chamber invasion assay of KPC-2D/empty, BATF2, GATA5, PRRX2 and PAX9 cells (n = 4 each). The mean +/− SEM is shown and p-value was determined by Student’s t-test. Scale bars, 500 μm.
(I) GATA5 expression during pancreatic differentiation of hES relative to gut tube stage.
(J) RT-qPCR analysis of GATA5 expression in human normal (n = 3) and patient-derived PDA organoids (n = 21).
(K) Clonogenic growth assay of KPC-2D/empty and KPC-2D/GATA5 cells. One week after plating, colonies were stained with crystal violet to visualize and quantify clonogenic growth of KPC-2D cells.
(L) Tail vein injection of KPC-2D/empty and KPC-2D/GATA5 cells (2.5 × 10⁵ cells) into C57Bl/6J mice to assess lung colonization at 4 weeks post-injection. Representative images of H&E staining are shown (right). Percent tumor area per lung lobe (%) was determined by dividing the whole surface area of the largest lung lobe with lung tumor area of the given lobe. The mean +/− SEM is shown and p-value was determined by Student’s t-test (n = 15).
(M) RT-qPCR validation of GAIN genes for a comparison of T3/empty vs T3/FOXA1-GATA5 (averaged from three biological replicates).
(N-O) Representative images of H&E staining of orthotopic injections of T3/empty and T3/FOXA1-GATA5 organoids. Scale bars, 100 μm.
(P) Summary of orthotopic injections of T3/empty and T3/FOXA1-GATA5 organoids.
(A) RT-qPCR analysis of Foxa1 mRNA in M1L/shRen or M1L/shFoxa1 (n = 3). The mean +/-SEM is shown. p-value was determined by Student’s t-test.
(B) Metagene representation of the mean FOXA1 (left) or H3K27ac (right) ChIP-seq signal across ALL regions in the indicated organoids.
(C) RT-qPCR validation of GAIN genes for a comparison of M1L/shRen vs M1L/shFoxa1 (averaged from three biological replicates).
(D) Summary of distant organ metastasis upon orthotopic injections of M/shRen or M/shFoxa1 (n = 10).
(E) CRISPR strategy targeting DNA-binding domain (DBD) of FOXA1 and qPCR validation of editing efficiency.
(F) GSEA of M1L/shFoxa1 versus M1L/sgFoxa1 using each top 100 downregulated genes.
(G) GSEA of M1L/sgFoxa1 versus M1L/sgRosa using GAIN genes (left), or posterior foregut signature genes (right).
(H) Quantification of primary tumor weight from injection site (pancreas) after orthotopic injection of M/sgRosa or M/sgFoxa1 organoids in athymic nu/nu mice (n = 5). 5 × 10⁵ cells were orthotopically injected and mice were sacrificed at 4 weeks post-injection. Each dot represents a mouse and the mean +/− SEM is shown. p-value was determined by Student’s t-test.
(I) Quantification of the number of mice bearing metastases upon orthotopic injection of M/sgRosa or M/sgFoxa1 organoids (n = 5).
(J) Summary of orthotopic injections of M1L/sgRosa and M1L/sgFoxa1 organoids.
Table S1. (Related to Figure 2) H3K27ac ChIP-seq signals at all 34,852 union peaks including 857 GAIN regions, from N, P, T and M organoids.
Table S2. (Related to Figure 2) RNA-seq profiling of N, P, T and M organoids (14,007 genes).
Table S3. (Related to Figure 3) Details of 118 JASPAR motifs enriched in GAIN regions.
Table S4. (Related to Figure 4–6) RNA-seq profiling of KPC-2D cells, hT2-2D cells, T organoids (T3 and T23) and M1L organoids.
Table S6. (Related to Figure 6 and Figure S6) Sequences of shRNAs (97-mers), sgRNAs and primers for genomic DNA-qPCR and RT-qPCR used in this study.