Abstract
We investigated whether the administration of Lactobacillus paracasei CNCM I-4034, Bifidobacterium breve CNCM I-4035 and Lactobacillus rhamnosus CNCM I-4036 modulate the expression of genes in the intestinal mucosa of obese Zucker rats. Forty-eight Zucker-Leprfa/fa and 16 Zucker lean Lepr+/fa rats were used. Eight Zucker lean Lepr+/fa and 8 Zucker-Leprfa/fa rats were euthanized as a reference. The remaining 40 Zucker-Leprfa/fa rats were then assigned to receive 1010 colony forming units (CFU) of one of the three probiotic strains, a mixture of L. paracasei CNCM I-4034 and B. breve CNCM I-4035, or a placebo by oral administration for 30 days. An additional group of 8 Zucker lean Lepr+/fa rats received the placebo for 30 days. Over 27,000 rat genes were studied using a DNA array. Four animals per group were used. Total RNA was extracted from intestinal mucosa and cDNA was synthesized, fragmented and labeled. Labeled cDNA was hybridized using GeneChip kits, and the latter were scanned. Intensity values of each probe were processed and normalized to obtain an individual value for each set of probes.
Subject terms: Applied microbiology, Metabolic disorders
Background & Summary
Metabolic syndrome, better referred to as insulin resistance syndrome (IRS), was originally defined as concomitant hyperlipidemia, hypertension, insulin resistance and obesity1,2. IRS often precedes the onset of type 2 diabetes and increases the risk of cardiovascular disease3,4. Accordingly, IRS has reached pandemic levels and become a major public health concern.
The Zucker rat shows many of the features of IRS; therefore, it is one of the most commonly used genetic models of this syndrome4. Zucker-Leprfa/fa rats exhibit obesity, hyperglycemia, insulin resistance, hypercholesterolemia, hypertriglyceridemia, and elevated serum free fatty acid concentrations in contrast to Zucker lean Lepr+/fa rats. In addition, Zucker-Leprfa/fa rats have hepatic steatosis, as well as elevated serum aspartate aminotransferase (AST) and alanine aminotransferase (ALT) activities, indicating that the liver component of IRS is also present in this model5.
Probiotics are live microorganisms that, when consumed in adequate amounts, confer a health effect on the host6. Beneficial effects of probiotics have been reported in allergy, intestinal-related diseases, chronic liver disease, urinary tract infections and respiratory infections, among others7. Lactobacilli and bifidobacteria are the genera most frequently used as probiotics. A variety of mechanisms underlying their beneficial effects have been proposed: modification of the gut microbiota, competitive adherence to the mucosa and epithelium, strengthening of the gut epithelial barrier and modulation of the immune system to convey an advantage to the host8.
We have previously reported that the administration of three probiotic strains (Lactobacillus paracasei CNCM I-4034, Bifidobacterium breve CNCM I-4035 and Lactobacillus rhamnosus CNCM I-4036) to healthy human volunteers for 30 days is totally safe9 and that their administration for the same period of time to Zucker-Leprfa/fa rats attenuates the accumulation of fat in the rats’ liver and exerts anti-inflammatory effects such as lower serum concentrations of tumor necrosis factor (TNF)-α, interleukin (IL)-6 and bacterial lipopolysaccharide (LPS)5. These three probiotic strains were isolated from the feces of breast-fed newborns. They were selected based on their in vitro properties such as adhesion to intestinal cells, sensitivity to antibiotics, and resistance to both acid pH and biliary salts. We have showed their safety in immunocompetent and immunodepressed mice, and that they inhibit in vitro the growth of Listeria monocytogenes as well as infections by human rotavirus10.
Some authors have described the modulation of gene expression by probiotics. Dykstra et al.11 reported the induction of the gene coding for mucin 3 (Muc3) in the small intestine of rats fed Lactobacillus plantarum 299v, Lactobacillus rhamnosus R0011, or Bifidobacterium bifidum R0071. Ohtsuka et al.12 administered Bifidobacterium breve M-16V to rat pups during the newborn period and found a lower expression of various inflammation-related genes in the colon. This descriptor is based on the data of our recently published work13, whose goal was to investigate whether these bacterial strains may modulate the gene expression of the intestinal mucosa. For this purpose and with the help of DNA microarray technology, we began by studying the modulation of a great number of genes in intestinal mucosa samples from obese Zucker rats. We found changes in expression of 1,501 genes due to the obese condition. The results of the array also showed changes in the expression of 40 genes for L. paracasei CNCM I-4034; 12 genes for B. breve CNCM I-4035; 24 genes for L. rhamnosus CNCM I-4036; and 3 genes for the mixture of L. paracasei CNCM I-4034 and B. breve CNCM I-4035. Expression of three genes (Adamdec1, Ednrb and Ptgs1/Cox1) was up-regulated in the intestinal mucosa of the obese rats compared with that in the rats when they were still lean. Probiotic administration down-regulated expression of Adamdec1 and Ednrb at the mRNA and protein levels and that of Ptgs1/Cox1 at the mRNA level, and this effect was in part mediated by a decrease in both macrophage and dendritic cell populations. Probiotic treatment also increased secretory IgA content and diminished the LPS-binding protein (LBP) concentration.
Methods
These methods are expanded versions of descriptions in our related work13.
Microorganisms
The probiotic strains Lactobacillus paracasei CNCM I-4034, Bifidobacterium breve CNCM I-4035, and Lactobacillus rhamnosus CNCM I-4036 have been characterized and are described elsewhere10. These strains were deposited in the Collection Nationale de Cultures de Microorganismes (CNCM) of the Institute Pasteur10.
Ethical statement
This study was conducted in strict accordance with the recommendations in the guidelines for animal research of the University of Granada (Spain). All animals received humane care. The protocol was approved by the Committee on the Ethics of Animal Experiments of the University of Granada (Permit Number CEEA: 2011-377).
Experimental design
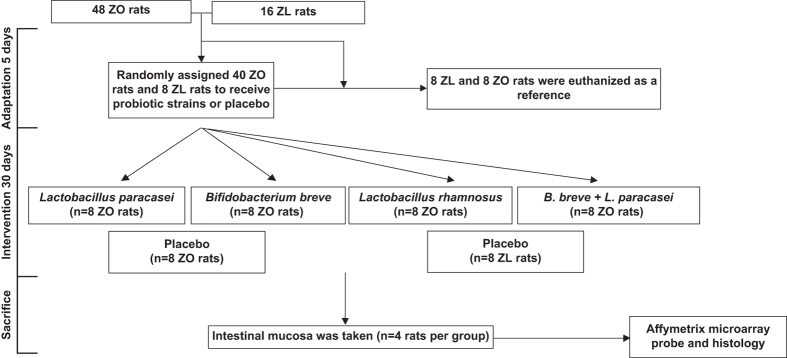
Forty-eight Zucker-Leprfa/fa and 16 Zucker lean Lepr+/fa male rats weighing 168–180 g were purchased from Harlan Laboratories (Charles River, Barcelona, Spain). The rats were housed in metabolic cages with a 12-h light-dark cycle and had free access to water and food. After 5 days of adaptation, 8 Zucker lean Lepr+/fa and 8 Zucker-Leprfa/fa rats were euthanized as a reference (baseline). The remaining 40 Zucker-Leprfa/fa rats were then randomly assigned to receive 1010 colony-forming units (CFU) of one of the three probiotic strains, a mixture of Lactobacillus paracasei CNCM I-4034 and Bifidobacterium breve CNCM I-4035, or a placebo by oral gavage administration in a 0.5 ml volume as a single dose daily for 30 days. An additional group of 8 Zucker lean Lepr+/fa rats received the placebo for 30 days (Fig. 1). The placebo contained 67% cow’s milk powder, 32.5% sucrose, and 0.56% vitamin C.
Figure 1. Workflow scheme.
The number of rats from which high quality RNA was obtained is shown for each condition tested. Abbreviations: ZL, Zucker lean Lepr+/fa rats; ZO, Zucker Leprfa/fa rats.
After the intervention, the animals were anesthetized and sedated with ketamine and xylazine. Blood was drawn from the aorta and centrifuged for 10 min at 1,000×g and 4 °C to separate the serum from the cells. Samples of intestinal mucosa were also taken.
DNA microarray
Four animals per group were used in the DNA array. We used Affymetrix Rat Gene 1.1 ST Array Plates (Affymetrix Inc., Santa Clara, CA) following the manufacturer’s directions. Briefly, RNA extraction was performed using the RNeasy Mini Kit and Qiacube system. A quantity of 300 ng total RNA was utilized in cDNA synthesis with the Ambion WT Expression kit, and the resulting cDNA was fragmented using uracil-DNA glycosylase and APE1 (apurinic/apyrimidinic endonuclease-1). The labeling process was performed using the WT Terminal Labeling Kit (Affymetrix) with deoxynucleotidyl transferase linked to biotin. After fragmentation, 5.5 μg cDNA was hybridized using the GeneChip Hybridization, Wash and Stain Kit from Affymetrix. GeneChips were scanned using the GeneTitan™. The data were analyzed with the Command Console (AGCC 3.1, Affymetrix) and the Expression Console (EE 1.1, Affymetrix). The value definition was performed using the RMA (Robust Multichip Average) signal intensity.
The intensity value of each probe in the array analysis was normalized with the Robust Multichip Average (RMA) using the Partek Genomics Suite version 6.10 (Partek) to obtain an individual intensity for each set of probes. All expression data were averaged to achieve a unique expression value for the gene, and the background was deleted. The identification of expression changes was performed using multiple regression models comparing the intensity of each gene with the interaction (Zucker lean Lepr+/fa or Zucker-Leprfa/fa rats that received placebo versus Zucker-Leprfa/fa rats that received any probiotic strain). The two-dimensional hierarchic cluster with the statistically significant sequences (n=936) appears in Fig. 2, according to the intensity and the aforementioned interactions.
Figure 2. Microarray results obtained with the Rat Gene 1.1 ST Array Plate (Affymetrix®).
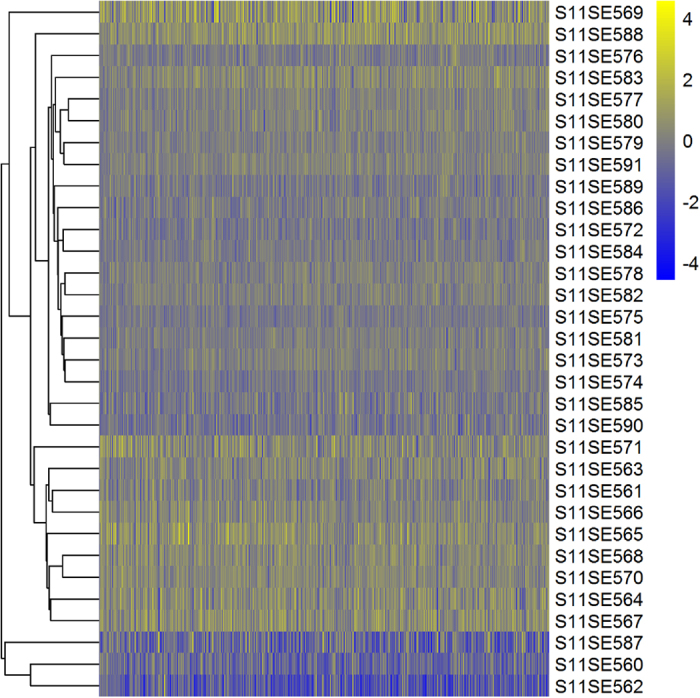
These results were uploaded to the Gene Expression Omnibus (GEO) platform as ‘GSE73848 Expression data from intestinal mucosa of Zucker rats.’ n=4 rats per group.
Data Records
The complete data set in the present study complies with the MIAME (Minimum Information About a Microarray Experiment) requirements and was uploaded into the Gene Expression Omnibus (GEO) database with the title Expression data from intestinal mucosa of Zucker rats and reference GSE73848 (Data Citation 1). Detailed information about each sample is in Table 1.
Table 1. Data description of ‘Expression data from intestinal mucosa of Zucker rats’.
| GEO-ID | organism | tissue | Sample description | analysis |
|---|---|---|---|---|
| Abbreviations: ZL, Zucker lean Lepr+/fa rats; ZO, Zucker Leprfa/fa rats. n=4 rats per group. | ||||
| GSM1904446 | Rattus norvegicus | intestinal mucosa | ZL reference | Microarray |
| GSM1904447 | Rattus norvegicus | intestinal mucosa | ZL reference | Microarray |
| GSM1904448 | Rattus norvegicus | intestinal mucosa | ZO reference | Microarray |
| GSM1904449 | Rattus norvegicus | intestinal mucosa | ZO reference | Microarray |
| GSM1904450 | Rattus norvegicus | intestinal mucosa | ZL placebo | Microarray |
| GSM1904451 | Rattus norvegicus | intestinal mucosa | ZL placebo | Microarray |
| GSM1904452 | Rattus norvegicus | intestinal mucosa | ZO placebo | Microarray |
| GSM1904453 | Rattus norvegicus | intestinal mucosa | ZO placebo | Microarray |
| GSM1904454 | Rattus norvegicus | intestinal mucosa | ZO B. breve CNCM I-4035 and L. paracasei CNCM I-4034 rat 1 | Microarray |
| GSM1904455 | Rattus norvegicus | intestinal mucosa | ZO B. breve CNCM I-4035 and L. paracasei CNCM I-4034 rat 2 | Microarray |
| GSM1904456 | Rattus norvegicus | intestinal mucosa | ZO B. breve CNCM I-4035 rat 1 | Microarray |
| GSM1904457 | Rattus norvegicus | intestinal mucosa | ZO plus B. breve CNCM I-4035 rat 2 | Microarray |
| GSM1904458 | Rattus norvegicus | intestinal mucosa | ZO plus L. paracasei CNCM I-4034 rat 1 | Microarray |
| GSM1904459 | Rattus norvegicus | intestinal mucosa | ZO plus L. paracasei CNCM I-4034 rat 2 | Microarray |
| GSM1904460 | Rattus norvegicus | intestinal mucosa | ZO plus L. rhamnosus CNCM I-4036 rat 1 | Microarray |
| GSM1904461 | Rattus norvegicus | intestinal mucosa | ZO plus L. rhamnosus CNCM I-4036 rat 2 | Microarray |
| GSM1904462 | Rattus norvegicus | intestinal mucosa | ZL reference | Microarray |
| GSM1904463 | Rattus norvegicus | intestinal mucosa | ZL reference | Microarray |
| GSM1904464 | Rattus norvegicus | intestinal mucosa | ZO reference | Microarray |
| GSM1904465 | Rattus norvegicus | intestinal mucosa | ZO reference | Microarray |
| GSM1904466 | Rattus norvegicus | intestinal mucosa | ZL placebo | Microarray |
| GSM1904467 | Rattus norvegicus | intestinal mucosa | ZL placebo | Microarray |
| GSM1904468 | Rattus norvegicus | intestinal mucosa | ZO placebo | Microarray |
| GSM1904469 | Rattus norvegicus | intestinal mucosa | ZO placebo | Microarray |
| GSM1904470 | Rattus norvegicus | intestinal mucosa | ZO B. breve CNCM I-4035 and L. paracasei CNCM I-4034 rat 3 | Microarray |
| GSM1904471 | Rattus norvegicus | intestinal mucosa | ZO plus B. breve CNCM I-4035 and L. paracasei CNCM I-4034 rat 4 | Microarray |
| GSM1904472 | Rattus norvegicus | intestinal mucosa | ZO plus B. breve CNCM I-4035 rat 3 | Microarray |
| GSM1904473 | Rattus norvegicus | intestinal mucosa | ZO plus B. breve CNCM I-4035 rat 4 | Microarray |
| GSM1904474 | Rattus norvegicus | intestinal mucosa | ZO plus L. paracasei CNCM I-4034 rat 3 | Microarray |
| GSM1904475 | Rattus norvegicus | intestinal mucosa | ZO plus L. paracasei CNCM I-4034 rat 4 | Microarray |
| GSM1904476 | Rattus norvegicus | intestinal mucosa | ZO plus L. rhamnosus CNCM I-4036 rat 3 | Microarray |
| GSM1904477 | Rattus norvegicus | intestinal mucosa | ZO plus L. rhamnosus CNCM I-4036 rat 4 | Microarray |
Technical Validation
Sample processing
Tissue samples were freeze-clamped in liquid nitrogen, and total RNA was extracted in an automatized fashion using the RNeasy Mini kit (Qiagen, Barcelona, Spain) in QIacube system (Qiagen). RNA quantity and quality were estimated in a Nanodrop and Bioanalyzer (NanoDrop Technologies, Winooski, Vermont, USA, and Agilent Genomics, Santa Clara, CA, USA, respectively).
cDNA synthesis, fragmentation and labeling
cDNA was synthesized from 300 ng of total RNA using Ambion WT Expression kit (Thermo Fisher, Carlsbad, CA, USA), following the manufacturer’s directions. The main steps of the protocol were: cDNA synthesis with random primers that included the T7 promoter; in vitro transcription; new cDNA synthesis from the cRNA obtained in the previous step including dUTP. cDNA was fragmented with Uracil DNA Glycosylase (UDG) and Apurinic/apyrimidinic endonuclease 1 (AP1), and subsequently labeled using terminal transferase and WT Terminal Labeling kit (Affymetrix, Santa Clara, CA, USA).
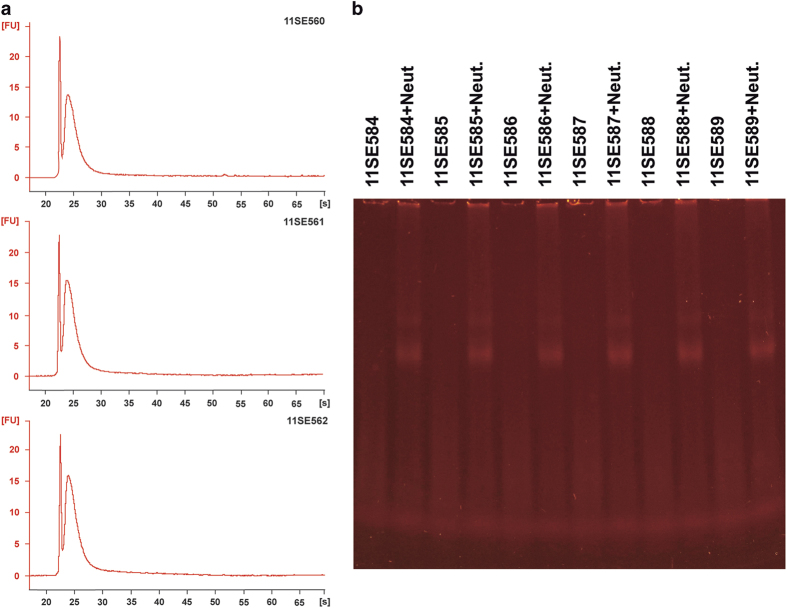
An aliquot of each sample containing 5.5 μg of cDNA was fragmented and labeled with biotin using terminal transferase. The correct fragmentation was ensured by checking an aliquot in Bioanalyzer (Fig. 3a), and the correct labeling was checked by a gel-shift assay (Fig. 3b).
Figure 3. Fragmentation of cDNAs.
(a) Bioanalyzer. (b) gel-shift assay.
Hybridization and scanning of GeneChip rat gene 1.1 ST array. Analysis of controls
Three quality controls were used: hybridization, labeling and sample controls:
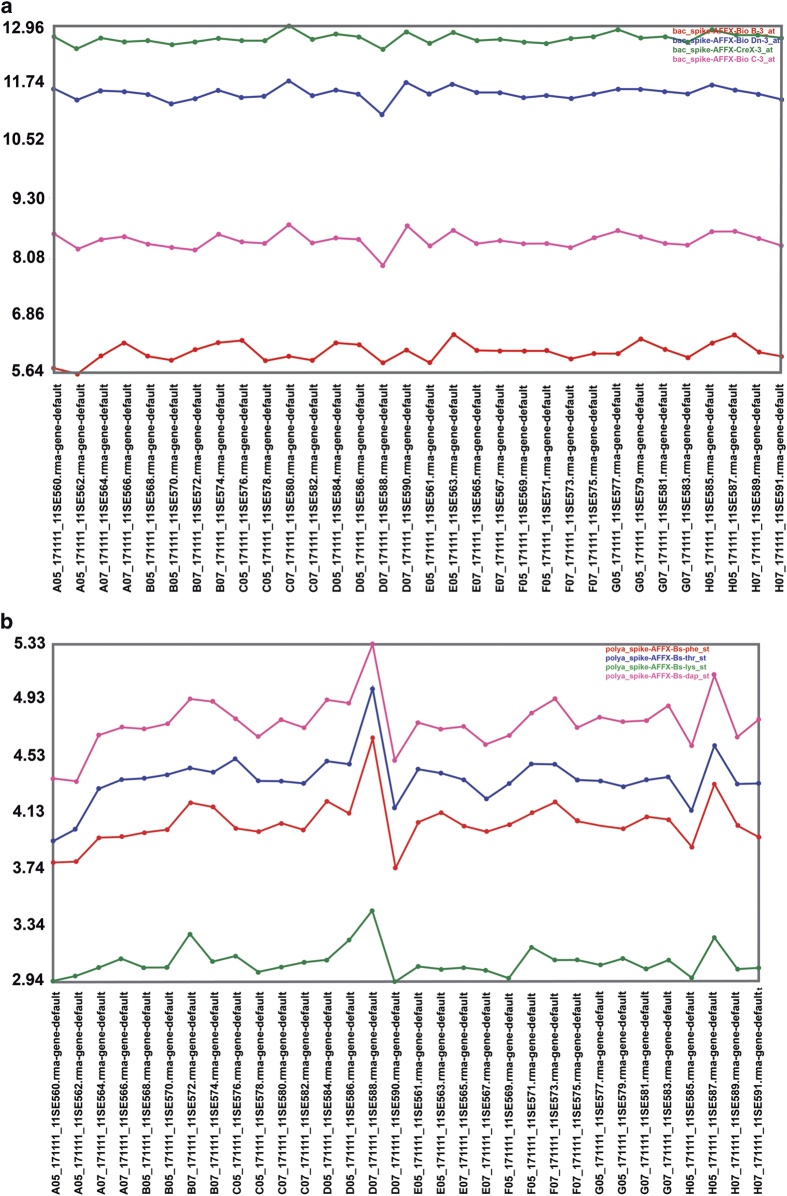
1. Hybridization (spike) controls were probes for sequences included in the hybridization mixture, and indicate that the hybridization, washing and development steps were correct. The spike controls used were BioB, BioC, BioD and Cre. Each was included in the mixture in increasing concentrations so BioB<BioC<BioD<Cre. Accordingly, the intensity of each probe must be proportional to the amount of oligo present in the mixture. The way to ensure that hybridization was correct (from the preparation of the hybridization mixture to the scanning) is to represent the intensity values of each probe in all samples, which must show increasing values, proportional to the concentration. The intensity values normalized by the spike controls in all samples appear in Fig. 4a. These values and the relationship among them were as expected. The absolute values are not as important as the general trend, that is, the lines must not cross.
Figure 4. Quality control assessment for microarrays of the RNA samples from intestinal mucosa.
(a) Hybridization controls. (b) Labeling controls with transcripts from Bacillus subtilis.
2. Labeling controls were polyA controls. These were transcripts from Bacillus subtilis added in increasing concentrations to the RNA of the sample during the processing. The intensity values of each polyA control in each sample allows to check whether cDNAcRNA synthesis was correct. As was the case for spike controls, intensity values of each probe in all samples were plotted and showed an increasing trend proportional to the concentrations. The intensity values normalized for polyA controls in each of the samples analyzed appear in Fig. 4b.
In this plot, an increase in the intensity of each polyA control is expected to occur as a function of the concentration. The absolute value is not as important as the general trend, that is, the lines must not cross one another. In our experiment the intensity values and the relationship among them were as expected.
3. Sample controls allowed the identification of outliers, that is, samples with a behavior completely different from the rest. The parameters analyzed in this study were:
- Pos_vs_neg_auc: it is a measure of the detection of the positive controls versus the false detection of the negative controls. It is a robust measure of the global quality of the data. Typical values range 0.8–0.9, being 1.0 the perfect value. In contrast, 0.5 indicates a lack of difference between positive and negative controls. Values <0.8 indicate that the sample may be an outlier. All of our samples were acceptable as shown in Table 2.
Table 2. Array outliers.
| Sample | pos_vs_neg_auc | all_probeset_mean | all_probeset_rle_mean | Sample | pos_vs_neg_auc | all_probeset_mean | all_probeset_rle_mean |
|---|---|---|---|---|---|---|---|
| Array outliers. Pos_vs_neg_auc is a measure of the detection of the positive controls versus false detection of the negative controls. It is a robust measure of the global quality of the data. Typical values range 0.8–0.9, being 1.0 the perfect value. In contrast, 0.5 indicates a lack of difference between positive and negative controls. Values <0.8 indicate that the sample may be an outlier. All Probe set Mean is a measure of the average signal of all probe sets included in the analysis. It allows the identification of arrays too bright or too dark. All Probe Set RLE Mean: the signal from each probe set is compared with the average signal of that probe set in the study. This parameter is the average of those differences for all the probe sets. Generally, high values indicate that the signals in an array are very different from the rest of the signals of the study. In this kind of array, values usually range 0.27–0.61 for studies that include samples from various tissues, and 0.1–0.23 for technical replicates. Abbreviations: RLE, relative log expression. | |||||||
| 11SE560 | 0.85422 | 5.541424 | 0.241511 | 11SE576 | 0.864426 | 5.589662 | 0.15491 |
| 11SE561 | 0.878029 | 5.57988 | 0.171301 | 11SE577 | 0.871134 | 5.576477 | 0.129484 |
| 11SE562 | 0.865219 | 5.507742 | 0.248986 | 11SE578 | 0.88545 | 5.576419 | 0.128479 |
| 11SE563 | 0.864947 | 5.589251 | 0.175722 | 11SE579 | 0.866908 | 5.576636 | 0.127985 |
| 11SE564 | 0.864352 | 5.5837 | 0.173877 | 11SE580 | 0.857355 | 5.586262 | 0.153071 |
| 11SE565 | 0.877761 | 5.56282 | 0.161048 | 11SE581 | 0.867117 | 5.574453 | 0.131372 |
| 11SE566 | 0.871477 | 5.586922 | 0.175144 | 11SE582 | 0.88222 | 5.572265 | 0.130127 |
| 11SE567 | 0.877053 | 5.580364 | 0.167735 | 11SE583 | 0.874066 | 5.581122 | 0.141788 |
| 11SE568 | 0.860977 | 5.579972 | 0.140385 | 11SE584 | 0.880905 | 5.571299 | 0.122088 |
| 11SE569 | 0.880092 | 5.582358 | 0.217311 | 11SE585 | 0.846603 | 5.579253 | 0.170314 |
| 11SE570 | 0.882 | 5.574604 | 0.148582 | 11SE586 | 0.876601 | 5.576181 | 0.131724 |
| 11SE571 | 0.888591 | 5.56232 | 0.194358 | 11SE587 | 0.872058 | 5.566449 | 0.226278 |
| 11SE572 | 0.876405 | 5.570266 | 0.133905 | 11SE588 | 0.904137 | 5.559667 | 0.184642 |
| 11SE573 | 0.879322 | 5.56958 | 0.12135 | 11SE589 | 0.873042 | 5.570007 | 0.150338 |
| 11SE574 | 0.875899 | 5.572968 | 0.116654 | 11SE590 | 0.842198 | 5.593665 | 0.170785 |
| 11SE575 | 0.863548 | 5.58026 | 0.129136 | 11SE591 | 0.879472 | 5.567289 | 0.125395 |
- All Probe set Mean: it is a measure of the average signal of all probe sets included in the analysis. It allows the identification of arrays too bright or too dark. As shown in Table 2, none of the samples was an outlier.
- All Probe Set RLE Mean: the signal from each probe set is compared with the average signal of that probe set in the study. This parameter is the average of those differences for all the probe sets. Generally, high values indicate that the signals in an array are very different from the rest of the signals of the study. In this kind of array, values usually range 0.27–0.61 for studies that include samples from various tissues, and 0.1–0.23 for technical replicates. Our values were consistent (Table 2).
Bioinformatic analysis
Gene expression results obtained from 32 RNA samples were analyzed. The chip used was RatGene1.1ST array plate (Affymetrix, Santa Clara, CA, USA). The goal of the analysis was to obtain sequences differentially expressed under our experimental conditions. The bioinformatic analysis contained the following steps:
a) Quality control of the arrays.
b) Pre-processing of data by the RMA method.
c) Normalization of arrays to obtain the worklist.
All these steps are described in more detail below.
Analysis of outliers
The quality of the arrays was ensured with the following controls:
Array Outlier: indicates the percentage of transcripts whose levels in the array are inconsistent with the levels in the rest of arrays of the experiment. The software used, dChip14, recommends to take with precaution those samples that reach a value >5%, and eliminate those that reach a value >15%. According to these criteria, sample 11SE562 must be handled with precaution and its behavior will be carefully studied in the following steps (Table 3).
Table 3. Array quality control percentage.
| Sample | % Array outlier | Sample | % Array outlier |
|---|---|---|---|
| Percentage of transcripts whose levels in the array are inconsistent with the levels in the rest of arrays of the experiment. | |||
| 11SE560 | 3.305 | 11SE576 | 0.23 |
| 11SE561 | 0.271 | 11SE577 | 0.254 |
| 11SE562 | 6.853 | 11SE578 | 0.274 |
| 11SE563 | 0.192 | 11SE579 | 0.237 |
| 11SE564 | 0.394 | 11SE580 | 0.405 |
| 11SE565 | 0.329 | 11SE581 | 0.281 |
| 11SE566 | 0.291 | 11SE582 | 0.254 |
| 11SE567 | 0.339 | 11SE583 | 0.298 |
| 11SE568 | 0.312 | 11SE584 | 0.35 |
| 11SE569 | 0.668 | 11SE585 | 0.422 |
| 11SE570 | 0.312 | 11SE586 | 0.35 |
| 11SE571 | 0.35 | 11SE587 | 0.405 |
| 11SE572 | 0.302 | 11SE588 | 0.566 |
| 11SE573 | 0.298 | 11SE589 | 0.291 |
| 11SE574 | 0.288 | 11SE590 | 0.247 |
| 11SE575 | 0.247 | 11SE591 | 0.226 |
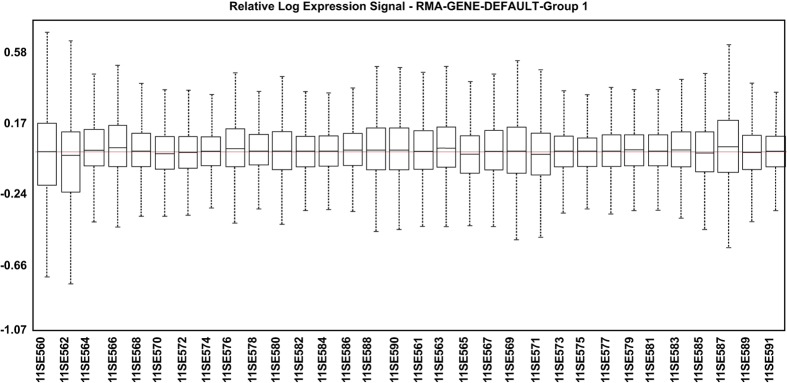
Relative Log Expression (RLE): Expression Console software (Affymetrix) was used to obtain RLE values in which the expression value of each probe set of each sample was normalized by a reference array. This reference array is made from the median of all the arrays for each probe set. It is assumed that most of the expression values do not change with respect to the median and, accordingly, are around 0. All samples exhibited correct RLE values (Fig. 5).
Figure 5. Relative log expression signal graph.
This reference array is made from the median of all the arrays for each probe set. It is assumed that most of the expression values do not change with respect to the median and, accordingly, are around 0.
Pre-processing of data
The intensity values of each probe were processed and normalized by the Robust Multichip Average (RMA) method to obtain an individual intensity value for each set of probes. Subsequently, all expression values of each exon were averaged to obtain unique expression values per gene to get a list of 29,214 probe sets.
First filtering of data
Data from GeneChips were filtered to discard those sequences with hybridization signals close to background. The number of sequences that passed the filtering was 10,015.
Normalization of data
The array data saved in the *.cel files were subjected to a normalization step by quantiles using the Partek Genomics Suite software (v6.10).
Second filtering of data
Finally, the 10,015 sequences were filtered to discard those probes that did not show any changes in expression in all samples, based on the standard deviation of the normalized intensity data. The value used as a limit of expression change among conditions allows the elimination of those sequences that do not vary in the comparison among any sample and therefore are not informative. This filter narrowed the sequences down to 6,990.
Additional information
How to cite this article: Plaza-Díaz, J. et al. Gene expression profiling in the intestinal mucosa of obese rats administered probiotic bacteria. Sci. Data 4:170186 doi: 10.1038/sdata.2017.186 (2017).
Publisher’s note: Springer Nature remains neutral with regard to jurisdictional claims in published maps and institutional affiliations.
Supplementary Material
Acknowledgments
This paper will be part of Candido Robles-Sanchez’s doctorate, which is being completed as part of the ‘Biochemistry and Molecular Biology Program’ at the University of Granada, Spain. This work was funded by the company Hero Spain, S. A. (grant #3545 managed by Fundación General Empresa-Universidad de Granada) and by CEIBiotic, University of Granada, Spain (grant CEI2013P-11).
Footnotes
The authors declare no competing financial interests.
Data Citations
- 2016. Gene Expression Omnibus. GSE73848
References
- Reaven G. M. Role of insulin resistance in human disease. Diabetes 37, 1595–1607 (1988). [DOI] [PubMed] [Google Scholar]
- Reaven G. M. The metabolic syndrome or the insulin resistance syndrome? Different names, different concepts, and different goals. Endocrinol. Metab. Clin. North Am. 33, 283–303 (2004). [DOI] [PubMed] [Google Scholar]
- Lakka H. M. et al. The metabolic syndrome and total and cardiovascular disease mortality in middle-aged men. JAMA 288, 2709–2716 (2002). [DOI] [PubMed] [Google Scholar]
- Kahn R. et al. The metabolic syndrome: time for a critical appraisal: joint statement from the American Diabetes Association and the European Association for the Study of Diabetes. Diabetes Care 28, 2289–2304 (2005). [DOI] [PubMed] [Google Scholar]
- Plaza-Díaz J. et al. Effects of Lactobacillus paracasei CNCM I-4034, Bifidobacterium breve CNCM I-4035 and Lactobacillus rhamnosus CNCM I-4036 on hepatic steatosis in Zucker Rats. PLoS ONE 9, e98401 (2014). [DOI] [PMC free article] [PubMed] [Google Scholar]
- Guarner F. & Schaafsma G. J. Probiotics. Int. J. Food Microbiol. 39, 237–238 (1998). [DOI] [PubMed] [Google Scholar]
- Fontana L., Bermudez-Brito M., Plaza-Diaz J., Muñoz-Quezada S. & Gil A. Sources, isolation, characterisation and evaluation of probiotics. Br. J. Nutr. 109, S35–S50 (2013). [DOI] [PubMed] [Google Scholar]
- Bermúdez-Brito M., Plaza-Díaz J., Muñoz-Quezada S., Gómez-Llorente C. & Gil A. Probiotic mechanism of action. Ann. Nutr. Metab. 61, 160–174 (2012). [DOI] [PubMed] [Google Scholar]
- Plaza-Díaz J. et al. Safety and immunomodulatory effects of three probiotic strains isolated from the feces of breast-fed infants in healthy adults: SETOPROB study. PLoS ONE 8, e78111 (2013). [DOI] [PMC free article] [PubMed] [Google Scholar]
- Muñoz-Quezada S. et al. Isolation, identification and characterisation of three novel probiotic strains (Lactobacillus paracasei CNCM I-4034, Bifidobacterium breve CNCM I-4035 and Lactobacillus rhamnosus CNCM I-4036) from the faeces of exclusively breast-fed infants. Br. J. Nutr. 109, S51–S62 (2013). [DOI] [PubMed] [Google Scholar]
- Dykstra N. et al. Pulse probiotic administration induces repeated small intestinal Muc3 expression in rats. Pediatr. Res. 69, 206–211 (2011). [DOI] [PubMed] [Google Scholar]
- Ohtsuka Y. et al. Effects of Bifidobacterium breve on inflammatory gene expression in neonatal and weaning rat intestine. Pediatr. Res. 71, 46–53 (2012). [DOI] [PubMed] [Google Scholar]
- Plaza-Díaz J. et al. Adamdec1, Ednrb and Ptgs1/Cox1, inflammation genes upregulated in the intestinal mucosa of obese rats, are downregulated by three probiotic strains. Sci. Rep. 7, 1939 (2017). [DOI] [PMC free article] [PubMed] [Google Scholar]
- Li C. & Wong W. H. Model-based analysis of oligonucleotide arrays: expression index computation and outlier detection. Proc. Natl. Acad. Sci. USA 98, 31–36 (2001). [DOI] [PMC free article] [PubMed] [Google Scholar]
Associated Data
This section collects any data citations, data availability statements, or supplementary materials included in this article.
Data Citations
- 2016. Gene Expression Omnibus. GSE73848


