

Abstract
We sought to determine whether ambient air pollution is associated with interstitial lung abnormalities (ILA) and high attenuation areas (HAA), which are qualitative and quantitative measurements of subclinical ILD on computed tomography.
We performed analyses of 6813 community-based dwellers enrolled in the Multi-Ethnic Study of Atherosclerosis (MESA), a U.S.-based prospective cohort study. We used cohort-specific spatiotemporal models to estimate predictions of ambient pollution (PM2.5, NOx, NO2 and O3) at each home. Participants underwent serial assessment of HAA by cardiac CT-scan and a subset of participants was assessed for ILA using full lung CT scan at 10 year follow-up. We used multivariable logistic regression and linear mixed models adjusted for age, sex, ethnicity, education, tobacco use, scanner technology and study site.
The odds of ILA increased 1.62-fold per 40ppb increment in NOx (95%CI 0.97 to 2.71, p-value 0.06), and were strongest in non-smokers (2.60-fold increase per 40ppb increment in NOx, 95% CI 1.20 to 5.61, p-value 0.02). HAA increased by 0.54% per year per 5μg/m3 increment in PM2.5 (95%CI 0.02% to 1.10%, p-value 0.04) and by 0.55% per year per 40ppb increment in NOx (95%CI 0.08% to 1.00%, p-value 0.02).
Ambient air pollutants were associated with measurements of subclinical ILD.
Keywords: epidemiology, air pollution, interstitial lung disease, subclinical
Introduction
Air pollution is a risk factor for adverse respiratory outcomes. Many studies have shown associations between pollution exposure and the incidence and/or progression of multiple pulmonary diseases, including asthma,1 COPD,2 bronchiectasis,3 respiratory infections,4 chronic lung allograft dysfunction5 and lung cancer.6 There has been little research on whether air pollution may contribute to the etiology or accelerate the progression of interstitial lung diseases (ILDs), a heterogeneous group of chronic lung diseases characterized by inflammation and fibrosis of the pulmonary parenchyma that affect nearly 1 out of 200 older adults in the U.S.7
ILD is often diagnosed after the onset of irreversible parenchymal fibrosis. Early symptoms are nonspecific and frequently attributed to other chronic pulmonary or cardiac diseases. Due to the late presentation of clinical manifestations and the presumed long latency between exposure and disease development, the underlying etiologies of many of the ILDs are unknown.
The growing recognition and identification of subclinical forms of ILD on CT scan provides a unique opportunity to investigate antecedent causes, rather than consequences, of ILD. Interstitial lung abnormalities (ILA), a visual assessment of early interstitial changes in nondependent portions of the lung, is a well validated qualitative measurement of subclinical ILD.8 A quantitative CT attenuation-based phenotype of subclinical ILD, termed high attenuation areas (HAA), has also been shown to be a marker of subclinical lung inflammation and fibrosis.9–11 Longitudinal studies estimate that 20% to 46% of participants with ILA have progressive imaging abnormalities, with approximately 4% developing features of usual interstitial pneumonia (UIP).12 Even in the absence of clinical ILD, populations with subclinical ILD have more respiratory symptoms, physiologic decrements and higher mortality.10,13,14 Inhalational exposures underlie the pathobiology of asbestosis, hypersensitivity pneumonitis and smoking-related ILDs. Ambient air pollutants may initiate or contribute to the cycle of alveolar injury, disordered repair and fibrosis seen in the ILDs, and have been associated with clinical exacerbations in interstitial fibrosis patients.15 Air pollutants, including fine and ultrafine particles and traffic-related gases, can deposit throughout the airways and alveoli, causing either direct damage or triggering inflammation and oxidative stress. This could potentially result in alveolar cell injury or senescence, endothelial dysfunction, mononuclear cell interstitial inflammation and fibroblast proliferation.
The association between air pollutants and ILD has not been previously investigated in a population-based study. We hypothesized that exposure to air pollution would be associated with qualitative and quantitative measurements of subclinical ILD in community-dwelling adults.
METHODS
Study design and participants
The Multi-Ethnic Atherosclerosis Study (MESA) is a prospective cohort study funded by the National Heart Lung and Blood Institute to investigate subclinical cardiovascular disease. MESA and ancillary studies, MESA Lung and Air, are described in depth elsewhere and served as the sampling frame for this study.10,16 Informed consent was obtained for all participants and the study was approved by the Institutional Review Board at collaborating centers.
Briefly, MESA enrolled 6,814 participants, ages 45–84 from six centers around the US: Baltimore, MD; Chicago, IL; Los Angeles County, CA; New York City, NY; St Paul, MN; and Winston Salem, NC. By study design, all participants were free of known cardiovascular disease at the start of the study; there were no selection criteria based on lung disease, respiratory symptoms or smoking history. Participants were recruited between 2000 through 2002, and underwent questionnaires regarding demographics, family history, medical history and lifestyle habits. At enrollment and during the four subsequent exams, participants had noninvasive assessment of cardiovascular status including cardiac CT scans - which image approximately 70% of the lung volume from main carina to lung. By design, all returning participants had a repeat cardiac CT scan at either exam 2 or 3, and 30% of the cohort had a third cardiac CT scan at exam 4. An additional subset of 3,137 participants underwent full lung or cardiac CT scan at exam 5.
The sampling scheme of participants that were included in our study is described in detail in the Supplementary Appendix.
Interstitial Lung Abnormalities
Full lung MESA CT scans were acquired in years 2010–12 (10-year follow-up) at suspended full inspiration using the MESA Lung/SPIROMICS protocol and images were reconstructed using 0.625 mm slice thickness.17 One of five board-certified radiologists (inter-reader kappa 0.47 (0.14–0.80)) reviewed the full lung CT scans for ILA, which was defined as any scan read as “definite” ILD or “suspicious” for ILA. “Definite” ILD was defined as bilateral fibrosis in multiple lobes associated with honeycombing and traction bronchiectasis in a subpleural distribution. Scans were read as “suspicious” for ILA in the presence of ground-glass, reticular abnormality, diffuse centrilobular nodularity, honeycombing, traction bronchiectasis, non-emphysematous cysts or architectural distortion in at least 5% of nondependent portions of the lung.18 Scans with solitary abnormalities that appeared in less than 5% of the lungs were read as “equivocal” for ILA and were excluded from the main analysis, as previously has been described.10 In a sensitivity analysis, these “equivocal” scans were included in the group of participants without ILA.
High Attenuation Areas
HAA was measured on non-contrast cardiac CT scans performed at the MESA baseline visit and selected follow up exams using highly standardized protocols.19 A prior validation study using MESA full lung scans showed that cardiac CT scans image approximately 65–70% of the total lung volume, capturing most of the lower lobes and excluding much of the lung apexes. Quantitative image attenuation was measured by trained readers using a modified version of the Pulmonary Analysis Software at the University of Iowa Imaging Lab (Iowa City, IA, USA) (intra-class correlation 0.93).9 HAA was defined as the percent of the imaged lung volume having attenuation values between −600 and −250 Hounsfield Units (HU).9,10 This range of CT lung attenuation includes ground-glass and reticular abnormalities, and excludes denser areas such as atelectasis, medium and large blood vessels and pulmonary nodules. Percent emphysema was defined as the percentage of voxels below −950 HU.
Exposure assessment
Ambient air pollution exposure was estimated for each participant using residential history data (reported from 1980–2012) and spatio-temporal prediction models based on land use regression and geostatistical smoothing. These validated models are described in detail elsewhere.20,21
In brief, pollutants were measured at 27 long-term sites, 771 community snapshots and outside 697 participant homes between 2005–2009. Using these measurements to supplement pollution monitoring from the monitoring locations in the EPA Air Quality System, MESA Air developed community-specific spatio-temporal models incorporating geographic information and spatial smoothing. These models predict pollutant concentrations at residences for each two-week period between 1999–2012 and explain 90–97% of the variation in measurements at participant homes.
Given the expectation of a prolonged period of exposure contributing to the development of ILA, we estimated long-term ambient pollution exposure using ten-year averages of two-week, residence-specific predictions prior to full lung CT scan. As a sensitivity analysis, we estimated twenty and thirty year exposure to PM2.5 prior to full lung CT scan based on historic models of annual average exposure developed for periods pre-dating intensive PM monitoring.22 These long-term residential estimates used address-weighted averages of annual PM2.5 concentration.
To model the progression of HAA, we estimated long-term exposures as the average of two-week residence-specific predictions from recruitment to follow-up. Year 2000 concentrations at participant’s address at recruitment were used to model the baseline cross-sectional relationship.
Statistical Analyses
All statistical tests were performed in SAS version 9.3 (SAS Institute) using a two-tailed α= 0.05 to define statistical significance.
We used multivariable logistic regression to examine the associations between predicted 10-year pollutant exposures and the odds of ILA on full lung CT scan at exam 5. Models were adjusted for age, gender, ethnicity, tobacco use (current smoking status and pack years) and site. In the main analysis, participants with “equivocal” ILA were excluded from the analysis and in a sensitivity analysis these participants were included in the group of participants without ILA. Sensitivity sub-analysis was performed with additionally adjustment for occupational exposures, a well-established risk factor for ILD. Occupational exposure was defined according to a previously developed and applied job exposure matrix (JEM) quantifying exposure to vapors, gas, dusts and fumes, but was not available for all participants.23 Sensitivity analyses were performed using longer exposure periods by averaging 20 and 30-year estimates of PM2.5 derived from historic models pollution estimates when available. Other studies have shown differential effects on subclinical ILD based on smoking status, ethnicity and gender, so a priori, we decided to test for effect modification by these variables.9,11 Where stratified models showed different magnitudes of associations, we additionally tested for effect modification with a multiplicative interaction between pollutants exposure and potential effect modifier. We used the likelihood ratio test between the nested main effect and multiplicative models to test for statistical significance.
Linear mixed models were used to analyze the cross-sectional associations between air pollution and HAA at baseline examination and between air pollution and the rate of progression of HAA. HAA was log transformed in the model, and back transformed to obtain estimates of percent change. Repeated measurements were modeled as a function of study time, with time-varying exposures modeled as an interaction with time to examine associations between pollutant exposure and the linear rate of change of HAA over time. Participant-specific random intercepts and slopes were included. Models were adjusted for age, gender, race/ethnicity, educational attainment, JEM, height, BMI, waist circumference, smoking status, cigarette pack-years, glomerular filtration rate, total volume of image lung, percent emphysema on CT scan, CT scanner type and study site. Potential effect modification was examined by stratification on smoking status, gender and ethnicity.
RESULTS
3137 MESA participants, including some of the participants recruited under MESA Air, had a full lung CT scan that was assessed by a radiologist. 128 were not read for ILA and 34 had unreadable scans. As previously done, we further excluded 491 full lung CT scans that were read as “indeterminate” for ILA.10 171 participants were missing ten year-pollutant estimates and 48 were missing other covariates, leaving 2265 participants with full lung CT scans in our final analysis of ILA (see appendix, figure S1). 6813 MESA participants had a baseline cardiac CT scan with valid HAA measurements. Of these, 5965 participants had at least one follow up cardiac CT scan during the study. 460 of these participants were missing either covariate information or pollutant estimates, leaving 5508 participants that were included in the longitudinal analysis of HAA progression (see appendix, figure S2). The mean number of cardiac CT scans per participant was 2.4. The mean follow-up time among the participants with at least 2 cardiac CT scans was 5.9 years, with a range of 0.9 to 11.4 years.
Baseline characteristics and air pollution estimates were similar in the cohorts included in the ILA and HAA analyses (Table 1). The mean age of the full cohort at baseline was 62 years (SD 10) and 3214 (47%) were male. Racial/ethnic differences were based on study design: 2621 (39%) participants were white, 1893 (28%) were African American, 1496 (22%) were Hispanic and 803 (11%) were Chinese American. 3085 (45%) participants had never smoked and 967 (14%) were current smokers.
TABLE 1.
Baseline Characteristics of Participants Included in Analyses of Subclinical ILD
| HAA Measured at Exam 1+ | HAA Cohort | ILA Cohort++ | |
|---|---|---|---|
| Participants (no) | 6813 | 5508 | 2265 |
| Age (years) | 62.2 (10.2) | 61.6 (10.1) | 59.8 (9.4) |
| Male | 3214 (47.2) | 2674 (48.6) | 1059 (46.8) |
| Race | |||
| White | 2621 (38.5) | 2237 (40.6) | 904 (39.9) |
| African-American | 1893 (27.8) | 1516 (27.5) | 597 (26.4) |
| Hispanic | 1496 (22) | 1142 (20.7) | 455 (20.1) |
| Asian (Chinese) | 803 (11.8) | 613 (11.1) | 309 (13.6) |
| BMI, kg/m2 | 28.3 (5.5) | 28.4 (5.4) | 28.2 (5.3) |
| Height, cm | 166.4 (10) | 166.9 (10) | 166.9 (10) |
| Weight, lbs | 173.4 (38.2) | 174.5 (38.0) | 173.7 (37.8) |
| Smoking status | |||
| Never smokers | 3085 (45) | 2469 (44.8) | 1130 (49.9) |
| Former smokers | 2761 (41) | 2268 (41.2) | 840 (37.1) |
| Current smokers | 967 (14) | 771 (14.0) | 294 (13.0) |
| Cigarette pack-years* | 13 (2.0–31.5) | 13.5 (2.4–31.0) | 12.7 (2–30) |
| Socioeconomic status | |||
| Education+ | |||
| ≤ high school | 2460 (36.2) | 1802 (32.7) | 681 (30.7) |
| Some college | 1937 (28.5) | 1618 (29.4) | 637 (28.8) |
| ≥ college | 2393 (35.2) | 2088 (37.9) | 897 (40.5) |
| Income++ | |||
| < 25000 | 2059 (31.5) | 1481 (27.7) | 533 (24.2) |
| 25000–74,999 | 3003 (45.9) | 2554 (47.8) | 1084 (49.2) |
| ≥ 75000 | 1478 (22.6) | 1309 (24.5) | 585 (26.6) |
| Occupational exposure** | |||
| Low | 4913 (76.2) | 4250 (77.2) | 1681 (78.2) |
| Intermediate | 1055 (16.4) | 863 (15.7) | 321 (14.9) |
| High | 481 (7.5) | 395 (7.2) | 148 (6.9) |
| Percent emphysema | 4.2 (4.5) | 4.2 (4.4) | 4.0 (4.0) |
| Study Site | |||
| Winston Salem, NC | 1077 (15.8) | 895 (16.3) | 414 (18.3) |
| New York, NY | 1102 (16.2) | 946 (17.2) | 439 (19.4) |
| Baltimore, MD | 1086 (15.9) | 856 (15.5) | 295 (13) |
| St. Paul, MN | 1066 (15.7) | 881 (16.0) | 310 (13.7) |
| Chicago, IL | 1164 (17.1) | 987 (17.9) | 450 (19.9) |
| Los Angeles, CA | 1318 (19.4) | 943 (17.1) | 357 (15.8) |
| Pollutants+++ | |||
| PM2.5 | 16.8 (2.8) | 16.7 (2.8) | 16.5 (2.8) |
| NOx | 50.7 (27.7) | 50.1 (27.5) | 48.7 (26.9) |
| NO2 | 21.5 (9.1) | 21.3 (9.2) | 20.9 (9.1) |
| O3 | 20.2 (4.9) | 20.3 (4.9) | 20.5 (5.1) |
Data presented as mean ± SD, n (%) unless otherwise stated. All parameters collected at MESA baseline visit in years 2000–2002, unless otherwise stated. ILA = interstitial lung abnormalities; HAA = high attenuation areas; BMI = body mass index
median (interquartile range) among ever smokers
exposure to vapors, gas, dust and fumes derived from job exposure matrix; missing in 364 participants with HAA measured at Exam 1, 115 participants in ILA cohort
excludes 1 participant without baseline HAA measurement
includes demographics from 53 MESA Air new recruits at time of recruitment, with exception of age, which is backdated to year 2000
education missing in 23 participants with HAA measured at Exam 1, 50 participants from ILA cohort
income missing in 273 participants with HAA measured at Exam 1, 164 from HAA cohort, 63 in ILA cohort
year 2000 estimates, ppb
Average air pollution concentration decreased over the study time, as described in detail elsewhere (16). Mean pollution concentration also varied by site, with the highest levels of PM2.5 in Los Angeles and the highest levels of nitrates (NOx and NO2) in New York City. Pollutant levels were positively correlated with the exception of O3, which was negatively correlated with the other pollutants (see appendix Tables S1 and S2).
Associations of pollutants with Interstitial Lung Abnormalities
310 (9.9%) of the 3137 participants who underwent full lung CT scan had ILA: 289 (9.2%) had scans read as suspicious for ILD and 21 (0.67%) had scans that met standard criteria for a UIP pattern with bilateral fibrosis associated with honeycombing and traction bronchiectasis in a subpleural distribution. In multivariable-adjusted analyses, there were no significant associations between pollutant exposure and ILA in the overall analyses (Table 2; Figure 1). The odds of ILA increased 1.62-fold per 40ppb increment in NOx (95%CI 0.97 to 2.71, p-value 0.06). In the a priori specified group of non-smokers, greater exposure to NOx and NO2, and lesser exposure to O3 were each associated with an increased odds of ILA. Each 40 ppb increment in in NOx was associated with a 2.6-fold greater odds of ILA (95% CI 1.20 to 5.61, p-value 0.02; p-value = 0.21 for interaction with smoking, appendix Table S4), while each 10 ppb increment in O3 was associated with an odds ratio for ILA of 0.33 (95% CI 0.10 to 1.05, p-value 0.06; p-value = 0.27 for interaction with smoking, appendix Table S5).
TABLE 2.
10 Year Estimates of Pollution Exposure and Risk of Interstitial Lung Abnormalities
| OR per 5 mcg/m3 increment in PM2.5 (95% CI) | p | OR per 40 ppb increment in NOx (95%CI) | p | OR per 10 ppb increment in NO2 (95% CI) | p | OR per 10 ppb increment in O3 (95% CI) | p | |
|---|---|---|---|---|---|---|---|---|
| Overall | 1.34 (0.75 to 2.38) | 0.32 | 1.62 (0.97 to 2.71) | 0.06 | 1.23 (0.87 to 1.76) | 0.24 | 0.96 (0.89 to 1.03) | 0.25 |
| Sex | ||||||||
| Female | 1.08 (0.50 to 2.32) | 0.85 | 1.67 (0.75 to 3.76) | 0.21 | 1.21 (0.76 to 1.93) | 0.42 | 0.66 (0.25 to 1.75) | 0.41 |
| Male | 1.79 (0.75 to 4.27) | 0.19 | 1.52 (0.62 to 3.7) | 0.36 | 1.27 (0.74 to 2.20) | 0.39 | 0.61 (0.20 to 1.85) | 0.38 |
| Race | ||||||||
| White | 1.24 (0·54 to 2.83) | 0.61 | 1.64 (0.68 to 3.95) | 0.27 | 1.22 (0.75 to 2.00) | 0.42 | 0.60 (0.21 to 1.69) | 0.33 |
| Asian | 5.16 (0.65 to 40.9) | 0.12 | 2.76 (0.62 to 12.3) | 0.18 | 1.69 (0.66 to 4.37) | 0.28 | 1.47 (0.13 to 16.4) | 0.75 |
| Black | 0.86 (0.24 to 3.06) | 0.82 | 0.98 (0.37 to 2.59) | 0.97 | 0.73 (0.36 to 1.47) | 0.38 | 0.81 (0.20 to 3.28) | 0.76 |
| Hispanic | 1.17 (0.27 to 5.02) | 0.83 | 2.03 (0.60 to 6.91) | 0.26 | 1.74 (0.68 to 4.48) | 0.25 | 0.25 (0.03 to 2.29) | 0.22 |
| Tobacco Use | ||||||||
| Never-smoker | 1.64 (0.66 to 4.03) | 0.28 | 2.60 (1.20 to 5.61) | 0.02 | 1.78 (0.98 to 3.26) | 0.06 | 0.33 (0.10 to 1.05) | 0.06 |
| Ever-smoker | 0.89 (0.34 to 2.35) | 0.82 | 0.94 (0.40 to 2.19) | 0.88 | 0.75 (0.42 to 1.34) | 0.33 | 1.20 (0.41 to 3.54) | 0.74 |
Cross sectional association of fine particulate matter (PM2.5), nitrogen oxides (NOx), nitrogen dioxide (NO2) and ozone (O3) with the odds of interstitial lung abnormalities (ILA), from multivariable logistic regression models adjusted for age, gender, ethnicity, tobacco use (current smoking status and pack years), and study site
Figure 1.
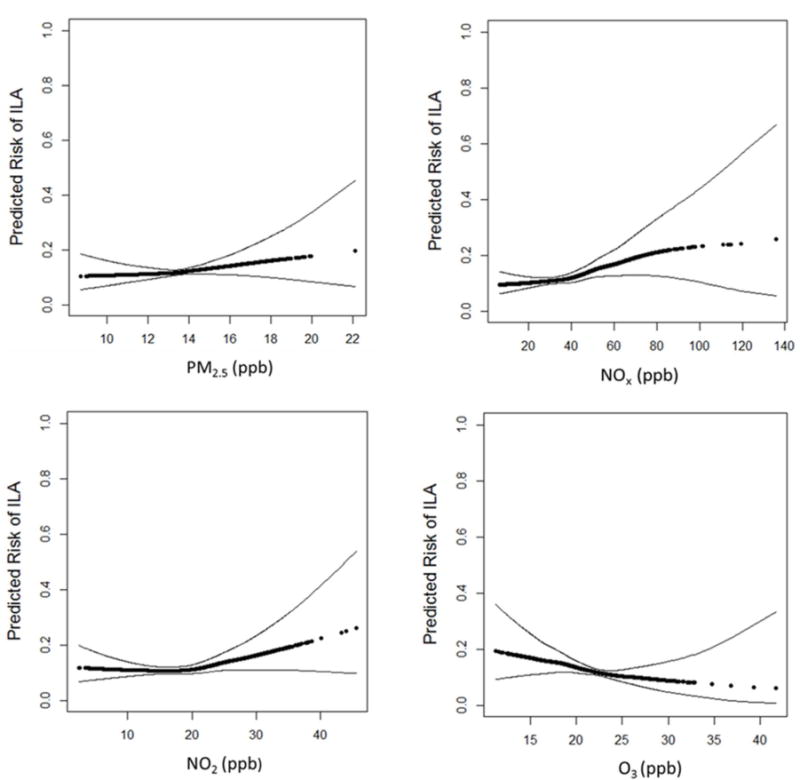
Predicted risk of Interstitial Lung Abnormalities with increasing levels of pollutants: PM2.5, NOx, NO2, O3. Effect estimates are derived from general additive models, with black points demonstrating the overall effect estimates and thin dashed lines representing the 95% confidence bands. All models adjusted for age, sex, race/ethnicity, tobacco use (pack years, smoking status) and study site.
In the sensitivity analysis which included participants with a CT scan initially read as “equivocal” in the control group of participants without ILA, associations between pollutants and ILA were more robust (see appendix Table S5). For example, in this sensitivity analysis, the odds of ILA increased to 1.77-fold per 40ppb increment in NOx (95%CI 1.06 to 2.95, p-value 0.03). Additional adjustment for occupational exposures led to similar findings (see appendix Table S6). Effect estimates were strongest among non-Hispanic whites, where there was a 3.13-fold increase in odds of ILA (95%CI 1.00 to 9.86, p-value 0.05; p-value = 0.9 for interaction between NOx and non-Hispanic white) per 40ppb increase in NOx exposure. Sensitivity analyses with 20 and 30-year pollutant estimates using a historic model for PM2.5 yielded comparable qualitative results (see appendix Table S7).
Association with High Attenuation Areas
At recruitment, MESA participants had a mean HAA of 5.1% (3.1% SD) with a range of 1.4% to 46.6%. HAA decreased by an average of 0.35% (95% CI 0.21% to 0.48%) per year during the study time. In the primary analysis adjusted for potential confounders (Table 2), a 5μg/m3 increase in PM2.5 concentration was associated with a 0.54% (95% CI 0.02% to 1.10%, p-value 0.04) increase in HAA per year; a 40 ppb higher NOx concentration was associated with a 0.55% (95%CI 0.08% to 1.0%; p-value 0.02) increase in HAA per year. Effect estimates for NO2 concentration and progression of HAA were in a similar direction. There was a negative trend in the association between O3 and HAA, however, this was inconsistent in subgroup analyses. There were no consistent cross-sectional associations between year 2000 pollution estimates and HAA (see Table S3 in online supplement).
DISCUSSION
We found that exposure to ambient nitrogen oxides was associated with a higher prevalence of ILA among non-smokers and with progression of HAA among both smokers and non-smokers. In addition, greater ambient PM2.5 exposure was associated with HAA progression. While less consistent, there was a trend towards an inverse association between greater O3 concentrations and subclinical ILD. Ours is the first study to link air pollution with early evidence of lung inflammation and fibrosis on CT in community-dwelling adults, adding insight into the hypothesis that air pollution could contribute to ILD. The associations we found were strongest and most consistent for nitrogen oxide (NOx), which is predominantly a mixture of nitrogen monoxide (NO) and nitrogen dioxide (NO2). These results are similar to those of Johannson et al., in the sole prior study on the impact of air pollution on ILD.15 In a longitudinal study of 436 patients with idiopathic pulmonary fibrosis (IPF) from Seoul, South Korea, the authors showed that higher levels of NO2 over the previous six weeks were associated with increased risk of an IPF exacerbation. Epidemiologic studies have also established the importance of nitrate exposure with other respiratory conditions, including reduced lung function,24 asthma25 and COPD.26
NOx levels are highest in the near road environment, and may serve as a proxy for a suite of other traffic-related air pollutants (TRAP), including polyaromatic carbons, ultra-fine particles and other products of fossil fuel combustion. In comparison, O3 tends to be lower in the near road environment – both due to O3 scavenging by traffic-produced NO and because O3 is a secondary pollutant, which is photochemically produced in the troposphere by the reaction of sunlight on volatile compounds.27 This negative correlation could be responsible for the trend towards an inverse effect that we saw with higher levels of O3. During inhalation, NOx and TRAP combine with ammonia and other small particles, to penetrate deep within the bronchial tree. While there is some absorption throughout the respiratory tract, the primary site of injury is at the terminal bronchioles where particles can be phagocytized by airway macrophages, activate pulmonary nocioceptive fibers or cause direct epithelial damage.28 Mediated by the formation of reactive oxygen species, this leads to airway and systemic inflammation with ongoing cytokine and chemokine release. Murine models have demonstrated that nitrate exposure causes cellular injury, epithelial proliferation, hyperplasia, inflammation and fibrotic changes.29 In genetically susceptible humans, this could potentially initiate or contribute to the cycle of alveolar injury, disordered repair and fibrosis seen in the ILDs.
Our ILA findings were strongest in never smokers, a finding similar to other studies that have also reported pollution-related health effects predominantly in non-smokers.30 Previous authors have postulated that the detrimental effects of cigarette smoke may overwhelm the adverse consequences of ambient air pollution exposure.30 A similar phenomenon may drive the suggestion of a differential effect that we observed in ethnic groups with stronger effects from unmeasured healthcare disparities and other confounders compared to the effects due to air pollution. While our study had enough power to assess for associations with our main outcome of interest, our ability to show effect modification by these variables is limited.
The effect sizes we observed due to air pollution were small, but represent important subclinical changes in the lungs of asymptomatic community-dwelling U.S adults. We used sophisticated modelling to produce individual estimates of long-term exposure to air pollution, and investigated the effect of different lag times of exposure. By adjusting for site, we were able to eliminate unmeasured confounders between cities and focus on within city variations in pollutant levels.
This was an observational study with inherent limitations of exposure and outcome misclassification, residual confounding and the inability to infer causation. The longer term estimates of particulate matter exposure (twenty and thirty years) that were derived from historic models may be less accurate than our other pollutant estimates, which did not extrapolate to time periods with limited data and also benefitted from spatially intensive air pollution monitoring data. This non-differential exposure classification would be expected to weaken the strength of associations with ILA and HAA for the longer exposure periods. Our definition of subclinical ILD was based on radiologic findings rather than histologic changes. It is possible that our quantitative measurement of lung density included other pulmonary processes, such as edema, infection, or atelectasis. However, as described in our prior studies of this cohort, there was no evidence of confounding by cardiac function, obesity or the percentage of lung imaged.10
In summary, we found that ILA was associated with long-term average exposure to oxides of nitrogen among non-smokers, and that HAA progression was associated with exposure to both oxides of nitrogen and fine particulates. More epidemiologic and translational studies will be needed to investigate the roles of individual pollutants and identify the potential biological pathways underlying these associations. Although definitive evidence is still missing, this study provides supporting evidence that air pollution could be a potential risk factor for ILD. If proven, this would have important clinical implications for patients and serve to help inform public policy.
Supplementary Material
TABLE 3.
Long-term Estimates of Pollution Exposure and Progression of HAA
| Annual change in % HAA per 5 mcg/m3 increment in PM2.5 (95% CI) | p | Annual change in % HAA per 40 ppb increment in NOx (95%CI) | p | Annual change in % HAA per 10 ppb increment in NO2 (95% CI) | p | Annual change in % HAA per 10 ppb increment in O3 (95% CI) | p | |
|---|---|---|---|---|---|---|---|---|
| Overall | 0.54 (0.02 to 1.11) | 0.04 | 0.55 (0.08 to 1.01) | 0.02 | 0.22 (−0.26 to 0.68) | 0.40 | −0.021 (−0.63 to 0.59) | 0.95 |
| Sex | ||||||||
| Female | 0.33 (−0.41 to 1.0) | 0.41 | 0.80 (0.13 to 1.5) | 0.02 | 0.39 (−0.09 to 0.86) | 0.11 | −0.29 (−1.1 to 0.55) | 0.50 |
| Male | 0.20 (−0.18 to 1.3) | 0.14 | 0.13 (−0.54 to 0.79) | 0.71 | −0.14 (−0.62 to 0.33) | 0.71 | 0.44 (−0.41 to 1.3) | 0.31 |
| Race | ||||||||
| White | 1.0 (0.37 to 1.7) | 0.003 | 1.0 (0.24 to 1.8) | 0.01 | 0.57 (0.08 to 1.1) | 0.02 | 0.34 (−0.43 to 1.1) | 0.39 |
| Asian | 2.1 (−1.0 to 5.2) | 0.19 | 0.20 (−1.0 to 1.4) | 0.74 | −0.11 (−0.88 to 0.67) | 0.74 | 1.7 (−0.05 to 3.4) | 0.06 |
| Black | 0.39 (−0.79 to 1.6) | 0.52 | 0.64 (0.09 to 1.2) | 0.02 | 0.57 (−0.66 to 0.77) | 0.87 | 0.11 (−1.2 to 1.4) | 0.86 |
| Hispanic | 1.3 (0.03 to 2.6) | 0.05 | 1.1 (0.03 to 2.2) | 0.04 | 0.87 (−0.03 to 1.8) | 0.06 | −1.6 (−3.1 to −0.06) | 0.04 |
| Tobacco Use | ||||||||
| Never-smoker | 0.62 (−0.1 to 1.3) | 0.09 | 0.64 (−0.03 to 1.3) | 0.06 | 0.33 (−0.15 to 0.82) | 0.17 | −0.04 (0.92 to 0.83) | 0.93 |
| Ever-smoker | 0.70 (−0.02 to 1.4) | 0.06 | 0.69 (0.03 to 1.3) | 0.04 | 0.21 (−0.26 to 0.68) | 0.37 | 0.03 (−0.8 to 0.85) | 0.95 |
Linear longitudinal association of fine particulate matter (PM2.5), nitrogen oxides (NOx), nitrogen dioxide (NO2) and ozone (O3) with percent change in high attenuation areas (HAA), from linear mixed models adjusted for age, sex, race/ethnicity, educational attainment, JEM, height, BMI, waist circumference, smoking status, cigarette pack-years, glomerular filtration rate, total volume of image lung, percent emphysema on CT scan, CT scanner type and study site
Acknowledgments
The authors thank the other investigators, the staff and the participants of the MESA study for their valuable contributions. A list of participating MESA investigators and institutions can be found at http:–www.mesa-nhlbi.org. The coding of occupational information was conducted by the National Institute for Occupational Safety and Health (NORA FY08 CRN SLB8).
Declaration of Interests:
DJL has received consulting fees from Genentech/Roche, Boehringer-Ingelheim, Gilead, Pharmakea, Veracyte, Patara Pharmaceuticals, Fibrogen, Phillips Respironics, Degge Group and the France Foundation related to IPF; Columbia University has received funding for clinical trials in IPF from Boehringer-Ingelheim, Gilead, Bayer, Global Blood Therapeutics and Fibrogen; Columbia University has received funding from the Pulmonary Fibrosis Foundation for DJL’s consulting services; DJL has received fees for serving as a Deputy Editor for the Annals of the American Thoracic Society and as a Statistical Editor for Thorax.
GRB reports grants from NIH, grants from COPD Foundation, during the conduct of the study; grants from Alpha1 Foundation, personal fees from UpToDate, grants from Foundation for the NIH, outside the submitted work.
Role of the funding source
This study was overseen by a Steering Committee and an External Scientific Advisory Committee (ESAC). The NHLBI, NIOSH, EPA and Pulmonary Fibrosis Foundation had no role in the collection, analysis, or interpretation of the data; writing of the report; or the decision to submit the paper for publication. All authors were provided complete access to the data and all authors share responsibility for the decision to submit the manuscript.
Funding Sources: MESA and work in this manuscript was supported by the National Heart, Lung, and Blood Institute (NHLBI) through the following grants and contracts: N01-HC-95159, N01-HC-95160, N01-HC-95161, N01-HC-95162, N01-HC-95163, N01-HC-95164, N01-HC-95165, N01-HC-95166, N01-HC-95167, N01-HC-95168, N01-HC-95169, T32HL007287; by the National Center for Research Resources through UL1-TR-000040 and UL1-TR-001079; R01 HL103676, and K24 HL131937 and by the National Institute of Environmental Health Sciences through P50ES015915, P30ES07033, P30ES007033 and K24ES013195. This research has been supported by a grant from the US Environmental Protection Agency’s (EPA’s) Science to Achieve Results (STAR) programme. This publication was developed under Assistance Agreement number RD831697 awarded by the EPA to the University of Washington (WA, USA). This work was also funded by the Pulmonary Fibrosis Foundation and the Rocco Guinta Research Fund.
Footnotes
Disclaimer:
This report has not been formally reviewed by Environmental Protection Agency (EPA). The findings and conclusions in this report are those of the authors and do not necessarily represent the views of the EPA or the National Institute for Occupational Safety and Health (NIOSH). EPA and NIOSH do not endorse any products or commercial services mentioned in this publication.
Contributions:
All authors contributed substantially to the conception or design of the manuscript; or the acquisition, analysis, or interpretation of data for the manuscript. All authors contributed to drafting the manuscript or critical revision for important intellectual content. All authors approved the final version submitted.
References
- 1.Guarnieri M, Balmes JR. Outdoor air pollution and asthma. Lancet. 2014;383(9928):1581–92. doi: 10.1016/S0140-6736(14)60617-6. [DOI] [PMC free article] [PubMed] [Google Scholar]
- 2.Adar SD, Kaufman JD, Diez-Roux AV, Hoffman EA, D’Souza J, Stukovsky KH, et al. Air pollution and percent emphysema identified by computed tomography in the multi-ethnic study of atherosclerosis. Environmental health perspectives. 2015;123(2):144–51. doi: 10.1289/ehp.1307951. [DOI] [PMC free article] [PubMed] [Google Scholar]
- 3.Goss CH, Newsom SA, Schildcrout JS, Sheppard L, Kaufman JD. Effect of ambient air pollution on pulmonary exacerbations and lung function in cystic fibrosis. American journal of respiratory and critical care medicine. 2004;169(7):816–21. doi: 10.1164/rccm.200306-779OC. [DOI] [PubMed] [Google Scholar]
- 4.Rice MB, Rifas-Shiman SL, Oken E, Gillman MW, Ljungman PL, Litonjua AA, et al. Exposure to traffic and early life respiratory infection: A cohort study. Pediatric pulmonology. 2014 doi: 10.1002/ppul.23029. [DOI] [PMC free article] [PubMed] [Google Scholar]
- 5.Bhinder S, Chen H, Sato M, Copes R, Evans GJ, Chow CW, et al. Air pollution and the development of posttransplant chronic lung allograft dysfunction. American journal of transplantation: official journal of the American Society of Transplantation and the American Society of Transplant Surgeons. 2014;14(12):2749–57. doi: 10.1111/ajt.12909. [DOI] [PubMed] [Google Scholar]
- 6.Turner MC, Krewski D, Pope CA, 3rd, Chen Y, Gapstur SM, Thun MJ. Long-term ambient fine particulate matter air pollution and lung cancer in a large cohort of never-smokers. American journal of respiratory and critical care medicine. 2011;184(12):1374–81. doi: 10.1164/rccm.201106-1011OC. [DOI] [PubMed] [Google Scholar]
- 7.Raghu G, Chen SY, Yeh WS, Maroni B, Li Q, Lee YC, et al. Idiopathic pulmonary fibrosis in US Medicare beneficiaries aged 65 years and older: incidence, prevalence, and survival, 2001–11. The Lancet Respiratory medicine. 2014;2(7):566–72. doi: 10.1016/S2213-2600(14)70101-8. [DOI] [PubMed] [Google Scholar]
- 8.Doyle TJ, Hunninghake GM, Rosas IO. Subclinical interstitial lung disease: why you should care. American journal of respiratory and critical care medicine. 2012;185(11):1147–53. doi: 10.1164/rccm.201108-1420PP. [DOI] [PMC free article] [PubMed] [Google Scholar]
- 9.Lederer DJ, Enright PL, Kawut SM, Hoffman EA, Hunninghake G, van Beek EJ, et al. Cigarette smoking is associated with subclinical parenchymal lung disease: the Multi-Ethnic Study of Atherosclerosis (MESA)-lung study. American journal of respiratory and critical care medicine. 2009;180(5):407–14. doi: 10.1164/rccm.200812-1966OC. [DOI] [PMC free article] [PubMed] [Google Scholar]
- 10.Podolanczuk AJ, Oelsner EC, Barr RG, Hoffman EA, Armstrong HF, Austin JH, et al. High attenuation areas on chest computed tomography in community-dwelling adults: the MESA study. The European respiratory journal. 2016 doi: 10.1183/13993003.00129-2016. [DOI] [PMC free article] [PubMed] [Google Scholar]
- 11.Johnson C, Giles JT, Bathon J, Lederer D, Hoffman EA, Barr RG, et al. Smoking and Subclinical ILD in RA versus the Multi-Ethnic Study of Atherosclerosis. PloS one. 2016;11(4):e0153024. doi: 10.1371/journal.pone.0153024. [DOI] [PMC free article] [PubMed] [Google Scholar]
- 12.Araki T, Putman RK, Hatabu H, Gao W, Dupuis J, Latourelle JC, et al. Development and Progression of Interstitial Lung Abnormalities in the Framingham Heart Study. American journal of respiratory and critical care medicine. 2016 doi: 10.1164/rccm.201512-2523OC. [DOI] [PMC free article] [PubMed] [Google Scholar]
- 13.Putman RK, Hatabu H, Araki T, Gudmundsson G, Gao W, Nishino M, et al. Association Between Interstitial Lung Abnormalities and All-Cause Mortality. Jama. 2016;315(7):672–81. doi: 10.1001/jama.2016.0518. [DOI] [PMC free article] [PubMed] [Google Scholar]
- 14.Doyle TJ, Washko GR, Fernandez IE, Nishino M, Okajima Y, Yamashiro T, et al. Interstitial lung abnormalities and reduced exercise capacity. American journal of respiratory and critical care medicine. 2012;185(7):756–62. doi: 10.1164/rccm.201109-1618OC. [DOI] [PMC free article] [PubMed] [Google Scholar]
- 15.Johannson KA, Vittinghoff E, Lee K, Balmes JR, Ji W, Kaplan GG, et al. Acute exacerbation of idiopathic pulmonary fibrosis associated with air pollution exposure. The European respiratory journal. 2014;43(4):1124–31. doi: 10.1183/09031936.00122213. [DOI] [PMC free article] [PubMed] [Google Scholar]
- 16.Kaufman JD, Adar SD, Barr RG, Budoff M, Burke GL, Curl CL, et al. Association between air pollution and coronary artery calcification within six metropolitan areas in the USA (the Multi-Ethnic Study of Atherosclerosis and Air Pollution): a longitudinal cohort study. Lancet. 2016 doi: 10.1016/S0140-6736(16)00378-0. [DOI] [PMC free article] [PubMed] [Google Scholar]
- 17.Sieren JP, Newell JD, Jr, Barr RG, Bleecker ER, Burnette N, Carretta EE, et al. SPIROMICS Protocol for Multicenter Quantitative CT to Phenotype the Lungs. American journal of respiratory and critical care medicine. 2016 doi: 10.1164/rccm.201506-1208PP. [DOI] [PMC free article] [PubMed] [Google Scholar]
- 18.Washko GR, Hunninghake GM, Fernandez IE, Nishino M, Okajima Y, Yamashiro T, et al. Lung volumes and emphysema in smokers with interstitial lung abnormalities. The New England journal of medicine. 2011;364(10):897–906. doi: 10.1056/NEJMoa1007285. [DOI] [PMC free article] [PubMed] [Google Scholar]
- 19.Hoffman EA, Jiang R, Baumhauer H, Brooks MA, Carr JJ, Detrano R, et al. Reproducibility and validity of lung density measures from cardiac CT Scans–The Multi-Ethnic Study of Atherosclerosis (MESA) Lung Study. Academic radiology. 2009;16(6):689–99. doi: 10.1016/j.acra.2008.12.024. [DOI] [PMC free article] [PubMed] [Google Scholar]
- 20.Bergen S, Sheppard L, Sampson PD, Kim SY, Richards M, Vedal S, et al. A national prediction model for PM2.5 component exposures and measurement error-corrected health effect inference. Environmental health perspectives. 2013;121(9):1017–25. doi: 10.1289/ehp.1206010. [DOI] [PMC free article] [PubMed] [Google Scholar]
- 21.Keller JP, Olives C, Kim SY, Sheppard L, Sampson PD, Szpiro AA, et al. A unified spatiotemporal modeling approach for predicting concentrations of multiple air pollutants in the multi-ethnic study of atherosclerosis and air pollution. Environmental health perspectives. 2015;123(4):301–9. doi: 10.1289/ehp.1408145. [DOI] [PMC free article] [PubMed] [Google Scholar]
- 22.Kim SY, Olives C, Sheppard L, Sampson PD, Larson TV, Keller JP, et al. Historical Prediction Modeling Approach for Estimating Long-Term Concentrations of PM2.5 in Cohort Studies before the 1999 Implementation of Widespread Monitoring. Environmental health perspectives. 2016 doi: 10.1289/EHP131. [DOI] [PMC free article] [PubMed] [Google Scholar]
- 23.Doney B, Hnizdo E, Graziani M, Kullman G, Burchfiel C, Baron S, et al. Occupational risk factors for COPD phenotypes in the Multi-Ethnic Study of Atherosclerosis (MESA) Lung Study. Copd. 2014;11(4):368–80. doi: 10.3109/15412555.2013.813448. [DOI] [PMC free article] [PubMed] [Google Scholar]
- 24.Molter A, Agius RM, de Vocht F, Lindley S, Gerrard W, Lowe L, et al. Long-term exposure to PM10 and NO2 in association with lung volume and airway resistance in the MAAS birth cohort. Environmental health perspectives. 2013;121(10):1232–8. doi: 10.1289/ehp.1205961. [DOI] [PMC free article] [PubMed] [Google Scholar]
- 25.Mann JK, Balmes JR, Bruckner TA, Mortimer KM, Margolis HG, Pratt B, et al. Short-term effects of air pollution on wheeze in asthmatic children in Fresno, California. Environmental health perspectives. 2010;118(10):1497–502. doi: 10.1289/ehp.0901292. [DOI] [PMC free article] [PubMed] [Google Scholar]
- 26.Faustini A, Stafoggia M, Cappai G, Forastiere F. Short-term effects of air pollution in a cohort of patients with chronic obstructive pulmonary disease. Epidemiology (Cambridge, Mass) 2012;23(6):861–79. doi: 10.1097/EDE.0b013e31826767c2. [DOI] [PubMed] [Google Scholar]
- 27.Brunekreef B, Holgate ST. Air pollution and health. Lancet. 2002;360(9341):1233–42. doi: 10.1016/S0140-6736(02)11274-8. [DOI] [PubMed] [Google Scholar]
- 28.Akopian AN, Fanick ER, Brooks EG. TRP channels and traffic-related environmental pollution-induced pulmonary disease. Seminars in immunopathology. 2016;38(3):331–8. doi: 10.1007/s00281-016-0554-4. [DOI] [PMC free article] [PubMed] [Google Scholar]
- 29.Persinger RL, Poynter ME, Ckless K, Janssen-Heininger YM. Molecular mechanisms of nitrogen dioxide induced epithelial injury in the lung. Molecular and cellular biochemistry. 2002;234–235(1–2):71–80. [PubMed] [Google Scholar]
- 30.Schultz ES, Hallberg J, Bellander T, Bergstrom A, Bottai M, Chiesa F, et al. Early-Life Exposure to Traffic-related Air Pollution and Lung Function in Adolescence. American journal of respiratory and critical care medicine. 2016;193(2):171–7. doi: 10.1164/rccm.201505-0928OC. [DOI] [PubMed] [Google Scholar]
Associated Data
This section collects any data citations, data availability statements, or supplementary materials included in this article.