

Abstract
Bacteria may play a role in esophageal adenocarcinoma (EAC) and esophageal squamous cell carcinoma (ESCC), although evidence is limited to cross-sectional studies. In this study, we examined the relationship of oral microbiota with EAC and ESCC risk in a prospective study nested in two cohorts. Oral bacteria were assessed using 16S rRNA gene sequencing in pre-diagnostic mouthwash samples from n=81/160 EAC and n=25/50 ESCC cases/matched controls. Findings were largely consistent across both cohorts. Metagenome content was predicted using PiCRUST. We examined associations between centered log-ratio transformed taxon or functional pathway abundances and risk using conditional logistic regression adjusting for BMI, smoking, and alcohol. We found the periodontal pathogen Tannerella forsythia to be associated with higher risk of EAC. Further, we found that depletion of the commensal genus Neisseria and the species Streptococcus pneumoniae were associated with lower EAC risk. Bacterial biosynthesis of carotenoids was also associated with protection against EAC. Lastly, the abundance of the periodontal pathogen Porphyromonas gingivalis trended with higher risk of ESCC. Overall, our findings have potential implications for the early detection and prevention of EAC and ESCC.
Keywords: oral microbiome, esophageal cancer, esophageal adenocarcinoma, esophageal squamous cell carcinoma, bacteria
INTRODUCTION
Esophageal cancer is the eighth most common cancer and sixth most common cause of cancer-related death worldwide (1). Because late-stage presentation is common in most cases, esophageal cancers are highly fatal; 5-year survival rates range from 15 to 25% in most countries (2). Consequently there is a critical need for new avenues of prevention, risk stratification, and early detection.
The two main types, esophageal adenocarcinoma (EAC) and esophageal squamous cell carcinoma (ESCC), differ greatly in incidence, geography, and etiology. ESCC, the most common type worldwide, predominates in developing countries, while EAC has become the predominant type in developed countries as incidence rates continue to rise (2,3). Known risk factors include gastro-esophageal reflux disease (GERD), obesity, low fruit/vegetable intake, and smoking for EAC, and alcohol drinking, low fruit/vegetable intake, and smoking for ESCC (4), but the etiology of these diseases cannot be fully explained by these factors.
Recently, upper digestive tract microbiota have been suggested to play a role in esophageal cancer etiology, and in particular in the rising incidence of EAC in developed countries (5). The complex microbial community of the upper digestive tract, consisting of mutualists, commensals, and pathogens, could facilitate carcinogenesis via activation of toll-like receptors (6), or protect against carcinogenesis via synthesis of vitamins or providing barriers to pathogen invasion (5). Cross-sectional studies report distinct differences in upper digestive tract microbiota between GERD (7–9), Barrett’s esophagus (BE, an EAC precursor) (7–10), EAC (7,11), esophageal squamous dysplasia (ESD, an ESCC precursor) (12), or ESCC (13) cases and controls. Additionally, periodontitis (a disease of oral dysbiosis) may be associated with increased esophageal cancer risk (14). However, no studies have prospectively examined whether upper digestive tract microbiota influence risk for subsequent esophageal cancer.
We hypothesized that oral microbiota influence development of esophageal cancer. The oral microbiota shape the esophageal microbiome (15), due to migration of oral bacteria to the esophagus (16), and therefore may contribute to esophageal carcinogenesis. We conducted a prospective study nested in two large US cohorts, to determine whether oral microbiota are associated with subsequent EAC or ESCC risk.
MATERIALS AND METHODS
Parent cohorts
Participants were drawn from two US cohorts: the National Cancer Institute (NCI) Prostate, Lung, Colorectal, and Ovarian (PLCO) Cancer Screening Trial cohort and American Cancer Society (ACS) Cancer Prevention Study II (CPS-II) Nutrition cohort. Characteristics of these cohorts are comparable, with both cohorts collecting oral wash samples and comprehensive demographic information, and following prospectively for cancer incidence.
PLCO (17) is a large population-based randomized trial designed to determine effects of screening on cancer-related mortality in men and women aged 55–74, recruited in 1993–2001, and followed for cancer incidence. Participants were randomized to a screening or control arm. Oral wash samples were collected in the control arm only (n=52,000). Incident cancers were ascertained by annual mailed questionnaire and verified through medical records or death certificates.
CPS-II (18) includes >184,000 participants, aged 50–74 who completed a mailed baseline questionnaire in 1992. Follow-up questionnaires have been sent to cohort members every other year to update information and ascertain incident cancers, which are also verified through medical records, state registries, or death certificates. During 2000–2002, oral wash samples were collected from 70,004 participants.
Nested case-control study
Incident cases were cohort participants diagnosed with esophageal cancer any time after oral wash collection (collection to diagnosis time ranged from <1 year to 9 years; first quartile, median, third quartile = 1, 3, 5 years), and had no prior cancer history (except non-melanoma skin cancer). Matched controls were selected at a case:control ratio of 1:2 by incidence density sampling without replacement among participants who provided an oral wash sample in the same year as the index case, had no cancer at or prior to index case diagnosis, and were of the same cohort, age, sex, and race as the index case.
A total of 368 samples were provided and successfully sequenced, including 117 complete sets (1 case:2 controls), 2 reduced sets (1 case:1 control), and 13 unmatched controls (due to missing case, case failing sequencing, or non-esophageal case). Based on ICD morphology codes (EAC: 8140, 8144, 8480, 8481, 8560; ESCC: 8070, 8071, 8072, 8074, 8052), we included 81 EAC cases (with 160 matched controls) and 25 ESCC cases (with 50 matched controls) in the current analysis (total n=316). Cases of other or missing morphology (n=13), their matched controls (n=26), and unmatched controls (n=13) were excluded.
This study was conducted in accordance with the U.S. Common Rule and approved by the IRB of New York University School of Medicine, NCI, and ACS, and participants provided informed consent.
Covariate assessment
Covariate information was extracted from questionnaires preceding oral sample collection for each participant. BMI was categorized as normal or underweight (BMI<25 kg/m2), overweight (25≤BMI<30 kg/m2), or obese (BMI≥30 kg/m2). Smoking status was classified as never, former, or current. Drinking level was classified as never, moderate, or heavy (19). Servings of fruits and vegetables per day, derived from food frequency questionnaire responses, was categorized as low or high based on cohort-specific medians.
Oral wash sample collection
Participants were asked to swish with 10ml Scope mouthwash (P&G) and expectorate into a tube (17,18). Samples were shipped to each cohort’s biorepository and stored at −80°C. The oral microbiome is highly stable over time (20–22), and shows much greater inter-individual than intra-individual variation, indicating that a one-time oral sample collection is appropriate for assessing oral microbial risk factors in a cohort study.
Microbiome assay
We extracted DNA from oral wash samples using the PowerSoil DNA Isolation Kit (Mo Bio, Carlsbad, CA). Barcoded amplicons were generated covering the 16S rRNA gene V4 region using F515/R806 primers. The PCR reaction used FastStart High Fidelity PCR system, dNTP pack (Roche, IN) as follows: initial denaturing at 94°C for 3min, followed by 25 cycles of 94°C for 15s, 52°C for 45s and 72°C for 1min, and a final extension at 72°C for 8min. PCR products were purified using Agencourt AMPure XP (Beckman Coulter Life Sciences, IN), quantified using Agilent 4200 TapeStation (Agilent Technologies, CA), pooled at equimolar concentrations, and sequenced on Illumina MiSeq with a 300-cycle (2×151 bp) reagent kit.
Sequence data processing
Paired-end reads were joined and demultiplexed, and poor-quality reads excluded, using default parameters in QIIME (23). The 11422831 quality-filtered reads (from n=368 samples) were clustered into operational taxonomic units (OTUs) against the Human Oral Microbiome Database (HOMD) reference sequence collection (version 14.5) (24), and assigned HOMD taxonomy, using QIIME script pick_closed_reference_otus.py (23). This method discards reads not matching the database, leaving 11074719 reads (mean±SD=30094±21059; range=[4965–203242]) and 569 OTUs. We generated a phylogenetic tree from aligned HOMD reference sequences using FastTree (25).
Quality control
All samples underwent DNA extraction and sequencing in the same laboratory, with personnel blinded to case/control status. DNA from volunteer oral wash samples was included in the sequencing batches: six replicates from each of four volunteers in the CPS-II batch, and eight replicates from each of the same four volunteers in the PLCO batch. Intra-class correlation coefficients for the Shannon diversity index and relative abundance of major oral phyla were high (Supplementary Table 1), and principal coordinate analysis of UniFrac distances (26) showed clustering of repeat samples for each volunteer, indicating excellent reproducibility (Supplementary Figure 1).
Statistical analysis
We used multiple imputation (‘mice’ package, R) (27) to impute missing data for three important predictors of esophageal cancer, BMI, alcohol drinking, and fruit and vegetable intake. A total of 23 participants (7.3%) were missing BMI, 36 (11.4%) were missing alcohol drinking, and 39 (12.3%) were missing fruit and vegetable intake (% missing by case/control group shown in Table 1). Predictors of BMI category (<25, 25–30, ≥30) used in imputation were sex, race, age, cohort, smoking status, education level, and ethanol intake. Predictors of alcohol drinking (none, moderate, heavy) and fruit/vegetable intake (low or high) used in imputation were sex, race, age, cohort, smoking status, education level, and continuous BMI. Ten imputed datasets were used in analysis, and we present pooled estimates and p-values.
Table 1.
Pre-diagnosis demographic characteristics of esophageal adenocarcinoma and squamous cell carcinoma cases and matched controls.
| Adenocarcinoma | Squamous Cell Carcinoma | |||||
|---|---|---|---|---|---|---|
|
|
||||||
| Characteristic | Cases (n=81) |
Matched Controls (n=160a) |
p | Cases (n=25) |
Matched Controls (n=50) | p |
| Sexb (%) | 1.00c | 1.00c | ||||
|
| ||||||
| Women | 7.4 | 7.5 | 60.0 | 60.0 | ||
| Men | 92.6 | 92.5 | 40.0 | 40.0 | ||
|
| ||||||
| Ageb (mean ± SD) | 68.0 ± 6.7 | 68.0 ± 6.6 | 0.95d | 66.6 ± 6.5 | 66.8 ± 6.4 | 0.83d |
|
| ||||||
| Raceb (%) | 1.00c | 1.00c | ||||
|
| ||||||
| White | 97.5 | 97.5 | 84.0 | 84.0 | ||
| Other | 2.5 | 2.5 | 16.0 | 16.0 | ||
|
| ||||||
| BMIe (%) | 0.38c,f | 0.07c,f | ||||
|
| ||||||
| Normal weight | 22.2 | 21.9 | 52.0 | 38.0 | ||
| Overweight | 50.6 | 55.6 | 36.0 | 32.0 | ||
| Obese | 21.0 | 13.8 | 4.0 | 26.0 | ||
| Missing | 6.2 | 8.8 | 8.0 | 4.0 | ||
|
| ||||||
| Smoking (%) | 0.12c | 0.36c | ||||
|
| ||||||
| Never | 25.9 | 36.9 | 36.0 | 44.0 | ||
| Current | 9.9 | 5.0 | 16.0 | 6.0 | ||
| Former | 64.2 | 58.1 | 48.0 | 50.0 | ||
|
| ||||||
| Alcohol drinkingg (%) | 0.20c,f | 0.004c,f | ||||
|
| ||||||
| Never | 21.0 | 25.6 | 24.0 | 26.0 | ||
| Moderate | 51.9 | 53.1 | 32.0 | 54.0 | ||
| Heavy | 17.3 | 9.4 | 36.0 | 6.0 | ||
| Missing | 9.9 | 11.9 | 8.0 | 14.0 | ||
|
| ||||||
| Fruit and vegetable intakeh (%) | 0.85c,f | 1.00c,f | ||||
|
| ||||||
| Low | 44.4 | 42.5 | 48.0 | 48.0 | ||
| High | 43.2 | 45.6 | 40.0 | 38.0 | ||
| Missing | 12.3 | 11.9 | 12.0 | 14.0 | ||
There were two incomplete case sets (1 case: 1 control).
Sex, age, and race were matching factors.
Differences between cases and controls were detected using the Chi-squared test.
Differences between cases and controls were detected using the Wilcoxon rank-sum test .
Normal-weight: BMI < 25 kg/m2; Overweight: 25 ≤ BMI < 30 kg/m2; Obese: BMI ≥ 30 kg/m2.
P-value determined after exclusion of those missing the variable.
Moderate drinker: >0 but ≤1 drinks/day for women, and >0 but ≤2 drinks/day for men; Heavy drinker: >1 drinks/day for women, and >2 drinks/day for men.
Low and high intake groups reflect participants below or above cohort-specific median of servings of fruit and vegetables/day. CPS-II median=4.62 servings/day; PLCO median=6.10 servings/day.
α-diversity (within-subject diversity) was assessed by richness and the Shannon diversity index, calculated in 100 iterations of rarefied OTU tables of 4500 sequence reads per sample. This depth was chosen to sufficiently reflect sample diversity (Supplementary Figure 2) while retaining all participants. We examined whether α-diversity differed between cases and controls in conditional logistic regression using matched sets as strata and adjusting for smoking status, BMI category, and alcohol drinking level.
β-diversity (between-subject diversity) was assessed at OTU level using unweighted and weighted UniFrac distances (26). Permutational multivariate analysis of variance (PERMANOVA; ‘adonis’ function, ‘vegan’ package, R) (28) was used to examine statistically whether overall bacterial community composition differed by case/control status, using matched sets as strata and adjusting for smoking status, BMI category, and alcohol drinking level.
The 569 OTUs were agglomerated to 12 phyla, 26 classes, 42 orders, 70 families, 149 genera, and 513 species. We applied the centered log-ratio (clr) transformation (29) to the taxa counts at each level (e.g. phylum, class, etc.) after adding a pseudocount of 1. We used conditional logistic regression, using matched sets as strata and adjusting for smoking status, BMI category, and alcohol drinking level, to determine whether abundance of bacterial taxa predicts esophageal cancer risk. This analysis included only taxa present in ≥15% of the 316 participants (10 phyla, 20 classes, 28 orders, 46 families, 85 genera, 266 species), in order to exclude rare taxa and thereby minimize the number of statistical tests conducted. A priori species of interest were “red complex” periodontal pathogens: Tannerella forsythia, Porphyromonas gingivalis, and Treponema denticola (30). For other taxa, p-values were adjusted for the false discovery rate (FDR).
Metagenome content was predicted using PiCRUSt (31). Because PiCRUST gene content is pre-computed for the GreenGenes database of 16S rRNA genes, for this analysis we performed closed-reference OTU picking against the GreenGenes database prior to PiCRUST. The 5507 KEGG (32) gene orthologs were grouped into 270 KEGG pathways. We applied the clr transformation (29) to pathway counts after adding a pseudocount of 1, filtered to include pathways present in ≥15% of participants (255 pathways), and used conditional logistic regression, as described above, to determine whether abundance of functional pathways predicts esophageal cancer risk.
Ecological networks among species were inferred using the SPIEC-EASI (SParse InversE Covariance Estimation for Ecological Association Inference) algorithm (33). This statistical method, designed for ecological network inference from amplicon sequencing datasets, accounts for compositional data structure using the clr transformation and assumes a sparse underlying ecological association network. We applied SPIEC-EASI separately to EAC cases and matched controls, and ESCC cases and matched controls. The ‘igraph’ package in R was used for network visualization.
All statistical tests were two-sided. A p-value<0.05 was considered of nominal significance, and an FDR-adjusted p-value (q-value)<0.10 was considered significant after multiple comparisons adjustment. Analyses were conducted using R 3.2.1.
RESULTS
Participant characteristics
Cases and their matched controls did not differ on matching factors (Table 1). While obesity, low fruit/vegetable intake, and smoking are recognized risk factors for EAC, and alcohol drinking, low fruit/vegetable intake, and smoking are recognized risk factors for ESCC, only alcohol drinking was associated with ESCC (p=0.004).
Overall microbiota diversity in relation to EAC and ESCC
EAC and ESCC cases did not differ significantly from matched controls in oral α-diversity, as measured by species richness and the Shannon diversity index, or overall oral microbiome composition (β-diversity), as measured by unweighted and weighted UniFrac distances (Supplementary Table 2).
Taxa associated with EAC
For the a priori “red complex” periodontal pathogens (30), a doubling of Tannerella forsythia abundance relative to the geometric mean of all taxa was associated with 1.21 (95% confidence interval [CI] 1.01–1.46) times higher odds of EAC (p=0.04), while abundance of Porphyromonas gingivalis and Treponema denticola was not associated with EAC risk (Table 2; Figure 1). We identified several other oral taxa nominally associated with EAC risk (Table 3; Figure 1), although none reached the significance threshold after FDR adjustment (all q-value>0.32). Increased abundance of species Actinomyces cardiffensis, Selenomonas oral taxon 134, and Veillonella oral taxon 917 was associated with higher EAC risk (all p<0.05). Conversely, increased abundance of Corynebacterium durum, Prevotella nanceiensis, Streptococcus pneumoniae, Lachnoanaerobaculum umeaense, Oribacterium parvum, Solobacterium moorei, Neisseria sicca, Neisseria flavescens, and Haemophilus oral taxon 908 was associated with lower EAC risk (all p<0.05). Additional adjustment for fruit/vegetable intake did not impact effect estimates (percent change in beta coefficient for all nominally significant taxa <12%).
Table 2.
Periodontal pathogensa and risk for incident esophageal adenocarcinoma or squamous cell carcinoma.
| Adenocarcinoma | Squamous Cell Carcinoma | |||||||
|---|---|---|---|---|---|---|---|---|
|
|
||||||||
| Periodontal pathogen | Median relative abundance (% carriageb) | OR (95% CI)c | pc | Median relative abundance (% carriageb) | OR (95% CI)c | pc | ||
| EAC Cases (n=81) | Matched Controls (n=160) | ESCC Cases (n=25) | Matched Controls (n=50) | |||||
| Porphyromonas gingivalis | 0.00d (23.5) | 0.00 (25.0) | 1.06 (0.93, 1.20) | 0.40 | 0.00 (32.0) | 0.00 (20.0) | 1.30 (0.96, 1.77) | 0.09 |
|
| ||||||||
| Tannerella forsythia | 0.005 (56.8) | 0.00 (47.5) | 1.21 (1.01, 1.46) | 0.04 | 0.004 (52.0) | 0.01 (58.0) | 0.95 (0.58, 1.55) | 0.84 |
|
| ||||||||
| Treponema denticola | 0.00 (39.5) | 0.00 (37.5) | 0.99 (0.83, 1.17) | 0.87 | 0.00 (20.0) | 0.00 (44.0) | 1.09 (0.72, 1.66) | 0.67 |
Taxon raw counts were normalized with the clr transformation and used as predictors in conditional logistic regression models; models used matched sets as strata and adjusted for smoking status, BMI category, and alcohol drinking level.
Percent of participants with presence of particular taxon in their oral cavity.
Model parameters and p-values were pooled over 10 models from 10 imputed data sets (missing values in BMI category and alcohol drinking level were imputed) using ‘mice’ package, R.
Zeros in table are true zeros, as when >50% of participants do not carry a taxon the median relative abundance will be zero.
Figure 1. Forest plot of odds ratios (OR) and 95% confidence intervals (95% CI) for associations of clr-transformed periodontal pathogen (a priori), genus, and species abundance with EAC and ESCC risk in conditional logistic regression models.
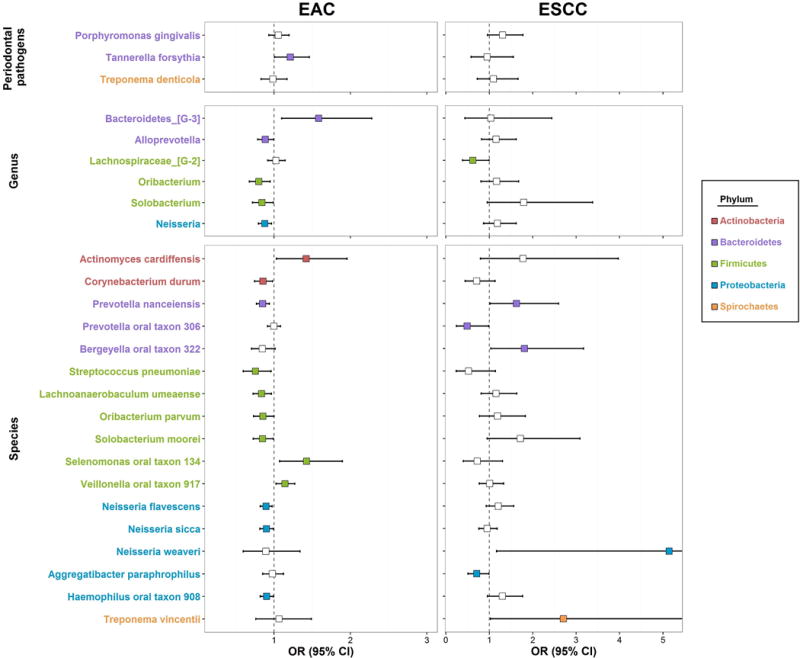
See Tables 2 and 3 for numeric display of the OR (95% CI) estimates. Taxa names are colored by phylum; odds ratio estimates are colored only if nominally statistically significant (p<0.05).
Table 3.
Oral taxaa associated with incident esophageal adenocarcinoma or squamous cell carcinoma, by phylum.
| Adenocarcinoma | Squamous Cell Carcinoma | |||||||
|---|---|---|---|---|---|---|---|---|
|
|
||||||||
| Taxon (Class; Order; Family; Genus; Species) | Median relative abundance (% carriageb) | OR (95% CI)c | pc | Median relative abundance (% carriageb) | OR (95% CI)c | pc | ||
| EAC Cases (n=81) | Matched Controls (n=160) | ESCC Cases (n=25) | Matched Controls (n=50) | |||||
| Actinobacteria | ||||||||
|
| ||||||||
| Actinobacteria; Actinomycetales (order) | 8.04 (100) | 6.99 (100) | 1.34 (1.01, 1.78) | 0.05 | 7.89 (100) | 5.82 (100) | 0.94 (0.45, 1.94) | 0.86 |
|
| ||||||||
| Actinobacteria; Actinomycetales; Actinomycetaceae; Actinomyces; cardiffensis (species) | 0.00d (46.9) | 0.00 (38.8) | 1.42 (1.03, 1.96) | 0.03 | 0.00 (44.0) | 0.00 (30.0) | 1.77 (0.79, 3.97) | 0.17 |
|
| ||||||||
| Actinobacteria; Corynebacteriales; Corynebacteriaceae; Corynebacterium; durum (species) | 0.02 (65.4) | 0.07 (76.2) | 0.86 (0.75, 0.98) | 0.03 | 0.09 (76.0) | 0.11 (84.0) | 0.71 (0.44, 1.13) | 0.15 |
|
| ||||||||
| Bacteroidetes | ||||||||
|
| ||||||||
| Bacteroidetes C-1; Bacteroidetes O-1; Bacteroidetes F-1; Bacteroidetes G-3 (genus) | 0.00 (19.8) | 0.00 (15.6) | 1.58 (1.10, 2.28) | 0.01 | 0.00 (20.0) | 0.00 (20.0) | 1.04 (0.44, 2.44) | 0.94 |
|
| ||||||||
| Bacteroidia; Bacteroidales; Prevotellaceae; Alloprevotella (genus) | 0.47 (88.9) | 0.56 (95.0) | 0.89 (0.79, 1.00) | 0.05 | 0.64 (100) | 0.73 (88.0) | 1.15 (0.82, 1.62) | 0.41 |
|
| ||||||||
| Bacteroidia; Bacteroidales; Prevotellaceae; Prevotella; nanceiensis (species) | 0.07 (74.1) | 0.21 (86.9) | 0.85 (0.77, 0.94) | 0.001 | 0.55 (92.0) | 0.18 (78.0) | 1.63 (1.02, 2.6) | 0.04 |
|
| ||||||||
| Bacteroidia; Bacteroidales; Prevotellaceae; Prevotella; oral taxon 306 (species) | 0.05 (77.8) | 0.08 (75.6) | 1.00 (0.92, 1.08) | 0.93 | 0.02 (64.0) | 0.17 (82.0) | 0.49 (0.24, 0.99) | 0.05 |
|
| ||||||||
| Flavobacteriia; Flavobacteriales; Flavobacteriaceae; Bergeyella; oral taxon 322 (species) | 0.07 (87.7) | 0.08 (90.0) | 0.85 (0.71, 1.01) | 0.07 | 0.10 (96.0) | 0.06 (96.0) | 1.81 (1.03, 3.17) | 0.03 |
|
| ||||||||
| Firmicutes | ||||||||
|
| ||||||||
| Bacilli; Lactobacillales; Streptococcaceae; Streptococcus; pneumoniae (species) | 0.09 (98.8) | 0.10 (99.4) | 0.76 (0.60, 0.96) | 0.02 | 0.08 (100) | 0.14 (98.0) | 0.52 (0.24, 1.14) | 0.10 |
|
| ||||||||
| Clostridia; Clostridiales; Lachnospiraceae XIV; Lachnoanaerobaculum; umeaense (species) | 0.02 (72.8) | 0.06 (81.2) | 0.84 (0.73, 0.97) | 0.02 | 0.05 (84.0) | 0.05 (78.0) | 1.15 (0.81, 1.63) | 0.42 |
|
| ||||||||
| Clostridia; Clostridiales; Lachnospiraceae XIV; Lachnospiraceae G-2 (genus) | 0.01 (63) | 0.02 (56.9) | 1.02 (0.92, 1.14) | 0.67 | 0.00 (44.0) | 0.04 (76.0) | 0.62 (0.38, 0.99) | 0.05 |
|
| ||||||||
| Clostridia; Clostridiales; Lachnospiraceae XIV; Oribacterium (genus) | 0.21 (90.1) | 0.21 (96.2) | 0.80 (0.68, 0.95) | 0.01 | 0.13 (92.0) | 0.13 (88.0) | 1.16 (0.81, 1.68) | 0.41 |
|
| ||||||||
| Clostridia; Clostridiales; Lachnospiraceae XIV; Oribacterium; parvum (species) | 0.00 (30.9) | 0.00 (40.6) | 0.85 (0.73, 1.00) | 0.05 | 0.01 (52.0) | 0.004 (52.0) | 1.19 (0.77, 1.83) | 0.43 |
|
| ||||||||
| Erysipelotrichia; Erysipelotrichales; Erysipelotrichaceae; Solobacterium (genus) | 0.04 (82.7) | 0.08 (91.9) | 0.84 (0.72, 0.99) | 0.04 | 0.07 (96.0) | 0.07 (84.0) | 1.79 (0.95, 3.38) | 0.07 |
|
| ||||||||
| Erysipelotrichia; Erysipelotrichales; Erysipelotrichaceae; Solobacterium; moorei (species) | 0.04 (82.7) | 0.08 (91.9) | 0.85 (0.73, 0.99) | 0.04 | 0.07 (96.0) | 0.07 (84.0) | 1.71 (0.95, 3.09) | 0.08 |
|
| ||||||||
| Negativicutes; Selenomonadales; Veillonellaceae; Selenomonas; oral taxon 134 (species) | 0.00 (45.7) | 0.00 (31.9) | 1.43 (1.07, 1.89) | 0.02 | 0.00 (24.0) | 0.00 (40.0) | 0.72 (0.40, 1.30) | 0.28 |
|
| ||||||||
| Negativicutes; Selenomonadales; Veillonellaceae; Veillonella; oral taxon 917 (species) | 0.00 (35.8) | 0.00 (18.8) | 1.14 (1.03, 1.27) | 0.01 | 0.00 (28.0) | 0.00 (20.0) | 1.01 (0.77, 1.33) | 0.94 |
|
| ||||||||
| Proteobacteria | ||||||||
|
| ||||||||
| Betaproteobacteria (class) | 1.50 (96.3) | 2.59 (96.9) | 0.87 (0.78, 0.97) | 0.02 | 3.58 (96.0) | 2.40 (98.0) | 1.15 (0.80, 1.64) | 0.45 |
|
| ||||||||
| Betaproteobacteria; Neisseriales (order) | 1.32 (96.3) | 2.47 (96.9) | 0.88 (0.79, 0.98) | 0.02 | 3.37 (96.0) | 2.29 (98.0) | 1.18 (0.84, 1.67) | 0.34 |
|
| ||||||||
| Betaproteobacteria; Neisseriales; Neisseriaceae (family) | 1.32 (96.3) | 2.47 (96.9) | 0.88 (0.79, 0.98) | 0.02 | 3.37 (96.0) | 2.29 (98.0) | 1.19 (0.85, 1.66) | 0.32 |
|
| ||||||||
| Betaproteobacteria; Neisseriales; Neisseriaceae; Neisseria (genus) | 1.20 (93.8) | 2.42 (95.6) | 0.88 (0.80, 0.97) | 0.01 | 3.23 (96.0) | 2.13 (98.0) | 1.19 (0.87, 1.62) | 0.29 |
|
| ||||||||
| Betaproteobacteria; Neisseriales; Neisseriaceae; Neisseria; flavescens (species) | 0.60 (85.2) | 1.24 (92.5) | 0.89 (0.82, 0.98) | 0.01 | 1.76 (96.0) | 1.13 (96.0) | 1.20 (0.93, 1.56) | 0.16 |
|
| ||||||||
| Betaproteobacteria; Neisseriales; Neisseriaceae; Neisseria; sicca (species) | 0.10 (75.3) | 0.19 (85.0) | 0.90 (0.81, 0.99) | 0.04 | 0.05 (88.0) | 0.18 (88.0) | 0.95 (0.76, 1.18) | 0.64 |
|
| ||||||||
| Betaproteobacteria; Neisseriales; Neisseriaceae; Neisseria; weaveri (species) | 0.00 (17.3) | 0.00 (21.9) | 0.89 (0.60, 1.34) | 0.59 | 0.00 (36.0) | 0.00 (16.0) | 5.14 (1.17, 22.64) | 0.03 |
|
| ||||||||
| Gammaproteobacteria; Pasteurellales; Pasteurellaceae; Aggregatibacter; paraphrophilus (species) | 0.00 (42.0) | 0.00 (41.2) | 0.98 (0.85, 1.12) | 0.75 | 0.00 (28.0) | 0.01 (56.0) | 0.71 (0.51, 0.99) | 0.04 |
|
| ||||||||
| Gammaproteobacteria; Pasteurellales; Pasteurellaceae; Haemophilus; oral taxon 908 (species) | 0.07 (69.1) | 0.28 (81.9) | 0.90 (0.82, 0.99) | 0.04 | 0.51 (84.0) | 0.31 (74.0) | 1.3 (0.96, 1.76) | 0.09 |
|
| ||||||||
| Spirochaetes | ||||||||
|
| ||||||||
| Spirochaetia; Spirochaetales; Spirochaetaceae; Treponema; vincentii (species) | 0.00 (16.0) | 0.00 (18.1) | 1.06 (0.76, 1.49) | 0.71 | 0.00 (20.0) | 0.00 (26.0) | 2.71 (1.03, 7.14) | 0.04 |
Taxon raw counts were normalized with the clr transformation and used as predictors in conditional logistic regression models; models used matched sets as strata and adjusted for smoking status, BMI category, and alcohol drinking level. All taxa (classes, orders, families, genera, species) with p<0.05 are included in the table. We did not observe phylum-level associations with EAC or ESCC risk.
Percent of participants with presence of particular taxon in their oral cavity.
Model parameters and p-values were pooled over 10 models from 10 imputed data sets (missing values in BMI category and alcohol drinking level were imputed) using ‘mice’ package, R.
Zeros in table are true zeros, as when >50% of participants do not carry a taxon the median relative abundance will be zero.
We observed that the majority of these species were associated with each other in an ecological network analysis (Figure 2a). The protective species in phylum Proteobacteria (Neisseria sicca, Neisseria flavescens, and Haemophilus oral taxon 908) were closely connected, as were some of the protective species in phylum Firmicutes (Solobacterium moorei, Oribacterium parvum, and Lachnoanaerobaculum umeaense). Some of the species formed their own networks (i.e. unrelated to other EAC-associated species), including Streptococcus pneumoniae and Selenomonas oral taxon 134.
Figure 2. Ecological networks among bacterial species associated with EAC or ESCC risk.
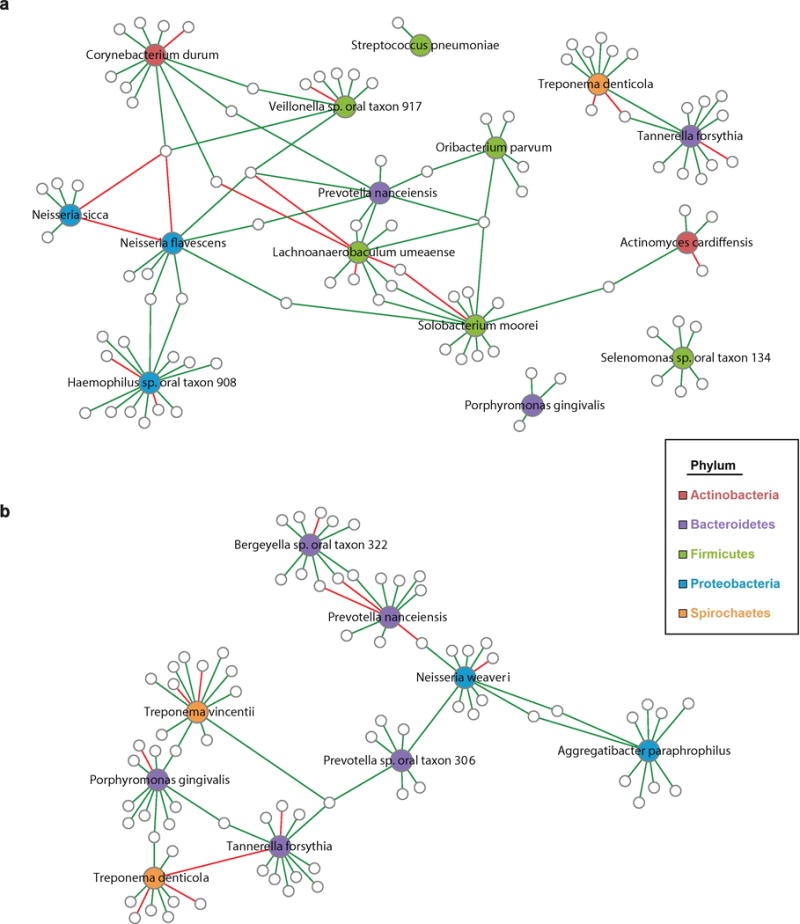
The SPIEC-EASI algorithm (33) was used to infer microbial ecological networks. In (a) algorithm was applied to EAC cases and matched controls (n=241), and only networks related to EAC-associated species or a priori periodontal pathogens are shown. In (b) algorithm was applied to ESCC cases and matched controls (n=75), and only networks related to ESCC-associated species or a priori periodontal pathogens are shown. Species associated with EAC or ESCC are colored by phylum; other species in networks are indicated by small gray-outlined circles. Lines connecting species are colored by sign (positive: green, negative: red).
We additionally explored heterogeneity of taxon abundance–EAC associations by years from oral wash collection to diagnosis (≤ or > median of 3 years), cohort (CPS-II or PLCO), smoking status (ever or never), obesity (non-obese or obese), and fruit/vegetable intake (low or high). Taxon findings were consistent across years to diagnosis sub-groups (all p-interaction>0.12) (Supplementary Table 3). Similarly, taxon findings were largely consistent across cohorts (Supplementary Table 4; Supplementary Figure 3); in particular, Streptococcus pneumoniae, Solobacterium moorei, Veillonella oral taxon 917, Neisseria sicca, Neisseria flavescens, and Haemophilus oral taxon 908 showed homogenous associations with EAC in both cohorts. Selenomonas oral taxon 134 was associated with higher EAC risk in the PLCO cohort only (p-interaction=0.02). Similarly, the periodontal pathogens tended to be associated with higher EAC risk only in PLCO (p-interaction=0.11, 0.35, and 0.04 for Porphyromonas gingivalis, Tannerella forsythia, and Treponema denticola, respectively). When stratifying by smoking status we observed that Lachnoanaerobaculum umeaense was associated with lower EAC risk only in smokers (p-interaction=0.02) (Supplementary Table 5), while other taxon-EAC associations did not differ significantly between ever and never smokers (p-interaction>0.19). When stratifying by obesity we observed that Actinomyces cardiffensis was associated with higher EAC risk only in non-obese (p-interaction=0.02), while other taxon-EAC associations did not differ significantly between non-obese and obese (p-interaction>0.11) (Supplementary Table 6). Finally, when we stratified by fruit and vegetable intake, order Actinomycetales was associated with higher EAC risk only in those with higher fruit and vegetable intake (p-interaction=0.05), while other interactions were non-significant (p-interaction>0.18) (Supplementary Table 7).
Taxa associated with ESCC
The periodontal pathogen Porphyromonas gingivalis was marginally associated with higher ESCC risk (OR [95% CI]=1.30 [0.96–1.77], p=0.09) (Table 2; Figure 1). Several other species were nominally associated with ESCC risk (Table 3; Figure 1), although none reached the significance threshold after FDR adjustment (all q-value>0.80). Increased abundance of Prevotella nanceiensis, Bergeyella oral taxon 322, Neisseria weaveri, and Treponema vincentii was associated with higher ESCC risk, while increased abundance of Prevotella oral taxon 306 and Aggregatibacter paraphrophilus was associated with lower ESCC risk (all p<0.05). Additional adjustment for fruit/vegetable intake did not impact effect estimates (percent change in beta coefficient for all nominally significant taxa <11%). We did not perform stratified analysis of taxonomic findings for ESCC due to small sample size.
All of the species nominally associated with ESCC were associated with each other in an ecological network analysis (Figure 2b). Interestingly, Treponema vincentii, which was associated with increased ESCC risk and has been previously associated with periodontal disease (34,35), was linked to other periodontal pathogens (Porphyromonas gingivalis, Tannerella forsythia) in the ecological network.
Inferred metagenomic analysis
Analysis of inferred metagenomes revealed a number of metabolic pathways nominally associated with EAC risk (Table 4), although none reached the significance threshold after FDR adjustment. Increased abundance of endocytosis, sulfur relay system, biosynthesis of siderophore groups, and bisphenol degradation pathways was associated with higher EAC risk, and alpha-Linolenic acid (ALA) metabolism and carotenoid biosynthesis pathways with lower risk (all p<0.05). We did not identify any pathways associated with ESCC risk. Species Neisseria sicca and Neisseria flavescens, associated with reduced EAC risk, were positively correlated with the protective carotenoid biosynthesis and ALA metabolism pathways (Figure 3).
Table 4.
KEGG pathwaysa associated with incident esophageal adenocarcinoma or squamous cell carcinoma.
| Adenocarcinomab | Squamous Cell Carcinomab | |||
|---|---|---|---|---|
|
|
||||
| KEGG pathway | OR (95% CI)c | pc | OR (95% CI)c | pc |
| Cellular Processes | ||||
| Meiosis - yeast | 1.73 (1.10, 2.70) | 0.02 | 1.39 (0.50, 3.86) | 0.52 |
| Endocytosis | 1.46 (1.09, 1.96) | 0.01 | 0.80 (0.27, 2.34) | 0.68 |
| Genetic Information Processing | ||||
| Sulfur relay system | 5.21 (1.19, 22.7) | 0.03 | 0.49 (0.01, 48.48) | 0.76 |
| Metabolism | ||||
| Glycosphingolipid biosynthesis - globo series | 0.43 (0.18, 0.99) | 0.05 | 0.69 (0.29, 1.68) | 0.42 |
| alpha-Linolenic acid metabolism | 0.78 (0.64, 0.95) | 0.01 | 1.18 (0.73, 1.90) | 0.50 |
| Porphyrin and chlorophyll metabolism | 4.02 (1.23, 13.15) | 0.02 | 1.47 (0.17, 12.99) | 0.73 |
| Biosynthesis of siderophore group nonribosomal peptides | 2.03 (1.10, 3.75) | 0.02 | 0.79 (0.20, 3.14) | 0.73 |
| Carotenoid biosynthesis | 0.84 (0.70, 1.00) | 0.05 | 1.12 (0.70, 1.81) | 0.63 |
| Bisphenol degradation | 3.07 (1.30, 7.24) | 0.01 | 2.37 (0.35, 16.16) | 0.38 |
KEGG pathway raw counts were normalized with the clr transformation and used as predictors in conditional logistic regression models; models used matching set as strata and adjusted for smoking status, BMI category, and alcohol drinking level. All pathways with p<0.05 are included in the table.
Adenocarcinoma includes 81 EAC cases and 160 matched controls, and Squamous Cell Carcinoma includes 25 ESCC cases and 50 matched controls.
Model parameters and p-values were pooled over 10 models from 10 imputed data sets (missing values in BMI category and alcohol drinking level were imputed) using ‘mice’ package, R.
Figure 3. Correlations of bacterial species and inferred metagenomic functions.
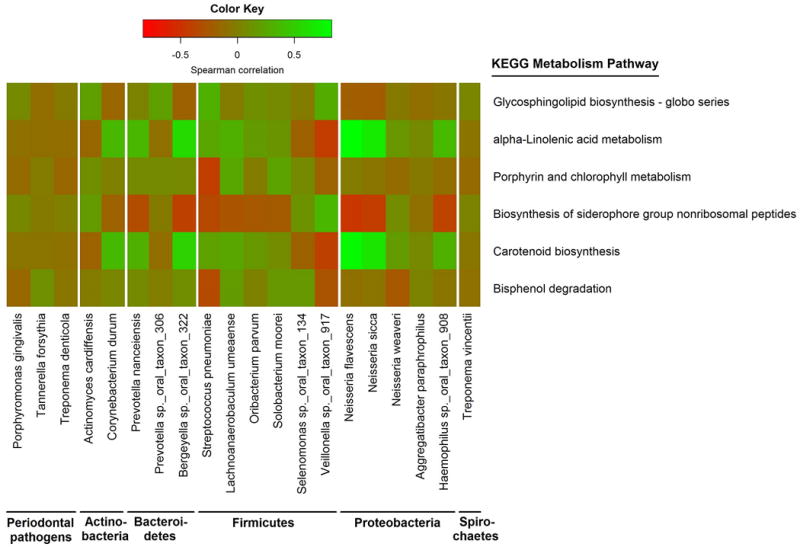
Species and KEGG pathway counts were clr-transformed. Partial Spearman’s correlation coefficients were estimated for each pairwise comparison of species and KEGG pathway abundance, adjusting for age, sex, cohort, race, and smoking. Only KEGG pathways relating to metabolism, and periodontal pathogens or species associated with EAC or ESCC (p<0.05), are included in the heatmap.
DISCUSSION
In this first prospective study of oral microbiota and esophageal cancer risk, we did not observe significant associations between overall microbiota diversity or composition and subsequent EAC or ESCC risk. However, several species were nominally associated with risk, among them potential pathogens and also commensal species. Interestingly, bacterial taxon associations observed were unique to either EAC or ESCC, in line with the fundamentally different origins of these cancer types. We also show replication of several taxonomic findings in both the CPS-II and PLCO cohorts. Our biologically plausible findings warrant further investigation in larger studies, to fully explore prospects of modulating the oral microbiota for esophageal cancer prevention or utilizing it for risk-stratification and early detection.
Studies of oral disease and cancer provide evidence that oral health (tooth loss, poor oral hygiene, and possibly periodontal disease) is linked to esophageal cancer risk (14,36–38). We observed that Tannerella forsythia was associated with higher EAC risk, and Porphyromonas gingivalis with ESCC risk. These two species are members of the “red complex” of periodontal pathogens, i.e. the species most strongly associated with severe periodontitis (30). A recent report revealed that Porphyromonas gingivalis was detected at a higher rate in ESCC tumor tissue, compared to adjacent normal and healthy control mucosa; moreover, Porphyromonas gingivalis presence was associated with ESCC lymph node metastasis and decreased survival time (39). More research is needed to determine whether periodontal disease and/or periodontal pathogens play a role in EAC/ESCC carcinogenesis, particularly since periodontal pathogen-EAC risk associations were inconsistent between the CPS-II and PLCO cohorts.
Several small studies have characterized the esophageal microbiota in relation to EAC (7,11) or its precursors, GERD (7–9) and BE (7–10). Campylobacter species were shown to dominate GERD and BE biopsies compared to controls in two culture-based studies of subjects from the UK (7,10). Yang et al. surveyed 16S rRNA genes from distal esophageal biopsies of 12 controls, 12 GERD patients, and 12 BE patients in the US (8); they observed a distinctly different microbial composition in GERD and BE patients compared to controls, characterized by greater diversity, decreased Streptococcus, and increased abundance of gram-negative anaerobes including Veillonella, Neisseria, Prevotella, Campylobacter, Porphyromonas, Fusobacterium, and Actinomyces. Similarly, Japanese patients with BE had decreased Streptococcus, and increased Veillonella, Neisseria, and Fusobacterium in distal esophageal biopsies compared to controls (9). Finally, Zaidi et al. observed decreased abundance of Streptococcus pneumoniae in dysplastic, tumor-adjacent normal, and EAC biopsy samples compared to normal and BE samples from US patients (11). We observed an inverse association between Streptococcus pneumoniae and incident EAC, consistent with above-mentioned studies. In contrast to above-mentioned studies, we observed an inverse association of genus Neisseria with EAC risk. Neisseria species are oral cavity commensals (40), and we and others previously showed that oral Neisseria are depleted by cigarette smoking (41–43), a cause of EAC. Interestingly, we found that Neisseria were only associated with lower EAC risk in smokers (though interaction was not significant), possibly suggesting a joint effect of smoking and Neisseria depletion. Differing findings from previous literature may relate to differences in study design (cross-sectional vs. prospective) and sample origin (biopsy vs. oral).
Other studies have characterized the microbiota related to ESCC (13) and its precursor, ESD (12). Yu et al. observed that lower microbial richness and altered composition of upper digestive tract microbiota were associated with ESD in Chinese subjects (12). Likewise, Chen et al. reported differences in carriage and/or relative abundance of oral genera between 87 ESCC cases and 85 controls, including increased relative abundance of Prevotella, Streptococcus, and Porphyromonas in ESCC cases. These authors did not report findings at species level, making comparison with our mostly species-level findings for ESCC difficult.
Analysis of inferred metagenomes revealed several pathways associated with EAC, albeit not after FDR adjustment; some appeared biologically plausible. Bacterial carotenoid biosynthesis was associated with lower EAC risk, with Neisseria species potentially contributing to this protective pathway. Carotenoids are phytochemicals in fruits and vegetables, many acting as antioxidants (44). Higher fruit and vegetable intake and higher beta-carotene intake have been associated with reduced EAC risk (4,45). Additionally, beta-carotene therapy was shown to ameliorate GERD symptoms (46). Bacterial biosynthesis of siderophores (iron-chelating compounds) was associated with higher EAC risk. While excessive iron may promote carcinogenesis (47) and iron chelation has been considered as a potential EAC therapy (48), iron is an essential trace element with deficiency leading to inflammation (49). Bacterial siderophore synthesis may upset iron homeostasis, and thus might increase EAC risk. These inferred metagenomic functions provide insight into bacterial actions that may potentially impact EAC risk, and warrant further investigation with full metagenomic sequencing.
Strengths of our study included the prospective design, comprehensive 16S rRNA gene sequencing, inclusion of two cohorts, and adjustment for EAC/ESCC risk factors throughout analysis. Our study also had several limitations. Lack of periodontal status of participants did not allow us to determine whether periodontal pathogens are implicated independently of periodontal disease. We also lacked data on presence of esophageal cancer precursor conditions (i.e. GERD and BE) in the participants, which could mediate or confound oral microbiome – esophageal cancer associations, and data on medications (e.g. proton-pump inhibitors, antibiotics) which could confound these associations (50,51). Additionally, though our study is the largest of its kind, case sample sizes (n=81 EAC and n=25 ESCC) remained small, limiting statistical power to detect FDR-adjusted significant associations, and our study population was mostly white, limiting generalizability.
In summary, we found evidence that specific bacterial pathogens may play a role in esophageal cancer risk, whereas other bacterial types may be associated with reduced risk. Larger studies are needed to confirm our findings, particularly among smokers and non-smokers to clarify joint effects, followed by experimental animal models to clarify causal relationships. Identification of oral bacteria causal or protective in esophageal cancer could lead to interventions for their eradication or colonization in at-risk individuals. Continued study of oral microbiota in esophageal cancer may lead to actionable means for prevention of this highly fatal disease.
Supplementary Material
Acknowledgments
Samples were sequenced at the NYU School of Medicine Genome Technology Center.
Financial support: This work was supported in part by the National Cancer Institute at the National Institutes of Health (R01CA159036, U01CA182370, R01CA164964, R03CA159414, P30CA016087, and R21CA183887). The NYU School of Medicine Genome Technology Center where samples were sequenced is partially supported by the Perlmutter Cancer Center support grant P30CA016087. The American Cancer Society (ACS) funds the creation, maintenance, and updating of the Cancer Prevention Study II cohort. ZP is a Staff Physician at the Department of Veterans Affairs New York Harbor Healthcare System. The content is solely the responsibility of the authors and does not necessarily represent the official views of the National Institutes of Health, the U.S. Department of Veterans Affairs or the United States Government.
Footnotes
Conflict of interest disclosure: The authors declare no potential conflicts of interest
References
- 1.Ferlay J, Soerjomataram I, Dikshit R, Eser S, Mathers C, Rebelo M, et al. Cancer incidence and mortality worldwide: sources, methods and major patterns in GLOBOCAN 2012. International journal of cancer Journal international du cancer. 2015;136(5):E359–86. doi: 10.1002/ijc.29210. [DOI] [PubMed] [Google Scholar]
- 2.Gupta B, Kumar N. Worldwide incidence, mortality and time trends for cancer of the oesophagus. European journal of cancer prevention : the official journal of the European Cancer Prevention Organisation (ECP) 2016 doi: 10.1097/CEJ.0000000000000249. [DOI] [PubMed] [Google Scholar]
- 3.Rubenstein JH, Shaheen NJ. Epidemiology, Diagnosis, and Management of Esophageal Adenocarcinoma. Gastroenterology. 2015;149(2):302–17.e1. doi: 10.1053/j.gastro.2015.04.053. [DOI] [PMC free article] [PubMed] [Google Scholar]
- 4.Engel LS, Chow WH, Vaughan TL, Gammon MD, Risch HA, Stanford JL, et al. Population attributable risks of esophageal and gastric cancers. Journal of the National Cancer Institute. 2003;95(18):1404–13. doi: 10.1093/jnci/djg047. [DOI] [PubMed] [Google Scholar]
- 5.Yang L, Chaudhary N, Baghdadi J, Pei Z. Microbiome in reflux disorders and esophageal adenocarcinoma. Cancer journal (Sudbury, Mass) 2014;20(3):207–10. doi: 10.1097/PPO.0000000000000044. [DOI] [PMC free article] [PubMed] [Google Scholar]
- 6.Kauppila JH, Selander KS. Toll-like receptors in esophageal cancer. Frontiers in immunology. 2014;5:200. doi: 10.3389/fimmu.2014.00200. [DOI] [PMC free article] [PubMed] [Google Scholar]
- 7.Blackett KL, Siddhi SS, Cleary S, Steed H, Miller MH, Macfarlane S, et al. Oesophageal bacterial biofilm changes in gastro-oesophageal reflux disease, Barrett’s and oesophageal carcinoma: association or causality? Alimentary pharmacology & therapeutics. 2013;37(11):1084–92. doi: 10.1111/apt.12317. [DOI] [PubMed] [Google Scholar]
- 8.Yang L, Lu X, Nossa CW, Francois F, Peek RM, Pei Z. Inflammation and intestinal metaplasia of the distal esophagus are associated with alterations in the microbiome. Gastroenterology. 2009;137(2):588–97. doi: 10.1053/j.gastro.2009.04.046. [DOI] [PMC free article] [PubMed] [Google Scholar]
- 9.Liu N, Ando T, Ishiguro K, Maeda O, Watanabe O, Funasaka K, et al. Characterization of bacterial biota in the distal esophagus of Japanese patients with reflux esophagitis and Barrett’s esophagus. BMC infectious diseases. 2013;13:130. doi: 10.1186/1471-2334-13-130. [DOI] [PMC free article] [PubMed] [Google Scholar]
- 10.Macfarlane S, Furrie E, Macfarlane GT, Dillon JF. Microbial colonization of the upper gastrointestinal tract in patients with Barrett’s esophagus. Clinical infectious diseases : an official publication of the Infectious Diseases Society of America. 2007;45(1):29–38. doi: 10.1086/518578. [DOI] [PubMed] [Google Scholar]
- 11.Zaidi AH, Kelly LA, Kreft RE, Barlek M, Omstead AN, Matsui D, et al. Associations of microbiota and toll-like receptor signaling pathway in esophageal adenocarcinoma. BMC cancer. 2015;16:52. doi: 10.1186/s12885-016-2093-8. [DOI] [PMC free article] [PubMed] [Google Scholar]
- 12.Yu G, Gail MH, Shi J, Klepac-Ceraj V, Paster BJ, Dye BA, et al. Association between upper digestive tract microbiota and cancer-predisposing states in the esophagus and stomach. Cancer epidemiology, biomarkers & prevention : a publication of the American Association for Cancer Research, cosponsored by the American Society of Preventive Oncology. 2014;23(5):735–41. doi: 10.1158/1055-9965.EPI-13-0855. [DOI] [PMC free article] [PubMed] [Google Scholar]
- 13.Chen X, Winckler B, Lu M, Cheng H, Yuan Z, Yang Y, et al. Oral Microbiota and Risk for Esophageal Squamous Cell Carcinoma in a High-Risk Area of China. PloS one. 2015;10(12):e0143603. doi: 10.1371/journal.pone.0143603. [DOI] [PMC free article] [PubMed] [Google Scholar]
- 14.Michaud DS, Kelsey KT, Papathanasiou E, Genco CA, Giovannucci E. Periodontal disease and risk of all cancers among male never smokers: an updated analysis of the Health Professionals Follow-up Study. Annals of oncology : official journal of the European Society for Medical Oncology / ESMO. 2016;27(5):941–7. doi: 10.1093/annonc/mdw028. [DOI] [PMC free article] [PubMed] [Google Scholar]
- 15.Pei Z, Bini EJ, Yang L, Zhou M, Francois F, Blaser MJ. Bacterial biota in the human distal esophagus. Proceedings of the National Academy of Sciences of the United States of America. 2004;101(12):4250–5. doi: 10.1073/pnas.0306398101. [DOI] [PMC free article] [PubMed] [Google Scholar]
- 16.Lawson RD, Coyle WJ. The noncolonic microbiome: does it really matter? Current gastroenterology reports. 2010;12(4):259–62. doi: 10.1007/s11894-010-0111-6. [DOI] [PubMed] [Google Scholar]
- 17.Hayes RB, Reding D, Kopp W, Subar AF, Bhat N, Rothman N, et al. Etiologic and early marker studies in the prostate, lung, colorectal and ovarian (PLCO) cancer screening trial. Controlled clinical trials. 2000;21(6 Suppl):349S–55S. doi: 10.1016/s0197-2456(00)00101-x. [DOI] [PubMed] [Google Scholar]
- 18.Calle EE, Rodriguez C, Jacobs EJ, Almon ML, Chao A, McCullough ML, et al. The American Cancer Society Cancer Prevention Study II Nutrition Cohort: rationale, study design, and baseline characteristics. Cancer. 2002;94(9):2490–501. doi: 10.1002/cncr.101970. [DOI] [PubMed] [Google Scholar]
- 19.U.S. Department of Agriculture, U.S. Department of Health and Human Services. Dietary Guidelines for Americans, 2010. Washington, DC: U.S. Government Printing Office; 2010. [Google Scholar]
- 20.Belstrom D, Holmstrup P, Bardow A, Kokaras A, Fiehn NE, Paster BJ. Temporal Stability of the Salivary Microbiota in Oral Health. PloS one. 2016;11(1):e0147472. doi: 10.1371/journal.pone.0147472. [DOI] [PMC free article] [PubMed] [Google Scholar]
- 21.Zhou Y, Gao H, Mihindukulasuriya KA, La Rosa PS, Wylie KM, Vishnivetskaya T, et al. Biogeography of the ecosystems of the healthy human body. Genome biology. 2013;14(1):R1. doi: 10.1186/gb-2013-14-1-r1. [DOI] [PMC free article] [PubMed] [Google Scholar]
- 22.Costello EK, Lauber CL, Hamady M, Fierer N, Gordon JI, Knight R. Bacterial community variation in human body habitats across space and time. Science (New York, NY) 2009;326(5960):1694–7. doi: 10.1126/science.1177486. [DOI] [PMC free article] [PubMed] [Google Scholar]
- 23.Caporaso JG, Kuczynski J, Stombaugh J, Bittinger K, Bushman FD, Costello EK, et al. QIIME allows analysis of high-throughput community sequencing data. Nature methods. 2010;7(5):335–6. doi: 10.1038/nmeth.f.303. [DOI] [PMC free article] [PubMed] [Google Scholar]
- 24.Chen T, Yu WH, Izard J, Baranova OV, Lakshmanan A, Dewhirst FE. The Human Oral Microbiome Database: a web accessible resource for investigating oral microbe taxonomic and genomic information. Database: the journal of biological databases and curation. 2010;2010:baq013. doi: 10.1093/database/baq013. [DOI] [PMC free article] [PubMed] [Google Scholar]
- 25.Price MN, Dehal PS, Arkin AP. FastTree: computing large minimum evolution trees with profiles instead of a distance matrix. Molecular biology and evolution. 2009;26(7):1641–50. doi: 10.1093/molbev/msp077. [DOI] [PMC free article] [PubMed] [Google Scholar]
- 26.Lozupone CA, Hamady M, Kelley ST, Knight R. Quantitative and qualitative beta diversity measures lead to different insights into factors that structure microbial communities. Applied and environmental microbiology. 2007;73(5):1576–85. doi: 10.1128/AEM.01996-06. [DOI] [PMC free article] [PubMed] [Google Scholar]
- 27.van Buuren S, Groothuis-Oudshoorn K. mice: Multivariate Imputation by Chained Equations in R. Journal of Statistical Software. 2011;45(3) [Google Scholar]
- 28.McArdle BH, Anderson MJ. Fitting multivariate models to community data: A comment on distance-based redundancy analysis. Ecology. 2001;82(1):290–97. [Google Scholar]
- 29.Fernandes AD, Reid JNS, Macklaim JM, McMurrough TA, Edgell DR, Gloor GB. Unifying the analysis of high-throughput sequencing datasets: characterizing RNA-seq, 16S rRNA gene sequencing and selective growth experiments by compositional data analysis. Microbiome. 2014;2:15–15. doi: 10.1186/2049-2618-2-15. [DOI] [PMC free article] [PubMed] [Google Scholar]
- 30.Socransky SS, Haffajee AD, Cugini MA, Smith C, Kent RL., Jr Microbial complexes in subgingival plaque. Journal of clinical periodontology. 1998;25(2):134–44. doi: 10.1111/j.1600-051x.1998.tb02419.x. [DOI] [PubMed] [Google Scholar]
- 31.Langille MG, Zaneveld J, Caporaso JG, McDonald D, Knights D, Reyes JA, et al. Predictive functional profiling of microbial communities using 16S rRNA marker gene sequences. Nature biotechnology. 2013;31(9):814–21. doi: 10.1038/nbt.2676. [DOI] [PMC free article] [PubMed] [Google Scholar]
- 32.Kanehisa M, Goto S, Sato Y, Furumichi M, Tanabe M. KEGG for integration and interpretation of large-scale molecular data sets. Nucleic acids research. 2012;40:D109–14. doi: 10.1093/nar/gkr988. Database issue. [DOI] [PMC free article] [PubMed] [Google Scholar]
- 33.Kurtz ZD, Muller CL, Miraldi ER, Littman DR, Blaser MJ, Bonneau RA. Sparse and compositionally robust inference of microbial ecological networks. PLoS Comput Biol. 2015;11(5):e1004226. doi: 10.1371/journal.pcbi.1004226. [DOI] [PMC free article] [PubMed] [Google Scholar]
- 34.Dabu B, Mironiuc-Cureu M, Jardan D, Szmal C, Dumitriu S. Identification of four Treponema species in subgingival samples by nested-PCR and their correlation with clinical diagnosis. Roumanian archives of microbiology and immunology. 2012;71(1):43–7. [PubMed] [Google Scholar]
- 35.Willis SG, Smith KS, Dunn VL, Gapter LA, Riviere KH, Riviere GR. Identification of seven Treponema species in health- and disease-associated dental plaque by nested PCR. Journal of clinical microbiology. 1999;37(3):867–9. doi: 10.1128/jcm.37.3.867-869.1999. [DOI] [PMC free article] [PubMed] [Google Scholar]
- 36.Hiraki A, Matsuo K, Suzuki T, Kawase T, Tajima K. Teeth loss and risk of cancer at 14 common sites in Japanese. Cancer epidemiology, biomarkers & prevention : a publication of the American Association for Cancer Research, cosponsored by the American Society of Preventive Oncology. 2008;17(5):1222–7. doi: 10.1158/1055-9965.EPI-07-2761. [DOI] [PubMed] [Google Scholar]
- 37.Abnet CC, Qiao YL, Mark SD, Dong ZW, Taylor PR, Dawsey SM. Prospective study of tooth loss and incident esophageal and gastric cancers in China. Cancer causes & control: CCC. 2001;12(9):847–54. doi: 10.1023/a:1012290009545. [DOI] [PubMed] [Google Scholar]
- 38.Guha N, Boffetta P, Wunsch Filho V, Eluf Neto J, Shangina O, Zaridze D, et al. Oral health and risk of squamous cell carcinoma of the head and neck and esophagus: results of two multicentric case-control studies. American journal of epidemiology. 2007;166(10):1159–73. doi: 10.1093/aje/kwm193. [DOI] [PubMed] [Google Scholar]
- 39.Gao S, Li S, Ma Z, Liang S, Shan T, Zhang M, et al. Presence of Porphyromonas gingivalis in esophagus and its association with the clinicopathological characteristics and survival in patients with esophageal cancer. Infectious agents and cancer. 2016;11:3. doi: 10.1186/s13027-016-0049-x. [DOI] [PMC free article] [PubMed] [Google Scholar]
- 40.Liu G, Tang CM, Exley RM. Non-pathogenic Neisseria: members of an abundant, multi-habitat, diverse genus. Microbiology. 2015;161(7):1297–312. doi: 10.1099/mic.0.000086. [DOI] [PubMed] [Google Scholar]
- 41.Wu J, Peters BA, Dominianni C, Zhang Y, Pei Z, Yang L, et al. Cigarette smoking and the oral microbiome in a large study of American adults. Isme j. 2016 doi: 10.1038/ismej.2016.37. [DOI] [PMC free article] [PubMed] [Google Scholar]
- 42.Morris A, Beck JM, Schloss PD, Campbell TB, Crothers K, Curtis JL, et al. Comparison of the respiratory microbiome in healthy nonsmokers and smokers. American journal of respiratory and critical care medicine. 2013;187(10):1067–75. doi: 10.1164/rccm.201210-1913OC. [DOI] [PMC free article] [PubMed] [Google Scholar]
- 43.Colman G, Beighton D, Chalk AJ, Wake S. Cigarette smoking and the microbial flora of the mouth. Australian dental journal. 1976;21(2):111–8. doi: 10.1111/j.1834-7819.1976.tb02833.x. [DOI] [PubMed] [Google Scholar]
- 44.Liu RH. Health-promoting components of fruits and vegetables in the diet. Advances in nutrition (Bethesda, Md) 2013;4(3):384s–92s. doi: 10.3945/an.112.003517. [DOI] [PMC free article] [PubMed] [Google Scholar]
- 45.Kubo A, Corley DA. Meta-analysis of antioxidant intake and the risk of esophageal and gastric cardia adenocarcinoma. The American journal of gastroenterology. 2007;102(10):2323–30. doi: 10.1111/j.1572-0241.2007.01374.x. quiz 31. [DOI] [PubMed] [Google Scholar]
- 46.Dutta SK, Agrawal K, Girotra M, Fleisher AS, Motevalli M, Mah’moud MA, et al. Barrett’s esophagus and beta-carotene therapy: symptomatic improvement in GERD and enhanced HSP70 expression in esophageal mucosa. Asian Pacific journal of cancer prevention : APJCP. 2012;13(12):6011–6. doi: 10.7314/apjcp.2012.13.12.6011. [DOI] [PubMed] [Google Scholar]
- 47.Huang X. Iron overload and its association with cancer risk in humans: evidence for iron as a carcinogenic metal. Mutation research. 2003;533(1–2):153–71. doi: 10.1016/j.mrfmmm.2003.08.023. [DOI] [PubMed] [Google Scholar]
- 48.Keeler BD, Brookes MJ. Iron chelation: a potential therapeutic strategy in oesophageal cancer. British journal of pharmacology. 2013;168(6):1313–5. doi: 10.1111/bph.12093. [DOI] [PMC free article] [PubMed] [Google Scholar]
- 49.Ganz T, Nemeth E. Iron homeostasis in host defence and inflammation. Nature reviews Immunology. 2015;15(8):500–10. doi: 10.1038/nri3863. [DOI] [PMC free article] [PubMed] [Google Scholar]
- 50.Freedberg DE, Lebwohl B, Abrams JA. The impact of proton pump inhibitors on the human gastrointestinal microbiome. Clinics in laboratory medicine. 2014;34(4):771–85. doi: 10.1016/j.cll.2014.08.008. [DOI] [PMC free article] [PubMed] [Google Scholar]
- 51.Abeles SR, Jones MB, Santiago-Rodriguez TM, Ly M, Klitgord N, Yooseph S, et al. Microbial diversity in individuals and their household contacts following typical antibiotic courses. Microbiome. 2016;4(1):39. doi: 10.1186/s40168-016-0187-9. [DOI] [PMC free article] [PubMed] [Google Scholar]
Associated Data
This section collects any data citations, data availability statements, or supplementary materials included in this article.