

Abstract
Methods for genetic risk prediction have been widely investigated in recent years. However, most available training data involves European samples, and it is currently unclear how to accurately predict disease risk in other populations. Previous studies have used either training data from European samples in large sample size or training data from the target population in small sample size, but not both. Here, we introduce a multi-ethnic polygenic risk score that combines training data from European samples and training data from the target population. We applied this approach to predict type 2 diabetes (T2D) in a Latino cohort using both publicly available European summary statistics in large sample size (Neff=40k) and Latino training data in small sample size (Neff=8k). Here, we attained a >70% relative improvement in prediction accuracy (from R2=0.027 to R2=0.047) compared to methods that use only one source of training data, consistent with large relative improvements in simulations. We observed a systematically lower load of T2D risk alleles in Latino individuals with more European ancestry, which could be explained by polygenic selection in ancestral European and/or Native American populations. We predict T2D in a South Asian UK Biobank cohort using European (Neff=40k) and South Asian (Neff=16k) training data and attained a >70% relative improvement in prediction accuracy, and application to predict height in an African UK Biobank cohort using European (N=113k) and African (N=2k) training data attained a 30% relative improvement. Our work reduces the gap in polygenic risk prediction accuracy between European and non-European target populations.
Keywords: genome-wide association study, polygenic prediction, height, type 2 diabetes
Introduction
Genetic risk prediction is an important and widely investigated topic because of its potential clinical application as well as its application to better understand the genetic architecture of complex traits (Chatterjee, Shi, & García-Closas, 2016). Many polygenic risk prediction methods have been developed and applied to complex traits. These include polygenic risk scores (PRS)(Chatterjee et al., 2013; Dudbridge, 2013; International Schizophrenia Consortium et al., 2009; Palla & Dudbridge, 2015; Shah et al., 2015; Shi et al., 2016; Stahl et al., 2012; Vilhjálmsson et al., 2015), which use summary association statistics as training data, and Best Linear Unbiased Predictor (BLUP) methods and their extensions (de los Campos, Gianola, & Allison, 2010; Golan & Rosset, 2014; Maier et al., 2015; Moser et al., 2015; Speed & Balding, 2014; Tucker et al., 2015; Weissbrod, Geiger, & Rosset, 2016; Zhou, Carbonetto, & Stephens, 2013), which require individual-level genotype and phenotype data.
However, all of these methods are inadequate for polygenic risk prediction in non-European populations, because they consider training data from only a single population. Existing training data sets have much larger sample sizes in European populations, but the use of European training data for polygenic risk prediction in non-European populations reduces prediction accuracy, due to different patterns of linkage disequilibrium (LD) (or potentially due to different causal effects) (International Schizophrenia Consortium et al., 2009; Rosenberg et al., 2010; Scutari, Mackay, & Balding, 2016; Vilhjálmsson et al., 2015). For example, ref. (Vilhjálmsson et al., 2015) reported a relative decrease of 53-89% in schizophrenia risk prediction accuracy in Japanese and African-American populations compared to Europeans when applying PRS methods using European training data. An alternative is to use training data from the same population as the target population, but this would generally imply a much lower sample size, reducing prediction accuracy.
To tackle this problem, we developed an approach that combines PRS based on European training data with PRS based on training data from the target population. The method takes advantage of both the accuracy that can be achieved with large training samples (Chatterjee et al., 2013; Dudbridge, 2013) and the accuracy that can be achieved with training data containing the same LD patterns as the target population. In application to predict type 2 diabetes (T2D) in Latino target samples in the SIGMA T2D data set (SIGMA Type 2 Diabetes Consortium et al., 2014), we attained a >70% relative improvement in prediction accuracy (from R2=0.027 to R2=0.047) compared to methods that use only one source of training data. We attained similar relative improvements in simulations. We also obtained a >70% relative improvement in an analysis to predict T2D in a South Asian UK Biobank cohort, and a 30% relative improvement in an analysis to predict height in an African UK Biobank cohort.
Materials and Methods
Polygenic risk score using a single training population
Polygenic risk scores are constructed using SNP effect sizes estimated from genome-wide association studies, which perform marginal regression of the phenotype of interest on each SNP in turn. Explicitly, for continuous traits, we estimate effect sizes (where i = 1,…,M indexes genetic markers) using the model y = b0 + bigi + bPCPC + ε, where gi denotes genotypes at marker i, PC denotes one or more principal components used to adjust for ancestry, and ε denotes environmental noise. For binary traits, we use the analogous logistic model logit[P(y=1) ] = b0 + bigi + bPCPC + ε.
Given a vector of estimated effect sizes from a genome-wide association study performed on a set of training samples, the polygenic risk score (International Schizophrenia Consortium et al., 2009) (PRS) for a target individual with genotypes gi is defined as . In practice, rather than computing the PRS using estimated effect sizes for all available genetic markers, the PRS is computed on a subset of genetic markers obtained via informed LD-pruning (Stahl et al., 2012) (also known as LD-clumping) followed by P-value thres holding (International Schizophrenia Consortium et al., 2009). Specifically, this “pruning + thres holding” strategy has two parameters, RLD2 and PT, and proceeds as follows. First, we prune the SNPs based on a pair wise threshold RLD2, removing the less significant SNP in each pair (using PLINK; see Web Resources). Second, we restrict to SNPs with an association P-value below the significance threshold PT.
The parameters RLD2 and PT are commonly tuned using on validation data to optimize prediction accuracy (International Schizophrenia Consortium et al., 2009; Stahl et al., 2012). While in theory this procedure is susceptible to over fitting, in practice, validation sample sizes are typically large, and RLD2 and PT are selected from a small discrete set of parameter choices, so over fitting is considered to have a negligible effect. Accordingly, in this work, we consider RLD2 ∈ {0.1, 0.2, 0.5, 0.8} and PT ∈ {1.0, 0.8, 0.5, 0.4, 0.3, 0.2, 0.1, 0.08, 0.05, 0.02, 0.01, 10−3, 10−4, 10−5, 10−6, 10−7, 10−8}, and we always report results corresponding to the best choices of these parameters. In all of our primary analyses involving two training populations (see below), values of RLD2 and PT were optimized based only on PRS in a single training population, to ensure that PRS using two training populations did not gain any relative advantage from the optimization of these parameters.
In this work, we specifically consider PRS built using European (EUR), Latino (LAT), South Asian (SAS), or African (AFR) training samples. We use the notation PRSEUR to denote PRS built using European samples, and analogously for the other populations.
Polygenic risk score using two training populations
Given a pair of polygenic risk scores computed as above using two distinct training populations, we define the multi-ethnic PRS with mixing weights α1 and α2 as the linear combination of the two PRS with these weights: e.g., for EUR and LAT, we define PRSEUR+LAT = α1PRSEUR + α2PRSLAT. We employ two different approaches to avoid overfitting. In our primary analyses, we estimate mixing weights α1 and α2 using validation data and compute adjusted R2 to account for the additional degree of freedom. In our secondary analyses, we estimate mixing weights α1 and α2 using cross-validation (see Assessment of methods below).
For comparison purposes in analyses of real phenotypes, we also evaluated a meta-analysis PRS (e.g. EUR-LAT-meta) using a sample size weighted average of estimated effect sizes in each population (Zeggini et al., 2008); for dichotomous phenotypes we weighted by effective sample size Neff=4/(1/Ncase+1/Ncontrol). We performed LD-pruning and P-value thresholding using P-values obtained from the meta-analysis, using the LD reference panel from the population that achieved the highest prediction accuracy.
Polygenic risk score using one or two training populations and genetic ancestry
We further define polygenic risk scores that include an ancestry predictor, namely, the top principal component in a given data set, computed using the union of all available (training and validation) samples from that population. (We considered only the top PC in each data set that we analyzed, because lower PCs had a squared correlation with phenotype lower than 0.005 in each case; we recommend that ancestry predictors restrict to PCs with squared correlation with phenotype of 0.005 or larger.) We define a polygenic risk score LAT+ANC with mixing weights α1 and α2 as PRSLAT+ANC = α1PRSLAT + α2 PC, and we define a polygenic risk score EUR+LAT+ANC with mixing weights α1, α2 and α3 as PRSEUR+LAT+ANC = α1PRSEUR + α2PRSLAT + α3PC. As above, we employ two different approaches to avoid overfitting: in our primary analyses, we estimate mixing weights using validation data and compute adjusted R2; in our secondary analyses, we estimate mixing weights using cross-validation.
Assessment of methods
We assessed the accuracy of polygenic risk scores in validation samples (independent from samples used to estimate effect sizes). We used adjusted R2 as the accuracy metric for continuous traits and liability-scale adjusted R2 (ref. (Lee, Goddard, Wray, & Visscher, 2012)) for binary traits. Adjusted R2 is defined as , where p ∊ {1,2,3} is the number of PRS or ANC components in the mixture, n is the number of validation samples, and is the raw (unadjusted) R2. The adjusted R2 metric roughly corrects for increased model complexity in multi-component PRS, so in our primary analyses, we report accuracy as adjusted R2 using best-fit mixing weights estimated using the validation data.
To verify that this metric provides robust model comparisons, we also performed auxiliary analyses in which we used 10-fold cross-validation: specifically, for each left-out fold in turn, we estimated mixing weights using the other 9 folds and evaluated adjusted R2 for PRS computed using these weights on the left-out fold. We then computed average adjusted R2 across the 10 folds. (When analyzing data from an unbalanced case-control study with #cases ≪ #controls, we used stratified 10-fold cross-validation, selecting the folds such that each fold had the same case-control ratio; this applies only to the South Asian UK Biobank T2D analysis.)
Finally, for analyses in which we needed to use samples from the same cohort for both building PRS (i.e., estimating effect sizes ) and validation, we also used cross-validation. In our primary analyses, we employed 10-fold cross-validation, using 90% of the cohort to estimate and the remaining 10% of the cohort to validate predictions (using the adjusted R2 metric with best-fit mixture weights ). In our secondary analyses, we employed 10×9-fold cross-validation, in which 90% of the cohort was used to estimate both and and the remaining 10% of the cohort was used to validate predictions. To estimate , we iteratively split the 90% set of training samples into an 80% training-training set and a 10% training-test set; we estimated in the 80% training-training set and computed a PRS for the 10% training-test set for each of the 9 training-test folds, and we then performed a single regression of phenotype against each PRS across the entire 90% set of training samples to estimate . Finally, we re-estimated for the final test prediction using the entire 90% set of training samples.
Simulations
We simulated quantitative phenotypes using real genotypes from European (WTCCC2) and Latino (SIGMA) data sets (see below). We fixed the proportion of causal markers at 1% and fixed SNP-heritability hg2 at 0.5, and sampled normalized effect sizes βi from a normal distribution with variance equal to hg2 divided by the number of causal markers. We calculated per-allele effect sizes bi as , where pi is the minor allele frequency of SNP i in the European data set. We simulated phenotypes as , where 𝜀j ∼ N(0, 1- hg2).
In our primary simulations, we discarded the causal SNPs and used only the non-causal SNPs as input to the prediction methods (i.e. we simulated untyped causal SNPs, which we believe to be realistic). As an alternative, we also considered simulations in which we included the causal SNPs as input to the prediction methods (i.e., a scenario in which causal SNPs are typed). We performed simulations using all available European (WTCCC2) and Latino (SIGMA) training data (approximately a 2:1 ratio). We also performed simulations using training data in which Europeans were subsampled to attain a 1:1 ratio, as the relative performance of different methods may depend on relative training sample sizes; we considered different training sample sizes rather than different validation sample sizes, because the validation sample size does not (in expectation) impact the prediction accuracy.
We also performed simulations in which Latino phenotypes were explicitly correlated to ancestry (population stratification). In these simulations, we added a constant multiple of PC1 (representing European vs. Native American ancestry, with positive values representing higher European ancestry) to the Latino phenotypes such that the correlation between phenotype and PC1 was equal to −0.11, which is the correlation between the T2D phenotype and PC1 in the SIGMA data set.
We performed simulations under 4 different scenarios: (i) using all chromosomes, (ii) using chromosomes 1-4, (iii) using chromosomes 1-2, and (iv) using chromosome 1 only. The motivation for performing simulations with a subset of chromosomes was to increase N/M, extrapolating to performance at larger sample sizes, as in previous work (Vilhjálmsson et al., 2015).
Simulation data sets: WTCCC2 and SIGMA
Our simulations used real genotypes from the WTCCC2 and SIGMA data sets (rows 1-2 of Table 1). The WTCCC2 data set consists of 15,622 unrelated European samples from a multiple sclerosis study genotyped at 360,557 SNPs after QC (Sawcer et al., 2011; Yang, Zaitlen, Goddard, Visscher, & Price, 2014) (see Web Resources). The SIGMA data set consists of 8,214 unrelated Latino samples genotyped at 2,440,134 SNPs after QC (SIGMA Type 2 Diabetes Consortium et al., 2014) (see Web Resources). We restricted our simulations to 232,629 SNPs present in both data sets (with matched reference and variant alleles) after removing A/T and C/G SNPs to eliminate potential strand ambiguity.
Table 1. List of data sets used in simulations and analyses of real phenotypes.
| Target population | Trait | European training | Target population training | Target population validation | Validation procedure (primary) | Validation procedure (secondary) |
|---|---|---|---|---|---|---|
| Latino | 2:1 Simulations | WTCCC2 (N=15,622) | SIGMA (N=7,393*) | SIGMA (N=8,214**) | 10-fold cross validation | NA |
| Latino | 1:1 Simulations | WTCCC2 (N=7,393) | SIGMA (N=7,393*) | SIGMA (N=8,214**) | 10-fold cross validation | NA |
| Latino | T2D | DIAGRAM (Neff=40,101) | SIGMA (Neff=7,363*) | SIGMA (Neff=8,181**) | 10-fold cross validation | 10×9-fold cross-validation |
| Latino | T2D | UK Biobank (Neff=19,842) | SIGMA (Neff=7,363*) | SIGMA (Neff=8,181**) | 10-fold cross validation | NA |
| South Asian | T2D | DIAGRAM (Neff=40,101) | SAT2D (Neff=16,065) | UK Biobank (Neff=919) | In-sample fit | 10-fold cross validation |
| African | Height | UK Biobank (N=113,660) | N'Diaye et al. (N=20,427) | UK Biobank (N=1,745) | In-sample fit | 10-fold cross validation |
We list the training and validation data sets and validation procedures used in simulations (rows 1-2), predicting T2D in Latinos (rows 3-4), predicting T2D in South Asians (row 5) and predicting height in Africans (row 6). N refers to sample size (continuous traits), Neff refers to effective sample size 4/(1/Ncase+1/Ncontrol) (dichotomous traits).
sample size in each training fold.
sample size in union of validation folds.
Training and validation data sets for predicting type 2 diabetes in Latinos: DIAGRAM, SIGMA and UK Biobank
Our analyses of type 2 diabetes in Latinos used summary association statistics from the DIAGRAM data set and genotypes and phenotypes from the SIGMA data set (row 3 of Table 1). The DIAGRAM data set consists of 12,171 cases and 56,862 controls of European ancestry for which summary association statistics at 2,473,441 imputed SNPs are publicly available (see Web Resources) (Morris et al., 2012). As noted above, the SIGMA data set consists of 8,214 unrelated Latino samples (3,848 type 2 diabetes cases and 4,366 controls) genotyped at 2,440,134 SNPs after QC. QC procedures are reported in (SIGMA Type 2 Diabetes Consortium et al., 2014), and include the removal of one individual from each pair of relatives with relatedness greater than 10% (n=532), as well as a PCA analysis using EIGENSTRAT (Price et al., 2006) (see Web Resources) to identify and remove samples with evidence of high African or East Asian ancestry (n=181).
SIGMA association statistics were computed with adjustment for 2 PCs, as in ref. (SIGMA Type 2 Diabetes Consortium et al., 2014). We restricted our analyses of type 2 diabetes to 776,374 SNPs present in both data sets (with matched reference and variant alleles) after removing A/T and C/G SNPs to eliminate potential strand ambiguity. For the SIGMA data set, we used the top 2 PCs as computed in ref. (SIGMA Type 2 Diabetes Consortium et al., 2014). We also performed an analysis of type 2 diabetes using imputed genotypes from the SIGMA T2D data set (SIGMA Type 2 Diabetes Consortium et al., 2014), restricting to 2,062,617 SNPs present in both data sets (with matched reference and variant alleles) after removing A/T and C/G SNPs to eliminate potential strand ambiguity.
We performed a secondary analysis using 113,851 British samples from UK Biobank (Galinsky, Loh, Mallick, Patterson, & Price, 2016) (see Web Resources) as European training data (5,198 type 2 diabetes cases and 108,653 controls) (row 4 of Table 1). UK Biobank association statistics were computed with adjustment for 10 PCs (Galinsky, Loh, et al., 2016), estimated using FastPCA (Galinsky, Bhatia, et al., 2016) (see Web Resources). We computed summary statistics for 608,878 genotyped SNPs from UK Biobank after removing A/T and C/G SNPs to eliminate potential strand ambiguity. We analyzed 187,142 SNPs present in the SIGMA and UK Biobank data sets. We defined type 2 diabetes cases in UK Biobank as “any diabetes” with “age of diagnosis > 30”. We note that the p-values at two top type 1 diabetes (T1D) loci (rs2476601, rs9268645) were only nominally significant (p∼0.05) for this T2D phenotype, indicating low contamination with T1D cases.
Training and validation data sets for predicting type 2 diabetes in South Asians: DIAGRAM, SAT2D and UK Biobank
Our analysis of type 2 diabetes in South Asians used European summary association statistics from the DIAGRAM data set (described above), South Asian summary statistics data from the South Asian Type 2 Diabetes (SAT2D) Consortium (Kooner et al., 2011), and South Asian genotypes and phenotypes from UK Biobank (see Web Resources) as test data (row 5 of Table 1). The SAT2D data set consists of 5,561 South Asian type 2 diabetes cases and 14,458 South Asian controls for which we summary statistics for 2,646,472 imputed SNPs were available. The UK Biobank test data consists of 1,756 unrelated samples of South Asian ancestry (272 type 2 diabetes cases and 1,484 controls), genotyped at 608,878 SNPs after QC, with the following self-reported ethnicity distribution: 52 Bangladeshi, 1,301 Indian and 403 Pakistani. We removed one individual from each pair of relatives with relatedness greater than 20% (n=30). We performed a PCA analysis using EIGENSTRAT (Price et al., 2006) (see Web Resources) to identify and remove genetic outliers, but did not identify any outliers. We analyzed 208,400 SNPs present in the DIAGRAM, SAT2D and UK Biobank data sets after removing A/T and C/G SNPs to eliminate potential strand ambiguity.
Training and validation data sets for predicting height in Africans: UK Biobank and N'Diaye et al
Our analyses of height in Africans used European summary association statistics from UK Biobank (see Web Resources), African summary statistics from N'Diaye et al. (N'Diaye et al., 2011) and African genotypes and phenotypes from UK Biobank (row 6 of Table 1). European summary statistics from UK Biobank were computed using 113,660 British samples for which height phenotypes were available with adjustment for 10 PCs (Galinsky, Loh, et al., 2016), estimated using FastPCA (Galinsky, Bhatia, et al., 2016) (see Web Resources). The N'Diaye et al. (N'Diaye et al., 2011) data set consists of 20,427 samples of African ancestry with summary association statistics at 3,254,125 imputed SNPs. The UK Biobank data set consists of 1,745 unrelated samples of African ancestry, genotyped at 608,878 SNPs after QC, with the following self-reported ethnicity distribution: 743 African, 1,002 Caribbean. We removed one individual from each pair of relatives with relatedness greater than 20% (n=32). We performed a PCA analysis using EIGENSTRAT (Price et al., 2006) (see Web Resources) to identify and remove genetic outliers, but did not identify any outliers. We restricted our analysis to 232,182 SNPs present in the UK Biobank and N'Diaye et al. data sets after removing A/T and C/G SNPs to eliminate potential strand ambiguity.
Results
Simulations
We performed simulations using real genotypes and simulated phenotypes (row 1 of Table 1). We simulated continuous phenotypes under a non-infinitesimal model with 1% of markers chosen to be causal with the same effect size in all samples and SNP-heritability hg2 = 0.5 (see Methods); we report the average adjusted R2 and standard errors over 100 simulations. We used WTCCC2 (Sawcer et al., 2011; Yang et al., 2014) data (15,622 samples after QC; see Methods) as the European training data, and the SIGMA data (SIGMA Type 2 Diabetes Consortium et al., 2014) (8,214 samples) as the Latino training and validation data (with 10-fold cross-validation). We simulated phenotypes using the 232,629 SNPs present in both data sets and built predictions from these SNPs excluding the causal SNPs, modeling the causal SNPs as untyped (see Methods).
Prediction accuracies (adjusted R2) and optimal weights for the 5 main methods (EUR, LAT, LAT+ANC, EUR+LAT, EUR+LAT+ANC) are reported in Table 2A. In each case, the best prediction accuracy was attained using LD-pruning threshold RLD2=0.8 (results using different LD-pruning thresholds are reported in S1 Table); the median value of the optimal P-value threshold PT was equal to 0.01 for EUR and 0.05 for LAT. On average, the EUR method performed only 23% better than the LAT method, despite having twice as much training data. This reflects a tradeoff between the larger training sample size for EUR and the target-matched LD patterns for LAT. EUR+LAT attained 64%-101% relative improvements vs. EUR and LAT respectively (and used a slightly larger weight for EUR than for LAT), highlighting the advantages of incorporating multiple sources of training data. When including an ancestry predictor, EUR+LAT+ANC attained a 10% relative improvement vs. EUR+LAT (≥80% relative improvement vs. EUR or LAT), reflecting small genetic effects of ancestry on phenotype that can arise from random genetic drift between populations at causal markers (which is better-captured by ancestry components than by SNPs used in a PRS).
Table 2. Accuracy of main prediction methods in simulations.
| A) | Model | Average weight (s.e.) associated to each predictor | Average adj. R2 (s.e.) | |
|---|---|---|---|---|
| European PRS | Latino PRS | |||
| EUR | 0.19449 (0.004) | 0.03927 (0.002) | ||
| LAT | 0.17780 (0.003) | 0.03200 (0.001) | ||
| LAT+ANC | 0.17613 (0.002) | 0.04115 (0.002) | ||
| EUR+LAT | 0.17847 (0.004) | 0.15784 (0.003) | 0.06441 (0.002) | |
| EUR+LAT+ANC | 0.19098 (0.004) | 0.15578 (0.002) | 0.07053 (0.002) | |
| B) | Model | Average weight (s.e.) associated to each predictor | Average adj. R2 (s.e.) | |
| European PRS | Latino PRS | |||
| EUR | 0.08715 (0.007) | 0.01156 (0.001) | ||
| LAT | 0.18239 (0.003) | 0.03391 (0.001) | ||
| LAT+ANC | 0.17815 (0.002) | 0.04202 (0.002) | ||
| EUR+LAT | 0.07494 (0.008) | 0.17485 (0.002) | 0.04211 (0.001) | |
| EUR+LAT+ANC | 0.09070 (0.005) | 0.17464 (0.002) | 0.04751 (0.002) | |
We report results for A) 2:1 training sample size ratio (row 1 of Table 1) and B) 1:1 training sample size ratio (row 2 of Table 1). We report average adjusted R2 over 100 simulations for each of the 5 main prediction methods. We also report normalized weights, defined as the mixing weight (see Methods) multiplied by the standard deviation of the PRS.
For comparison purposes, we also performed simulations using training data in which Europeans were subsampled to attain a 1:1 ratio (row 2 of Table 1); prediction accuracies and optimal weights for the 5 main methods are reported in Table 2B. On average, the LAT method performed 190% better than the EUR method, again demonstrating the advantages of target-matched LD patterns. EUR+LAT attained 24%-260% relative improvements vs. LAT and EUR respectively (and used a larger weight for LAT than for EUR), again highlighting the advantages of incorporating multiple sources of training data.
Predictions using Latino effect sizes that were not adjusted for genetic ancestry (LATunadj, EUR+LATunadj, EUR+LATunadj+ANC, as compared to LAT, EUR+LAT, EUR+LAT+ANC) were much less accurate (S2 Table), as in previous work (C.-Y. Chen, Han, Hunter, Kraft, & Price, 2015); this is consistent with the fact that LATunadj predictions were dominated by genetic ancestry (adjusted R2 = 0.37; S3 Table). We also observed a modest correlation (adjusted R2 = 0.025) between the EUR prediction and genetic ancestry (S3 Table), again reflecting small genetic effects of ancestry on phenotype that can arise from random genetic drift between populations at causal markers. The relative performance of the different prediction methods was similar in simulations in which phenotypes explicitly contained an ancestry term, representing environmentally-driven stratification (S4 Table).
We extrapolated the results in Table 2 to larger sample sizes by limiting the simulations to subsets of chromosomes, as in previous work (Vilhjálmsson et al., 2015) (Fig 1 and S5 Table). EUR+LAT+ANC was the best performing method in each of these experiments. We also performed simulations using predictions constructed using all SNPs including the causal SNPs (S1 Fig and S6 Table). In these experiments, EUR+LAT+ANC was once again the best performing method, and EUR performed much better than LAT, consistent with the larger training sample size for EUR and the fact that differential tagging of causal SNPs is of reduced importance when causal SNPs are typed.
Fig 1. Accuracy of main prediction methods in simulations using subsets of chromosomes.
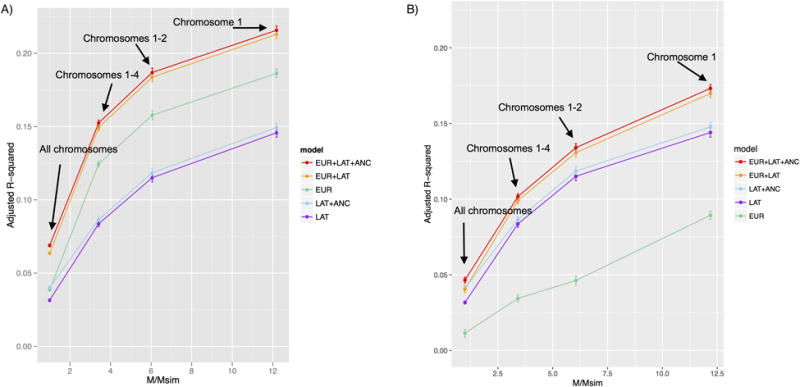
We report results for A) 2:1 training sample size ratio (row 1 of Table 1) and B) 1:1 training sample size ratio (row 2 of Table 1). We report prediction accuracies for each of the 5 main prediction methods as a function of M/Msim, where M=232,629 is the total number of SNPs and Msim is the actual number of SNPS used in each simulation: 232,629 (all chromosomes), 68,188 (chromosomes 1-4), 38,412 (chromosomes 1-2), and 19,087 (chromosome 1). Numerical results are provided in S5 Table.
Analyses of type 2 diabetes in Latinos
We applied the same methods to predict T2D in Latino target samples from the SIGMA T2D data set (row 3 of Table 1). We used publicly available European summary statistics from DIAGRAM(Morris et al., 2012) (12,171 cases and 56,862 controls; effective sample size = 4/(1/Ncase + 1/Ncontrol) = 40,101) as European training data and SIGMA T2D genotypes and phenotypes (SIGMA Type 2 Diabetes Consortium et al., 2014) (3,848 cases and 4,366 controls; effective sample size = 8,181) as Latino training and validation data, employing 10-fold cross-validation.
Prediction accuracies (adjusted R2 on the liability scale (Lee et al., 2012), assuming 8% prevalence (Stahl et al., 2012)) and optimal weights for the 5 main methods (EUR, LAT, LAT+ANC, EUR+LAT, EUR+LAT+ANC) are reported in Table 3 (other prediction metrics are reported in S7 Table). In each case, the best prediction accuracy was obtained using LD-pruning threshold RLD2=0.8 (results using different LD-pruning thresholds are reported in S8 Table); the value of the optimal P-value threshold PT was equal to 0.05 for EUR and 0.2 for LAT. EUR performed only 33% better than LAT despite the much larger training sample size, again reflecting a tradeoff between sample size and target-matched LD patterns. EUR+LAT attained 75%-133% relative improvements vs. EUR and LAT respectively (and used a slightly larger weight for EUR than for LAT), again highlighting the advantages of incorporating multiple sources of training data. We also evaluated a meta-analysis PRS (EUR-LAT-meta) and determined that EUR+LAT attained a 19% relative improvement vs. EUR-LAT-meta (Table 3; also see S2 Fig), highlighting the advantages of optimizing mixing weights distinct from meta-analysis weights. Although adding an ancestry predictor to LAT produced a substantial improvement (LAT+ANC vs. LAT), adding an ancestry predictor to EUR+LAT produced an insignificant change in accuracy for EUR+LAT+ANC compared to EUR+LAT; this can be explained by the large negative correlation between the European PRS (EUR) and the proportion of European ancestry within Latino samples (R = -0.75; S9 Table), such that any predictor that includes EUR already includes effects of genetic ancestry. This correlation is far larger than analogous correlations due to random genetic drift in our simulations (S3 Table), suggesting that this systematically lower load of T2D risk alleles in Latino individuals with more European ancestry could be due to polygenic selection (Robinson et al., 2015; Turchin et al., 2012) in ancestral European and/or Native American populations; previous studies using top GWAS-associated SNPs have also reported continental differences in genetic risk for T2D (R. Chen et al., 2012; Corona et al., 2013). We observed a similar correlation (R=−0.77) when using British UK Biobank type 2 diabetes samples as European training data (row 4 of Table 1; see Methods), confirming that this negative correlation is not caused by population stratification in DIAGRAM. As in our simulations, predictions using Latino effect sizes that were not adjusted for genetic ancestry (LATunadj, EUR+LATunadj, EUR+LATunadj+ANC, as compared to LAT, EUR+LAT, EUR+LAT+ANC) were much less accurate (S10 Table), consistent with the fact that these predictions were dominated by genetic ancestry (S9 Table). We also computed predictions for each method using imputed SNPs from the SIGMA T2D data set; this did not improve prediction accuracy, but predicting using two training populations still achieved the highest accuracy (S11 Table).
Table 3. Accuracy of main prediction methods in analyses of type 2 diabetes in a Latino cohort.
| Model | Weights associated to each predictor | Adjusted R2 | P-value for improvement over simpler model | |
|---|---|---|---|---|
| European PRS | Latino PRS | |||
| EUR | 0.16490 | 0.02700 | <10−49 | |
| LAT | 0.14332 | 0.02030 | <10−37 | |
| LAT+ANC | 0.14623 | 0.03362 | <10−24 | |
| EUR+LAT | 0.16344 | 0.14164 | 0.04735 | <10−37 |
| EUR+LAT+ANC | 0.17629 | 0.14108 | 0.04736 | 0.3 |
| EUR-LAT-meta | 0.16404 | 0.03012 | 0.03770 | NA |
We report adjusted R2 on the liability scale for each of the 5 main prediction methods, as well as EUR-LAT-meta. We obtained similar relative results using NagelkerkeR2, R2 on the observed scale and AUC (S7 Table). P-values are from likelihood ratio tests comparing models EUR and LAT to the null model, model LAT+ANC to LAT, model EUR+LAT to EUR, and EUR+LAT+ANC to EUR+LAT. For the EUR model we used RLD2=0.8 and PT=0.05, for LAT we used RLD2=0.8 and PT=0.2, and for EUR-LAT-metawe used RLD2=0.8 and PT=1. We also report normalized weights, defined as the mixing weight (see Methods) multiplied by the standard deviation of the PRS.
We investigated how the prediction accuracy of each method varied as a function of P-value thresholds, by varying either the EUR P-value threshold (Fig 2A and S12A Table) or the LAT P-value threshold (Fig 2B and S12B Table) between 10-8 and 1. In both cases, permissive P-value thresholds performed best, reflecting the relatively small sample sizes analyzed. However, the prediction accuracy of EUR+LAT+ANC was relatively stable, with prediction adjusted R2 > 0.037 across all EUR P-value thresholds (Fig 2A) and adjusted R2 > 0.033 across all LAT P-value thresholds (Fig 2B). In Fig 2A, we observe that as the EUR P-value threshold becomes more stringent, the difference in prediction accuracy between EUR+LAT+ANC and EUR+LAT increases, because EUR is less able to capture polygenic ancestry effects (see above).
Fig 2. Accuracy of main prediction methods in analyses of type 2 diabetes in a Latino cohort as a function of P-value thresholds.
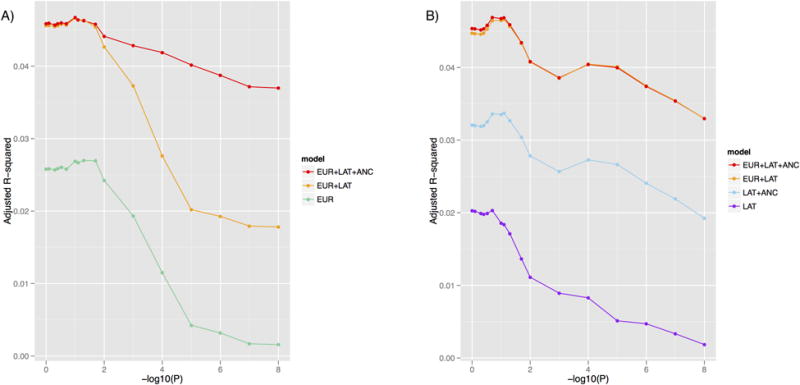
We report prediction accuracies for each of the 5 main prediction methods as a function of (A) EUR P-value threshold, where applicable (with optimized LAT P-value threshold, where applicable) and (B) LAT P-value threshold, where applicable (with optimized EUR P-value threshold, where applicable). Numerical results are provided in S12a Table and S12b Table.
In the above results (Table 3 and Fig 2), we allowed each prediction method to optimize its mixing weights via an in-sample fit in the target sample. This procedure could in principle be susceptible to overfitting (Kooperberg, LeBlanc, & Obenchain, 2010; Wray et al., 2013). We did not expect overfitting to be a concern given the small number of mixing weights optimized (at most 3) relative to the target sample size (8,181) and given our use of adjusted R2 as the evaluation metric, but to verify this expectation, we repeated our analyses using 10x9-fold cross-validation (see Methods). Methods that use two training populations remained much more accurate than single ancestry methods, as prediction accuracy decreased only very slightly (2-4% relative decrease vs. Table 3) for each method (S13 Table). These slight decreases are expected, since mixing weights optimized within 10x9 cross-validation are slightly suboptimal (due to reduced training data) and prediction accuracy is mildly sensitive to the choice of mixing weights (S2 Fig).
Analyses of type 2 diabetes in South Asians
We applied the same methods to predict T2D in South Asian target samples from the UK Biobank (row 5 of Table 1). We used publicly available European summary statistics from DIAGRAM (12,171 cases and 56,862 controls; effective sample size = 40,101) as European training data, South Asian summary statistics from SAT2D (Kooner et al., 2011) (5,561 cases and 14,458 controls; effective sample size = 16,065) as South Asian training data, and UK Biobank genotypes and phenotypes (272 cases and 1,484 controls; effective sample size = 919) as South Asian validation data (see Methods).
Prediction accuracies (adjusted R2 on the liability scale (Lee et al., 2012), assuming sample prevalence 15%) and optimal weights for the 5 main methods (EUR, SAS, SAS+ANC, SAS+LAT, EUR+SAS+ANC) are reported in Table 4 (other prediction metrics are reported in S14 Table). In each case, the best prediction accuracy was obtained using LD-pruning threshold RLD2=0.8 (results using different LD-pruning thresholds are reported in S15 Table); the value of the optimal P-value threshold PT was equal to 10-3 for EUR and 0.8 for SAS. EUR performed only 14% better than SAS despite the larger training sample size, again reflecting a tradeoff between sample size and target-matched LD patterns. EUR+SAS attained 72%-95% relative improvements vs. EUR and SAS respectively (and used a slightly larger weight for EUR than for SAS). In addition, EUR+SAS attained a 44% relative improvement vs. EUR-SAS-meta (Table 4), again highlighting the advantages of optimizing mixing weights distinct from meta-analysis weights. Adding an ancestry predictor to EUR+SAS produced an insignificant change in accuracy for EUR+ SAS +ANC compared to EUR+SAS; we note a modest correlation between each prediction method and the proportion of European-related ancestry (Reich, Thangaraj, Patterson, Price, & Singh, 2009) within South Asian samples (see S16 Table). We repeated our analyses using stratified 10-fold cross-validation to estimate mixing weights (see Methods). We observed that methods that use two training populations continued to substantially outperform PRS using a single training population despite a decrease in prediction adjusted R2 (vs. Table 4) for each method, consistent with the limited sample size for estimating mixing weights (S17 Table).
Table 4. Accuracy of main prediction methods in analyses of type 2 diabetes in a South Asian cohort.
| Model | Weights associated to each predictor | Adjusted R2 | P-value for improvement over simpler model | |
|---|---|---|---|---|
| European PRS | Latino PRS | |||
| EUR | 0.09001 | 0.01767 | <10-3 | |
| SAS | 0.08488 | 0.01556 | <10-3 | |
| SAS+ANC | 0.08821 | 0.01572 | 0.28 | |
| EUR+SAS | 0.08309 | 0.07746 | 0.03031 | <10-2 |
| EUR+SAS+ANC | 0.08138 | 0.07989 | 0.02968 | 0.46 |
| EUR-SAS-meta | 0.08695 | 0.00497 | 0.02098 | NA |
We report adjusted R2 on the liability scale for each of the 5 main prediction methods, as well as EUR-SAS-meta. We obtained similar relative results using NagelkerkeR2, R2 on the observed scale and AUC (S14 Table). P-values are from likelihood ratio tests comparing models EUR and SAS to the null model, model SAS+ANC to SAS, model EUR+SAS to EUR, and EUR+LAT+ANC to EUR+SAS. For the EUR model we used RLD2=0.8 and PT=10-3, for SAS we used RLD2=0.8 and PT=0.8, and for EUR-SAS-metawe used RLD2=0.8 and PT=10-3. We also report normalized weights, defined as the mixing weight (see Methods) multiplied by the standard deviation of the PRS.
Analyses of height in Africans
We applied the same methods to predict height in African target samples from the UK Biobank (row 6 of Table 1). We used European summary statistics from UK Biobank (113,660 samples; British ancestry only) as European training data, African summary statistics from ref. (N'Diaye et al., 2011) (20,427 samples) as African training data, and African UK Biobank genotypes and phenotypes (1,745 samples) as African validation data.
Prediction accuracies (adjusted R2) and optimal weights for the 5 main methods (EUR, AFR, AFR+ANC, EUR+AFR, EUR+AFR+ANC) are reported in Table 5. For EUR and AFR, the best prediction accuracy was obtained using RLD2=0.2 and RLD2=0.8 respectively, thus we used these respective values of RLD2 for EUR and AFR in each PRS in all primary analyses (results using different LD thresholds are reported in S18 Table); the value of the optimal P-value threshold PT was equal to 10-3 for EUR and 0.05 for AFR. EUR performed much better than AFR, consistent with the far larger training sample size. Nevertheless, EUR+AFR attained a 30% improvement vs. EUR (using a larger weight for EUR than for AFR). EUR+AFR also attained a small relative improvement (7%) vs. EUR-AFR-meta (Table 5). Adding an ancestry predictor to EUR+AFR produced an insignificant change in accuracy for EUR+AFR+ANC compared to EUR+AFR; we note a modest correlation between each prediction method and the proportion of European-related ancestry (Reich et al., 2009) within African samples (see S19 Table). We repeated our analyses using stratified 10-fold cross-validation to estimate mixing weights (see Methods). We observed that methods that use two training populations continued to substantially outperform PRS using a single training population despite a decrease in prediction adjusted R2 (vs. Table 5) for each method, consistent with the limited sample size for estimating mixing weights (S20 Table).
Table 5. Accuracy of main prediction methods in analyses of height in an African cohort.
| Model | Weights associated to each predictor | Adjusted R2 | P-value for improvement over simpler model | |
|---|---|---|---|---|
| European PRS | African PRS | |||
| EUR | 0.164 | 0.02618 | <10-11 | |
| AFR | 0.106 | 0.01074 | <10-5 | |
| AFR+ANC | 0.124 | 0.01331 | 0.01 | |
| EUR+AFR | 0.155 | 0.092 | 0.03397 | <10-3 |
| EUR+AFR+ANC | 0.150 | 0.102 | 0.03443 | 0.17 |
| EUR-AFR-meta | 0.151 | 0.027 | 0.03158 | NA |
We report adjusted R2 on the observed scale for each of the 5 main prediction methods, as well as EUR-AFR-meta. P-values are from likelihood ratio tests comparing models EUR and AFR to the null model, model AFR+ANC to AFR, model EUR+AFR to EUR, and EUR+LAT+ANC to EUR+AFR. For the EUR model we used RLD2=0.2 and PT=10-3, for AFR we used RLD2=0.8 and PT=0.05 and for EUR-AFR-meta we used RLD2=0.2and PT=10-6. We also report normalized weights, defined as the mixing weight (see Methods) multiplied by the standard deviation of the PRS.
Discussion
We have shown that combining training data from European samples and training data from the target population attains a >70% relative improvement in prediction accuracy for type 2 diabetes in both Latino and South Asian cohorts compared to prediction methods that use training data from a single population. In addition, this approach attains 30% relative improvement in prediction accuracy for height in an African cohort. These relative improvements are robust to overfitting, consistent with simulations and reduce the documented gap in risk prediction accuracy between European and non-European target populations (Bustamante, De La Vega, & Burchard, 2011; International Schizophrenia Consortium et al., 2009; Popejoy & Fullerton, 2016; Rosenberg et al., 2010; Scutari et al., 2016; Vilhjálmsson et al., 2015); we note that there are at least 35 phenotypes for which there are published GWAS data sets in Europeans and at least one non-European population (with minimum sample size of 8,000) that are listed in the NHGRI-EBI GWAS Catalog (MacArthur et al., 2017), where our approach could potentially be valuable (S21 Table). Intuitively, our approach leverages both large training sample sizes and training data with target-matched LD patterns. We note that the effects of differential tagging (or different causal effect sizes) in different populations can potentially be quantified using cross-population genetic correlation (Brown, Ye, Price, & Zaitlen, in press; de Candia et al., 2013; Mancuso et al., 2016), and that leveraging data from a different population to improve predictions is a natural analogue to leveraging data from a correlated trait (Maier et al., 2015).
Despite these advantages, our work is subject to limitations and leaves several questions open for future exploration. First, although we have demonstrated large relative improvements in prediction accuracy, absolute prediction accuracies are currently not large enough to achieve clinical utility, which will require larger sample sizes (Chatterjee et al., 2013; Dudbridge, 2013); our simulations suggest that multi-ethnic polygenic risk scores will continue to produce improvements at larger sample sizes (Fig 1). Second, while our focus here was on prediction without using individual-level training data, when such data is available it may be possible to attain higher prediction accuracy using methods that fit all markers simultaneously, such as Best Linear Unbiased Predictor (BLUP) methods and their extensions (de los Campos et al., 2010; Golan & Rosset, 2014; Maier et al., 2015; Moser et al., 2015; Speed & Balding, 2014; Tucker et al., 2015; Weissbrod et al., 2016; Zhou et al., 2013). Third, our LDpred risk prediction method (Vilhjálmsson et al., 2015), which analyzes summary statistics in conjunction with LD information from a reference panel, is more accurate in European populations than the informed LD-pruning + P-value thresholding approach employed here; we did not employ LDpred due to the complexities of admixture-LD in analyses of admixed populations that explicitly model LD (Bulik-Sullivan et al., 2015), but extending LDpred to handle these complexities could further improve accuracy. Fourth, we note that in our application to real phenotypes adding an ancestry predictor produced insignificant changes in prediction accuracy, primarily because ancestry effects are captured by the polygenic risk scores; adding an ancestry predictor only improves prediction when we use a stringent P-value threshold to build the polygenic risk score (Fig 2). Fifth, we have not considered here how to improve prediction accuracy in data sets with related individuals (Tucker et al., 2015). Sixth, we did not incorporate local ancestry, which could potentially improve prediction accuracy in admixed populations (Seldin, Pasaniuc, & Price, 2011). Seventh, we did not incorporate data from the X chromosome, which is likely to harbor additional heritability that could improve prediction accuracy (Tukiainen et al., 2014). Finally, we focused our analyses on common variants, but future work may wish to consider rare variants as well.
Web Resources
PLINK: https://www.cog-genomics.org/plink2. WTCCC2 data set: http://www.wtccc.org.uk/ccc2. SIGMA data set: http://www.type2diabetesgenetics.org. DIAGRAM summary association statistics: http://www.diagram-consortium/org/. UK Biobank data set: https://www.ukbiobank.ac.uk. Fast PCA (EIGENSOFT version 6.1.4): http://www.hsph.harvard.edu/alkes-price/software/. EIGENSTRAT (EIGENSOFT version 6.0.1): http://www.hsph.harvard.edu/alkes-price/software/.
Supplementary Material
Acknowledgments
We are grateful to B. Vilhjalmsson and L. Liang for helpful discussions. We are grateful to G. Lettre for assistance with data from ref. (N'Diaye et al., 2011). This research has been conducted using the UK Biobank Resource (Application Number: 16549). This research was funded by NIH grant R01 GM105857 (A.L.P.).
Consortia
South Asian Type 2 Diabetes (SAT2D) Consortium
Jaspal S Kooner, Danish Saleheen, Xueling Sim, Joban Sehmi, Weihua Zhang, Philippe Frossard, Latonya F Been, Kee-Seng Chia, Antigone S Dimas, Neelam Hassanali, Tazeen Jafar, Jeremy BM Jowett, Xinzhing Li, Venkatesan Radha, Simon D Rees, Fumihiko Takeuchi, Robin Young, Tin Aung, Abdul Basit, Manickam Chidambaram, Debashish Das, Elin Grunberg, Åsa K Hedman, Zafar I Hydrie, Muhammed Islam, Chiea-Chuen Khor, Sudhir Kowlessur, Malene M Kristensen, Samuel Liju, Wei-Yen Lim, David R Matthews, Jianjun Liu, Andrew P Morris, Alexandra C Nica, Janani M Pinidiyapathirage, Inga Prokopenko, Asif Rasheed, Maria Samuel, Nabi Shah, A Samad Shera, Kerrin S Small, Chen Suo, Ananda R Wickremasinghe, Tien Yin Wong, Mingyu Yang, Fan Zhang, DIAGRAM, MuTHER, Goncalo R Abecasis, Anthony H Barnett, Mark Caulfield, Panos Deloukas, Tim Frayling, Philippe Froguel, Norihiro Kato, Prasad Katulanda, M Ann Kelly, Junbin Liang, Viswanathan Mohan, Dharambir K Sanghera, James Scott, Mark Seielstad, Paul Z Zimmet, Paul Elliott, Yik Ying Teo, Mark I McCarthy, John Danesh, E Shyong Tai, and John C Chambers
The SIGMA Type 2 Diabetes Consortium
Amy L. Williams, Suzanne B. R. Jacobs, Hortensia Moreno-Macías, Alicia Huerta-Chagoya, Claire Churchouse, Carla Márquez-Luna, Humberto García-Ortíz, María José Gómez-Vázquez, Stephan Ripke, Alisa K. Manning, Benjamin Neale, David Reich, Daniel O. Stram, Juan Carlos Fernández-López, Nick Patterson, Suzanne B. R. Jacobs, Claire Churchhouse, Shuba Gopal, James A. Grammatikos, Ian C. Smith, Kevin H. Bullock, Amy A. Deik, Amanda L. Souza, Kerry A. Pierce, Clary B. Clish, Angélica Martínez-Hernández, Francisco Barajas-Olmos, Federico Centeno-Cruz, Elvia Mendoza-Caamal, Cecilia Contreras-Cubas, Cristina Revilla-Monsalve, Sergio Islas-Andrade, Emilio Córdova, Xavier Soberón, María Elena González-Villalpando, Brian E. Henderson, Kristine Monroe, Lynne Wilkens, Laurence N. Kolonel, and Loic Le Marchand, Laura Riba, María Luisa Ordóñez-Sánchez, Rosario Rodríguez-Guillén, Ivette Cruz-Bautista, Maribel Rodríguez-Torres, Linda Liliana Muñoz-Hernández, Donají Gómez, Ulises Alvirde, Olimpia Arellano, Robert C. Onofrio, Wendy M. Brodeur, Diane Gage, Jacquelyn Murphy, Jennifer Franklin, Scott Mahan, Kristin Ardlie, Andrew T. Crenshaw, Wendy Winckler, Maria L. Cortes, Noël P. Burtt, Carlos A. Aguilar-Salinas, Clicerio González-Villalpando, Jose C. Florez, Lorena Orozco, Christopher A. Haiman, Teresa Tusié-Luna, David Altshuler
References
- Brown BC, Asian Genetic Epidemiology Network-Type 2 Diabetes (AGEN-T2D) Consortium. Ye CJ, Price AL, Zaitlen N. Transethnic genetic correlation estimates from summary statistics. American Journal of Human Genetics. doi: 10.1016/j.ajhg.2016.05.001. in press. Retrieved from http://biorxiv.org/content/early/2016/01/14/036657. [DOI] [PMC free article] [PubMed]
- Bulik-Sullivan BK, Loh PR, Finucane HK, Ripke S, Yang J, Schizophrenia Working Group of the Psychiatric Genomics Consortium et al. Neale BM. LD Score regression distinguishes confounding from polygenicity in genome-wide association studies. Nature Genetics. 2015;47(3):291–295. doi: 10.1038/ng.3211. https://doi.org/10.1038/ng.3211. [DOI] [PMC free article] [PubMed] [Google Scholar]
- Bustamante CD, De La Vega FM, Burchard EG. Genomics for the world. Nature. 2011;475(7355):163–165. doi: 10.1038/475163a. https://doi.org/10.1038/475163a. [DOI] [PMC free article] [PubMed] [Google Scholar]
- Chatterjee N, Shi J, García-Closas M. Developing and evaluating polygenic risk prediction models for stratified disease prevention. Nature Reviews Genetics. 2016;17(7):392–406. doi: 10.1038/nrg.2016.27. https://doi.org/10.1038/nrg.2016.27. [DOI] [PMC free article] [PubMed] [Google Scholar]
- Chatterjee N, Wheeler B, Sampson J, Hartge P, Chanock SJ, Park JH. Projecting the performance of risk prediction based on polygenic analyses of genome-wide association studies. Nature Genetics. 2013;45(4):400–405. 405–3. doi: 10.1038/ng.2579. https://doi.org/10.1038/ng.2579. [DOI] [PMC free article] [PubMed] [Google Scholar]
- Chen CY, Han J, Hunter DJ, Kraft P, Price AL. Explicit Modeling of Ancestry Improves Polygenic Risk Scores and BLUP Prediction. Genetic Epidemiology. 2015;39(6):427–438. doi: 10.1002/gepi.21906. https://doi.org/10.1002/gepi.21906. [DOI] [PMC free article] [PubMed] [Google Scholar]
- Chen R, Corona E, Sikora M, Dudley JT, Morgan AA, Moreno-Estrada A, et al. Butte AJ. Type 2 Diabetes Risk Alleles Demonstrate Extreme Directional Differentiation among Human Populations, Compared to Other Diseases. PLOS Genet. 2012;8(4):e1002621. doi: 10.1371/journal.pgen.1002621. https://doi.org/10.1371/journal.pgen.1002621. [DOI] [PMC free article] [PubMed] [Google Scholar]
- Corona E, Chen R, Sikora M, Morgan AA, Patel CJ, Ramesh A, et al. Butte AJ. Analysis of the Genetic Basis of Disease in the Context of Worldwide Human Relationships and Migration. PLOS Genet. 2013;9(5):e1003447. doi: 10.1371/journal.pgen.1003447. https://doi.org/10.1371/journal.pgen.1003447. [DOI] [PMC free article] [PubMed] [Google Scholar]
- de Candia TR, Lee SH, Yang J, Browning BL, Gejman PV, Levinson DF, et al. Keller MC. Additive genetic variation in schizophrenia risk is shared by populations of African and European descent. American Journal of Human Genetics. 2013;93(3):463–470. doi: 10.1016/j.ajhg.2013.07.007. https://doi.org/10.1016/j.ajhg.2013.07.007. [DOI] [PMC free article] [PubMed] [Google Scholar]
- de los Campos G, Gianola D, Allison DB. Predicting genetic predisposition in humans: the promise of whole-genome markers. Nature Reviews Genetics. 2010;11(12):880–886. doi: 10.1038/nrg2898. https://doi.org/10.1038/nrg2898. [DOI] [PubMed] [Google Scholar]
- Dudbridge F. Power and predictive accuracy of polygenic risk scores. PLoS Genetics. 2013;9(3):e1003348. doi: 10.1371/journal.pgen.1003348. https://doi.org/10.1371/journal.pgen.1003348. [DOI] [PMC free article] [PubMed] [Google Scholar]
- Galinsky KJ, Bhatia G, Loh PR, Georgiev S, Mukherjee S, Patterson NJ, Price AL. Fast Principal-Component Analysis Reveals Convergent Evolution of ADH1B in Europe and East Asia. The American Journal of Human Genetics. 2016;98(3):456–472. doi: 10.1016/j.ajhg.2015.12.022. https://doi.org/10.1016/j.ajhg.2015.12.022. [DOI] [PMC free article] [PubMed] [Google Scholar]
- Galinsky KJ, Loh PR, Mallick S, Patterson NJ, Price AL. Population Structure of UK Biobank and Ancient Eurasians Reveals Adaptation at Genes Influencing Blood Pressure. The American Journal of Human Genetics. 2016;99(5):1130–1139. doi: 10.1016/j.ajhg.2016.09.014. https://doi.org/10.1016/j.ajhg.2016.09.014. [DOI] [PMC free article] [PubMed] [Google Scholar]
- Golan D, Rosset S. Effective genetic-risk prediction using mixed models. American Journal of Human Genetics. 2014;95(4):383–393. doi: 10.1016/j.ajhg.2014.09.007. https://doi.org/10.1016/j.ajhg.2014.09.007. [DOI] [PMC free article] [PubMed] [Google Scholar]
- International Schizophrenia Consortium. Purcell SM, Wray NR, Stone JL, Visscher PM, O'Donovan MC, et al. Sklar P. Common polygenic variation contributes to risk of schizophrenia and bipolar disorder. Nature. 2009;460(7256):748–752. doi: 10.1038/nature08185. https://doi.org/10.1038/nature08185. [DOI] [PMC free article] [PubMed] [Google Scholar]
- Kooner JS, Saleheen D, Sim X, Sehmi J, Zhang W, Frossard P, et al. Chambers JC. Genome-wide association study in individuals of South Asian ancestry identifies six new type 2 diabetes susceptibility loci. Nature Genetics. 2011;43(10):984–989. doi: 10.1038/ng.921. https://doi.org/10.1038/ng.921. [DOI] [PMC free article] [PubMed] [Google Scholar]
- Kooperberg C, LeBlanc M, Obenchain V. Risk prediction using genome-wide association studies. Genetic Epidemiology. 2010;34(7):643–652. doi: 10.1002/gepi.20509. https://doi.org/10.1002/gepi.20509. [DOI] [PMC free article] [PubMed] [Google Scholar]
- Lee SH, Goddard ME, Wray NR, Visscher PM. A Better Coefficient of Determination for Genetic Profile Analysis. Genetic Epidemiology. 2012;36(3):214–224. doi: 10.1002/gepi.21614. https://doi.org/10.1002/gepi.21614. [DOI] [PubMed] [Google Scholar]
- MacArthur J, Bowler E, Cerezo M, Gil L, Hall P, Hastings E, et al. Parkinson H. The new NHGRI-EBI Catalog of published genome-wide association studies (GWAS Catalog) Nucleic Acids Research. 2017;45(Database issue):D896–D901. doi: 10.1093/nar/gkw1133. https://doi.org/10.1093/nar/gkw1133. [DOI] [PMC free article] [PubMed] [Google Scholar]
- Maier R, Moser G, Chen GB, Ripke S, Cross-Disorder Working Group of the Psychiatric Genomics Consortium. Coryell W, Lee SH. Joint analysis of psychiatric disorders increases accuracy of risk prediction for schizophrenia, bipolar disorder, and major depressive disorder. American Journal of Human Genetics. 2015;96(2):283–294. doi: 10.1016/j.ajhg.2014.12.006. https://doi.org/10.1016/j.ajhg.2014.12.006. [DOI] [PMC free article] [PubMed] [Google Scholar]
- Mancuso N, Rohland N, Rand KA, Tandon A, Allen A, Quinque D, et al. Reich D. The contribution of rare variation to prostate cancer heritability. Nature Genetics. 2016;48(1):30–35. doi: 10.1038/ng.3446. https://doi.org/10.1038/ng.3446. [DOI] [PMC free article] [PubMed] [Google Scholar]
- Morris AP, Voight BF, Teslovich TM, Ferreira T, Segrè AV, Steinthorsdottir V, et al. DIAbetes Genetics Replication And Meta-analysis (DIAGRAM) Consortium. Large-scale association analysis provides insights into the genetic architecture and pathophysiology of type 2 diabetes. Nature Genetics. 2012;44(9):981–990. doi: 10.1038/ng.2383. https://doi.org/10.1038/ng.2383. [DOI] [PMC free article] [PubMed] [Google Scholar]
- Moser G, Lee SH, Hayes BJ, Goddard ME, Wray NR, Visscher PM. Simultaneous discovery, estimation and prediction analysis of complex traits using a bayesian mixture model. PLoS Genetics. 2015;11(4):e1004969. doi: 10.1371/journal.pgen.1004969. https://doi.org/10.1371/journal.pgen.1004969. [DOI] [PMC free article] [PubMed] [Google Scholar]
- N'Diaye A, Chen GK, Palmer CD, Ge B, Tayo B, Mathias RA, et al. Haiman CA. Identification, Replication, and Fine-Mapping of Loci Associated with Adult Height in Individuals of African Ancestry. PLOS Genet. 2011;7(10):e1002298. doi: 10.1371/journal.pgen.1002298. https://doi.org/10.1371/journal.pgen.1002298. [DOI] [PMC free article] [PubMed] [Google Scholar]
- Palla L, Dudbridge F. A Fast Method that Uses Polygenic Scores to Estimate the Variance Explained by Genome-wide Marker Panels and the Proportion of Variants Affecting a Trait. American Journal of Human Genetics. 2015;97(2):250–259. doi: 10.1016/j.ajhg.2015.06.005. https://doi.org/10.1016/j.ajhg.2015.06.005. [DOI] [PMC free article] [PubMed] [Google Scholar]
- Popejoy AB, Fullerton SM. Genomics is failing on diversity. Nature News. 2016;538(7624):161. doi: 10.1038/538161a. https://doi.org/10.1038/538161a. [DOI] [PMC free article] [PubMed] [Google Scholar]
- Price AL, Patterson NJ, Plenge RM, Weinblatt ME, Shadick NA, Reich D. Principal components analysis corrects for stratification in genome-wide association studies. Nature Genetics. 2006;38(8):904–909. doi: 10.1038/ng1847. https://doi.org/10.1038/ng1847. [DOI] [PubMed] [Google Scholar]
- Reich D, Thangaraj K, Patterson N, Price AL, Singh L. Reconstructing Indian population history. Nature. 2009;461(7263):489–494. doi: 10.1038/nature08365. https://doi.org/10.1038/nature08365. [DOI] [PMC free article] [PubMed] [Google Scholar]
- Robinson MR, Hemani G, Medina-Gomez C, Mezzavilla M, Esko T, Shakhbazov K, et al. Visscher PM. Population genetic differentiation of height and body mass index across Europe. Nature Genetics. 2015;47(11):1357–1362. doi: 10.1038/ng.3401. https://doi.org/10.1038/ng.3401. [DOI] [PMC free article] [PubMed] [Google Scholar]
- Rosenberg NA, Huang L, Jewett EM, Szpiech ZA, Jankovic I, Boehnke M. Genome-wide association studies in diverse populations. Nature Reviews. Genetics. 2010;11(5):356–366. doi: 10.1038/nrg2760. https://doi.org/10.1038/nrg2760. [DOI] [PMC free article] [PubMed] [Google Scholar]
- Sawcer S, Hellenthal G, Pirinen M, Spencer CCA, Patsopoulos NA, Moutsianas L, et al. Compston A. Genetic risk and a primary role for cell-mediated immune mechanisms in multiple sclerosis. Nature. 2011;476(7359):214–219. doi: 10.1038/nature10251. https://doi.org/10.1038/nature10251. [DOI] [PMC free article] [PubMed] [Google Scholar]
- Scutari M, Mackay I, Balding D. Using Genetic Distance to Infer the Accuracy of Genomic Prediction. PLOS Genet. 2016;12(9):e1006288. doi: 10.1371/journal.pgen.1006288. https://doi.org/10.1371/journal.pgen.1006288. [DOI] [PMC free article] [PubMed] [Google Scholar]
- Seldin MF, Pasaniuc B, Price AL. New approaches to disease mapping in admixed populations. Nature Reviews Genetics. 2011;12(8):523–528. doi: 10.1038/nrg3002. https://doi.org/10.1038/nrg3002. [DOI] [PMC free article] [PubMed] [Google Scholar]
- Shah S, Bonder MJ, Marioni RE, Zhu Z, McRae AF, Zhernakova A, et al. Visscher PM. Improving Phenotypic Prediction by Combining Genetic and Epigenetic Associations. American Journal of Human Genetics. 2015;97(1):75–85. doi: 10.1016/j.ajhg.2015.05.014. https://doi.org/10.1016/j.ajhg.2015.05.014. [DOI] [PMC free article] [PubMed] [Google Scholar]
- Shi J, Park JH, Duan J, Berndt ST, Moy W, Yu K, et al. Chatterjee N. Winner's Curse Correction and Variable Thresholding Improve Performance of Polygenic Risk Modeling Based on Genome-Wide Association Study Summary-Level Data. PLOS Genetics. 2016;12(12):e1006493. doi: 10.1371/journal.pgen.1006493. https://doi.org/10.1371/journal.pgen.1006493. [DOI] [PMC free article] [PubMed] [Google Scholar]
- SIGMA Type 2 Diabetes Consortium. Williams AL, Jacobs SBR, MorenoMacías H, Huerta-Chagoya A, Churchhouse C, et al. Altshuler D. Sequence variants in SLC16A11 are a common risk factor for type 2 diabetes in Mexico. Nature. 2014;506(7486):97–101. doi: 10.1038/nature12828. https://doi.org/10.1038/nature12828. [DOI] [PMC free article] [PubMed] [Google Scholar]
- Speed D, Balding DJ. MultiBLUP: improved SNP-based prediction for complex traits. Genome Research. 2014;24(9):1550–1557. doi: 10.1101/gr.169375.113. https://doi.org/10.1101/gr.169375.113. [DOI] [PMC free article] [PubMed] [Google Scholar]
- Stahl EA, Wegmann D, Trynka G, Gutierrez-Achury J, Do R, Voight BF, et al. Plenge RM. Bayesian inference analyses of the polygenic architecture of rheumatoid arthritis. Nature Genetics. 2012;44(5):483–489. doi: 10.1038/ng.2232. https://doi.org/10.1038/ng.2232. [DOI] [PMC free article] [PubMed] [Google Scholar]
- Tucker G, Loh PR, MacLeod IM, Hayes BJ, Goddard ME, Berger B, Price AL. Two-Variance-Component Model Improves Genetic Prediction in Family Datasets. American Journal of Human Genetics. 2015;97(5):677–690. doi: 10.1016/j.ajhg.2015.10.002. https://doi.org/10.1016/j.ajhg.2015.10.002. [DOI] [PMC free article] [PubMed] [Google Scholar]
- Tukiainen T, Pirinen M, Sarin AP, Ladenvall C, Kettunen J, Lehtimäki T, et al. Ripatti S. Chromosome X-Wide Association Study Identifies Loci for Fasting Insulin and Height and Evidence for Incomplete Dosage Compensation. PLOS Genetics. 2014;10(2):e1004127. doi: 10.1371/journal.pgen.1004127. https://doi.org/10.1371/journal.pgen.1004127. [DOI] [PMC free article] [PubMed] [Google Scholar]
- Turchin MC, Chiang CW, Palmer CD, Sankararaman S, Reich D Genetic Investigation of ANthropometric Traits (GIANT) Consortium. Hirschhorn JN. Evidence of widespread selection on standing variation in Europe at height-associated SNPs. Nature Genetics. 2012;44(9):1015–1019. doi: 10.1038/ng.2368. https://doi.org/10.1038/ng.2368. [DOI] [PMC free article] [PubMed]
- Vilhjálmsson BJ, Yang J, Finucane HK, Gusev A, Lindström S, Ripke S, et al. Price AL. Modeling Linkage Disequilibrium Increases Accuracy of Polygenic Risk Scores. The American Journal of Human Genetics. 2015;97(4):576–592. doi: 10.1016/j.ajhg.2015.09.001. https://doi.org/10.1016/j.ajhg.2015.09.001. [DOI] [PMC free article] [PubMed] [Google Scholar]
- Weissbrod O, Geiger D, Rosset S. Multikernel linear mixed models for complex phenotype prediction. Genome Research. 2016 doi: 10.1101/gr.201996.115. https://doi.org/10.1101/gr.201996.115. [DOI] [PMC free article] [PubMed]
- Wray NR, Yang J, Hayes BJ, Price AL, Goddard ME, Visscher PM. Pitfalls of predicting complex traits from SNPs. Nature Reviews Genetics. 2013;14(7):507–515. doi: 10.1038/nrg3457. https://doi.org/10.1038/nrg3457. [DOI] [PMC free article] [PubMed] [Google Scholar]
- Yang J, Zaitlen NA, Goddard ME, Visscher PM, Price AL. Advantages and pitfalls in the application of mixed-model association methods. Nature Genetics. 2014;46(2):100–106. doi: 10.1038/ng.2876. https://doi.org/10.1038/ng.2876. [DOI] [PMC free article] [PubMed] [Google Scholar]
- Zeggini E, Scott LJ, Saxena R, Voight BF, Marchini JL, Hu T, et al. Altshuler D. Meta-analysis of genome-wide association data and large-scale replication identifies additional susceptibility loci for type 2 diabetes. Nature Genetics. 2008;40(5):638–645. doi: 10.1038/ng.120. https://doi.org/10.1038/ng.120. [DOI] [PMC free article] [PubMed] [Google Scholar]
- Zhou X, Carbonetto P, Stephens M. Polygenic modeling with bayesian sparse linear mixed models. PLoS Genetics. 2013;9(2):e1003264. doi: 10.1371/journal.pgen.1003264. https://doi.org/10.1371/journal.pgen.1003264. [DOI] [PMC free article] [PubMed] [Google Scholar]
Associated Data
This section collects any data citations, data availability statements, or supplementary materials included in this article.