Abstract
Purpose
To assess retinoblastoma epidemiological trends in the Surveillance, Epidemiology, and End Results (SEER) registry.
Methods
All cases of retinoblastoma in the SEER database from 1973–2009 were identified. Kaplan-Meier survival analyses were performed for pathological grade, patient age, gender, year of diagnosis, and treatment modality. Cox proportional hazards regression assessed the impact of patient and tumor characteristics on survival.
Findings
1,452 cases of retinoblastoma were analyzed. The mean patient age at diagnosis was 1.44 years. The tumor was unilateral in 71.0% or bilateral in 29.0%. The mean follow-up was 129.1 months. Overall survival increased during the study interval. Patients with bilateral tumors were diagnosed at an earlier age (0.46 years) than patients with unilateral disease (1.77 years; P < 0.0001). Bilateral retinoblastoma (90.3% 10-year overall survival) was associated with decreased overall survival than unilateral retinoblastoma (96.1% 10-year overall survival). Bilateral retinoblastoma was also associated with an increased incidence of non-ocular malignancies (7.8%) compared with unilateral retinoblastoma (1.3%; P < 0.0001). Grade 1 tumors were diagnosed at a younger age (0.94 years) than grade 3 (2.24 years) and grade 4 tumors (2.14 years; P < 0.0001). Lower grade and lower stage tumors were independently associated with increased survival. In multivariate Cox proportional hazards analysis, T stage and laterality were the only covariates that correlated with overall survival.
Conclusions
There appear to be associations between retinoblastoma tumor features such as tumor stage, pathological grade, and laterality with patient characteristics such as age at diagnosis, overall survival, and second malignancies.
Keywords: Retina, epidemiology, Retinoblastoma, ocular oncology
Introduction
Retinoblastoma is a potentially devastating childhood tumor with an incidence of approximately 1 in 18,000 live births in the United States.1 The treatment of this entity has evolved significantly in the last 30 years.2 Therapeutic paradigms have focused on minimizing the morbidity and mortality arising from metastasis, associated cerebral malignancy in cases of hereditary retinoblastoma (most commonly of the pineal gland and referred to as trilateral retinoblastoma), and secondary neoplasms, while maintaining visual function. Consequently there has been increased utilization of systemic3,4 and targeted5–8 chemotherapy, 2,5–8 with a corresponding shift away from radiotherapy.2
Broaddus et al. have reported the incidence of retinoblastoma in the United States to have remained stable from 1975 to 2004.9 They have also reported a steady improvement in survival over the same 30-year interval.10 Tamboli et al. examined the effects of treatment modality on survival.2 The specific longitudinal associations and disease patterns of this cancer have yet to be fully elucidated. The current study aims to evaluate the epidemiological trends in retinoblastoma over a 37-year interval via analysis of the Surveillance, Epidemiology, and End Results (SEER) Program tumor registry, specifically analyzing the impact of patient and tumor characteristics such as laterality, tumor stage, and tumor pathological grade.
Methods
All cases of retinoblastoma between 1973 and 2009 were selected from the SEER database. The SEER database is a population-based cancer registry that captures 18 distinct population groups in 198 counties in the United States. It represents approximately 26% of the overall United States population and contains information on 7,262,696 cases of cancer diagnosed since 1973.11 Permission to use these data for analysis was obtained from the SEER program of the National Cancer Institute, National Institutes of Health. Institutional Review Board permission was not required for this study.
The data in this study were standardized according to schema published in the second and third editions of the International Classification of Disease for Oncology.12 For the current study histologic type was limited to retinoblastoma (M9512/3 in the morphological codes of the second edition of the International Classification of Disease for Oncology). Primary site was restricted to retina by site code C69.2. The SEER database provides staging classification per the American Joint Committee on Cancer (AJCC) 6th edition13 specifications for years 2004–2009, not the International Classification utilized by many clinicians. The primary tumor extent is defined by T stage under this classification system, as summarized in Table 1. Histologic grade was one of the analyzed variables, in which well-differentiated tumors are referred to as Grade 1, moderately differentiated tumors are referred to as Grade 2, poorly differentiated tumors are referred to as Grade 3, and undifferentiated tumors are referred to as Grade 4.
Table 1.
T Stage classification summary (AJCC 6th edition) 13
| Primary Tumor “T Stage” | Extent of Tumor |
|---|---|
| T1 | Tumor confined to retina without vitreous seeding or significant retinal detachment |
| T2 | Tumor with spread to vitreous or subretinal space |
| T3 | Tumor invasion of optic nerve or optic coat |
| T4 | Extraocular tumor |
Specific details regarding radiation dose and fractionation schedules, and adjuvant chemotherapy were not available in the SEER database. Data were analyzed using the SEER*Stat Limited Use software provided by the National Cancer Institute, Bethesda, Maryland and GraphPad Prism software (GraphPad Software, Inc., La Jolla, CA). Overall survival was the primary outcome measure. Survival curves were generated using the Kaplan-Meier method and compared using the Mantel-Cox log-rank test. Categorical data were analyzed using a Fisher’s exact test. When comparing two groups, an unpaired t test was performed for continuous variables. When comparing three or more groups, an analysis of variance was performed. Cox proportional hazards regression was performed to assess the impact of patient and tumor characteristics on survival. Significance was defined as P < 0.05.
Results
The SEER database provided 1,452 total cases of retinoblastoma between 1973 and 2009. Patient and tumor characteristics are summarized in Table 2.
Table 2.
Retinoblastoma Patient Summary Characteristics
| Total Patients | 1,452 |
| Mean age (range) | 1.44 years (<1 to 42 years) |
| Mean follow-up interval | 129.1 months |
| Gender | |
| Male | 52.1% |
| Female | 47.9% |
| Race | |
| White | 50.1% |
| White categorized as Hispanic origin | 23.6% |
| Black | 14.3% |
| Asian or Pacific Islander | 9.0% |
| American Indian/Alaska Native | 1.9% |
| Unknown | 1.1% |
| Laterality | |
| Unilateral | 71.0% |
| Bilateral | 29.0% |
| Tumor Grade | |
| Grade 1 (well differentiated) | 10.9% |
| Grade 2 (moderately differentiated) | 1.4% |
| Grade 3 (poorly differentiated) | 6.1% |
| Grade 4 (undifferentiated) | 12.2% |
| Unknown | 69.5% |
The mean patient age was 1.44 years (standard deviation 2.64 years, range <1 to 42 years). The cohort was 52.1% male and 47.9% female. Tissue confirmation was available in 84% of cases. The tumor was unilateral in 71.0% (left-sided primary in 34.4%, right-sided in 36.6%), and bilateral in 29.0%. The mean follow-up time was 129.1 months (standard deviation 113.1 months; range 0 to 443 months).
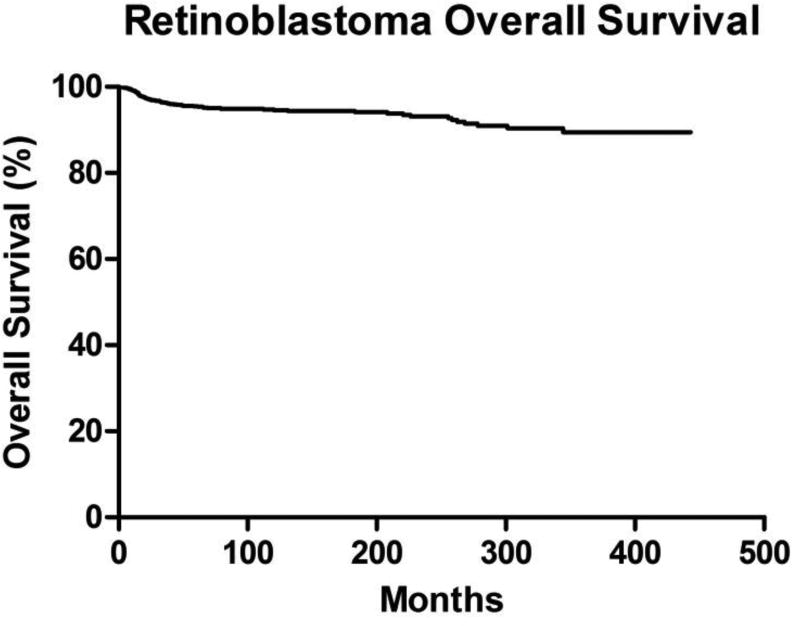
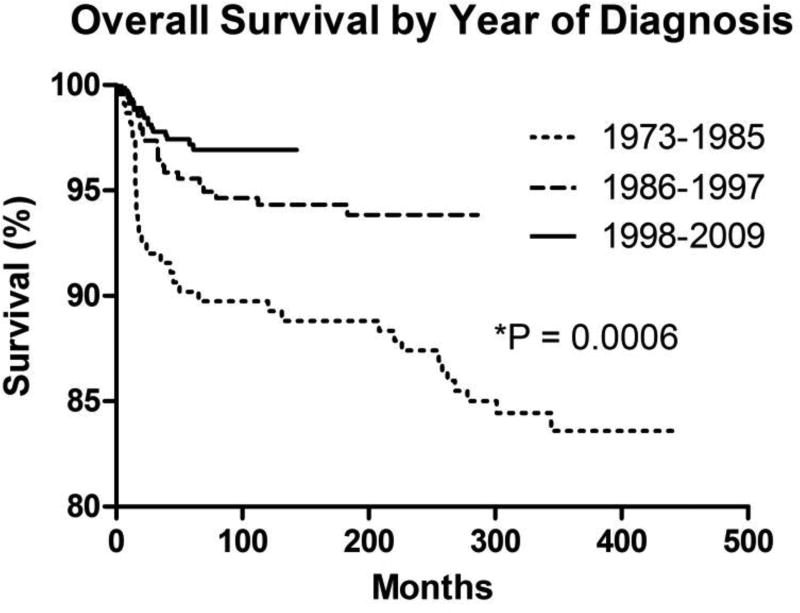
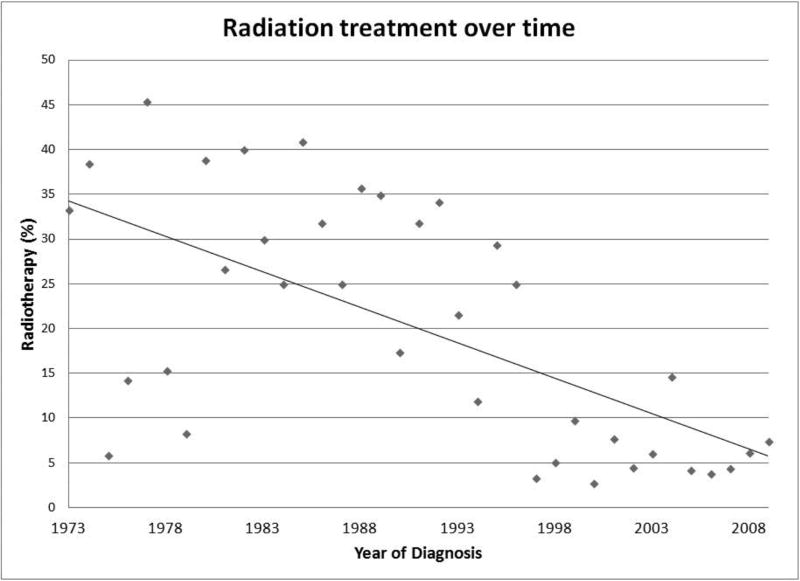
Survival analysis was performed on the 1,397 cases for which retinoblastoma was identified as the sole primary cancer. A Kaplan-Meier survival analysis was generated for all retinoblastoma patients (Figure 1). There was no difference in overall survival by gender (P = 0.4318; hazard ratio = 1.201, 95% confidence interval [CI] = 0.7609–1.895). There was also no difference in overall survival by age at diagnosis (P = 0.2323). When stratifying for year of diagnosis, there was an improvement in overall survival over time (P = 0.0006) (Figure 2). While a diagnosis of retinoblastoma between the years 1998 and 2009 (overall survival of 96.9% at 10 years) yielded better overall survival than for 1973–1985 (overall survival 89.7% at 10 years; P < 0.0001; hazard ratio = 4.738, 95% confidence interval [CI] = 2.388–9.398), there was no difference in overall survival between the intervals 1998–2009 and 1986–1997 (overall survival 94.3% at 10 years; P = 0.0926; hazard ratio = 1.775, 95% confidence interval [CI] = 0.9095–3.465). A diagnosis between 1986 and 1997 was also associated with better overall survival than 1973–1985 (P = 0.0087; hazard ratio = 2.135, 95% confidence interval [CI] = 1.211 to 3.762). Of note, there was no apparent variance in age of diagnosis over time (data not shown). However, there has been a steady decline in the proportion of patients undergoing radiotherapy over the last four decades (Figure 3).
Figure 1. Patient Overall Survival.
Kaplan-Meier overall survival curve for all cases of retinoblastoma.
Figure 2. Overall Survival by Year of Diagnosis.
Kaplan-Meier overall survival curves for retinoblastoma cases stratified by year of diagnosis.
Figure 3. Radiotherapy Utilization over Time.
Scatter-plot of retinoblastoma cases treated with radiotherapy over time.
Patient age at diagnosis varied with tumor characteristics. Patients with bilateral tumors were diagnosed earlier (0.46 years, standard deviation 0.81 years) than those with unilateral disease (1.77 years, standard deviation 2.82 years; P < 0.0001). Age at diagnosis differed by tumor histological grade (P < 0.0001). Grade 1 tumors were diagnosed at a younger age (0.94 years, standard deviation 1.58 years) than grade 3 cancers (2.24 years, standard deviation 1.97 years; P < 0.0001) or grade 4 tumors (2.14 years, standard deviation 2.30 years; P < 0.0001). However, there was no statistical difference between age at diagnosis of grade 1 and grade 2 tumors (1.50 years, standard deviation 1.54 years; P = 0.0983), grade 2 and grade 3 cancers (P = 0.1717), grade 2 and grade 4 disease (P = 0.3006), or grade 3 and grade 4 tumors (P = 0.7250).
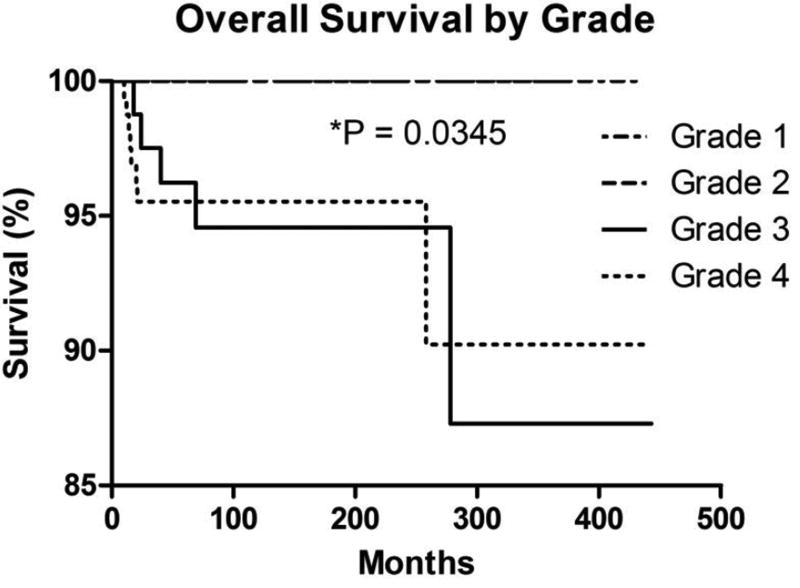
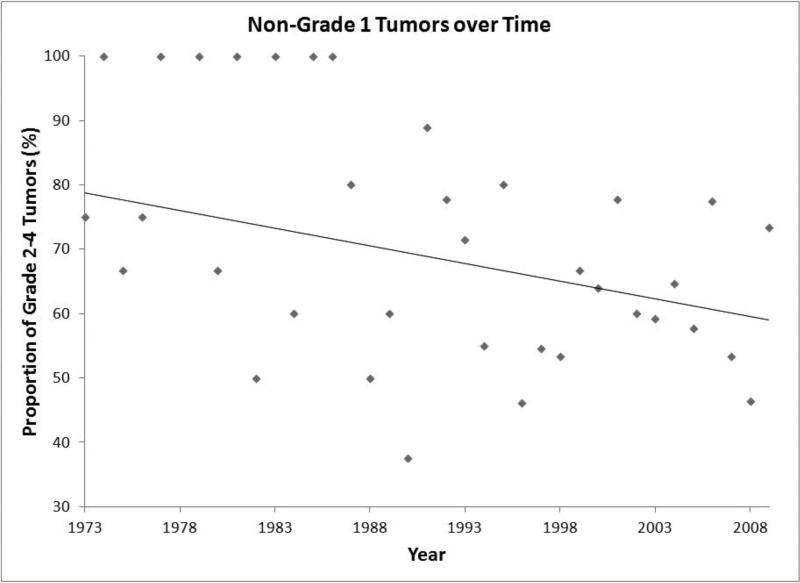
Tumor grade was associated with overall survival. While grade 1 and grade 2 tumors yielded no deaths during follow-up in this dataset, grade 3 and grade 4 tumors were associated with decreased overall survival (P = 0.0345) (Figure 4). Grade 1 tumors exhibited superior overall survival to both grade 3 tumors (P = 0.0074; hazard ratio = 0.08621, 95% confidence interval [CI] = 0.01433–0.5185) and grade 4 tumors (P = 0.0081; hazard ratio = 0.1528, 95% confidence interval [CI] = 0.03805–0.6133). There was no difference in overall survival between grade 2 and grade 3 tumors (P = 0.2348; hazard ratio = 0.2734, 95% confidence interval [CI] = 0.03218–2.323), grade 2 and grade 4 tumors (P = 0.2750; hazard ratio = 0.3108, 95% confidence interval [CI] = 0.03811–2.534), or grade 3 and grade 4 tumors (P = 0.9102; hazard ratio = 1.067, 95% confidence interval [CI] = 0.3446–3.305). There has been a gradual decrease in the proportion of high-grade tumors during the study interval (Figure 5).
Figure 4. Overall Survival by Tumor Grade.
Kaplan-Meier overall survival curves of retinoblastoma cases stratified by tumor grade.
Figure 5. Tumor Grade over Time.
Scatter-plot of retinoblastoma tumors diagnosed as grade 2–4 over time.
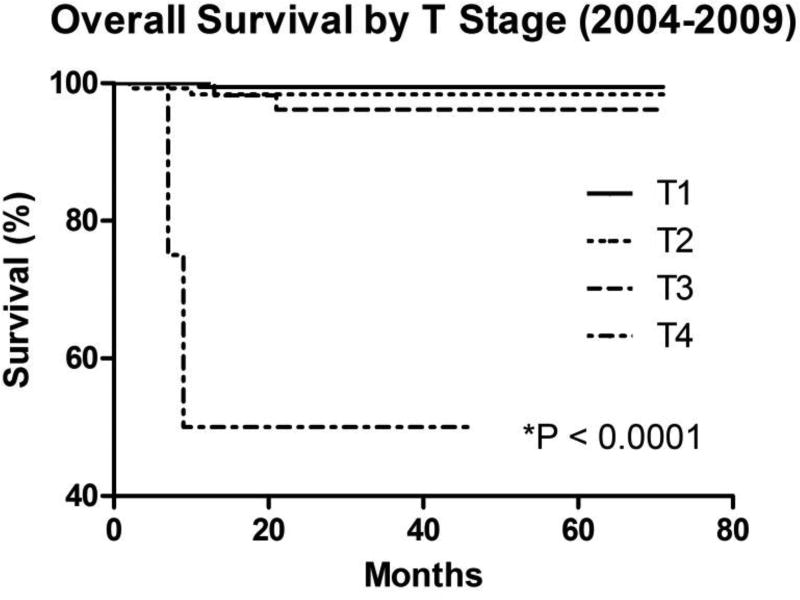
Advanced tumor stage was associated with decreased overall survival (Figure 6). T4 tumors were associated with worse overall survival compared with T1 tumors (P < 0.0001; hazard ratio = 3.10E18, 95% confidence interval [CI] = 3.29E12–2.92E24), T2 tumors (P < 0.0001; hazard ratio = 1.95E7, 95% confidence interval [CI] = 5.60E4–6.76E9), and T3 tumors (P < 0.0001; hazard ratio = 4.11E4, 95% confidence interval [CI] = 361–4.69E6). There was no difference in overall survival between T1 and T2 tumors (P = 0.3190; hazard ratio = 0.3068, 95% confidence interval [CI] = 0.03003–3.135), T1 and T3 tumors (P = 0.0944; hazard ratio = 0.1072, 95% confidence interval [CI] = 0.007832–1.468), or T2 and T3 tumors (P = 0.5122; hazard ratio = 0.5017, 95% confidence interval [CI] = 0.06377–3.947).
Figure 6. Overall Survival by T Stage.
Kaplan-Meier overall survival curves of retinoblastoma cases by TNM T stage
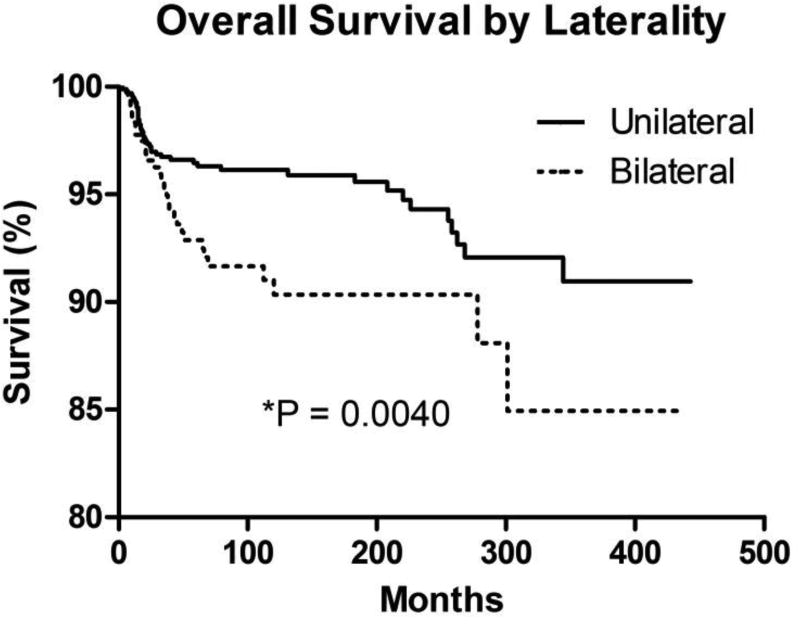
Survival differed among patients with bilateral vs. unilateral retinoblastoma (Figure 7). Unilateral disease was associated with higher overall survival (96.1% at 10 years) than bilateral disease (90.3% at 10 years; P = 0.0040; hazard ratio = 0.4643, 95% confidence interval [CI] = 0.2754 to 0.7827). There was an increased incidence of second malignancies in the bilateral retinoblastoma cohort (33, 0.078%) compared with patients having unilateral retinoblastoma (13, 0.013%; P < 0.0001) during the follow-up interval in the SEER dataset. In addition, the distribution of second malignancies by type varied among patients with unilateral vs. bilateral disease (Table 3 and Table 4). There was no apparent change in the ratio of unilateral to bilateral disease over the time interval (data not shown).
Figure 7. Overall Survival by Laterality.
Kaplan-Meier overall survival curves for retinoblastoma cases by tumor laterality (bilateral vs. unilateral).
Table 3.
Second Malignancies in Patients with Unilateral Retinoblastoma
| Tumor type | Patients | Median age at diagnosis (range), years |
|---|---|---|
| Total | 13 | 9 (<1–44) |
| Sarcoma | ||
| Osteosarcoma | 3 | 13 (9–17) |
| Liposarcoma (scrotum) | 1 | 26 |
| Rhabdomyosarcoma (head/neck) | 1 | 8 |
| Undifferentiated (bone) | 1 | 14 |
| Intracranial | ||
| Glioma | 1 | 2 |
| Pilocytic astrocytoma | 1 | 1 |
| Primitive neuroectodermal tumor | 1 | 1 |
| Leukemia | 1 | 8 |
| Adenocarcinoma (colon) | 1 | 44 |
| Skin melanoma | 1 | <1 |
| Seminoma (testis) | 1 | 35 |
Table 4.
Second Malignancies in Patients with Bilateral Retinoblastoma
| Tumor type | Patients | Median age at diagnosis (range), years |
|---|---|---|
| Total | 33 | 10 (<1–30) |
| Intracranial | ||
| Pineoblastoma | 4 | 0.5 (<1–4) |
| Primitive neuroectodermal tumor (brain) | 1 | <1 |
| Sarcoma | ||
| Osteosarcoma | 13 | 8 (2–27) |
| Rhabdomyosarcoma (head/neck) | 2 | 10 (8–12) |
| Leiomyosarcoma (orbit, bladder) | 2 | 27 (27–27) |
| Liposarcoma (pelvis) | 1 | 20 |
| Leukemia | 3 | 14 (5–15) |
| Lymphoma | 1 | 4 |
| Squamous neoplasm (cervix, conjunctiva) | 2 | 18 (14–22) |
| Adenocarcinoma (cervix) | 1 | 30 |
| Nerve sheath tumor | 1 | 10 |
| Fibrous histiocytoma (sinus) | 2 | 13.5 (12–15) |
The incidence of pineoblastoma was significantly higher in the bilateral retinoblastoma group (1%) than in the unilateral retinoblastoma group (0%; P = 0.0058). The rate of osteosarcoma was ten-fold higher in the bilateral retinoblastoma group (3.2%) than in the unilateral group (0.29%; P < 0.0001). While there was a trend toward a higher rate of leukemia in the bilateral retinoblastoma group (0.75%) than in the unilateral group (0.095%), this association was not statistically significant (P = 0.0665).
Cox proportional hazards regression analysis was performed for overall survival with the following covariates: laterality (unilateral or bilateral), AJCC T stage, gender, year of diagnosis, radiotherapy, race, and age at diagnosis. T stage and laterality were the only covariates that correlated with overall survival in multivariate analyses (see Table 5).
Table 5.
Cox Proportional Hazards Regression Model for Overall Survival
| Variable | P value | Hazard ratio (CI) |
|---|---|---|
| Laterality (bilateral vs. unilateral) | 0.019 | 20.657 (1.645 – 259.431) |
| T stage | 0.004 | 6.511 (1.817 – 23.324) |
| Gender | 0.170 | 5.160 (0.495 – 53.797) |
| Year of diagnosis | 0.251 | 1.444 (0.771 – 2.703) |
| Radiotherapy | 0.778 | 0.710 (0.066 – 7.640) |
| Race | 0.451 | 1.645 (0.450 – 6.006) |
| Age at diagnosis | 0.319 | 1.147 (0.876 – 1.504) |
Discussion
We reviewed 1,452 cases of retinoblastoma in the United States between 1973 and 2009 contained within the SEER database. This study builds on prior epidemiological analyses by observing associations between retinoblastoma tumor features such as tumor stage, pathological grade, and laterality with patient characteristics such as age at diagnosis, overall survival, and second malignancies. While most cases were diagnosed before age two years, there was no apparent effect on overall survival according to age at diagnosis. Overall survival increased during the latter two-thirds of the study interval. There was a nearly equal distribution of cases among males and females, with no difference in overall survival according to gender. Higher-grade tumors were associated with decreased survival; grade 1 tumors demonstrated better overall survival than grade 3 and grade 4 tumors in univariate analyses. The bilateral retinoblastoma cohort exhibited decreased overall survival and an increased incidence of second non-ocular malignancies, most notably pineoblastoma and osteosarcoma, compared with patients having unilateral tumors. The incidence of pineoblastoma in patients with bilateral retinoblastoma in this study (1%) is identical to that observed by Ramasubramanian and colleagues. 14 The incidences of all malignancies of the brain (1.2%) and limb-bone tumors (1.9%) in bilateral retinoblastoma patients in this study are comparable to reports by Abramson and Frank.15
This patient cohort exhibited a number of significant trends in age at diagnosis, tumor grade, and tumor laterality. Smaller tumors and the lowest grade lesions were associated with younger age at diagnosis; this likely reflects the natural history of retinoblastoma tumor growth, whereby earlier diagnosis detected smaller and relatively well-differentiated tumors. Bilateral tumors were diagnosed at a younger age in comparison to patients with unilateral lesions. Possible explanations include temporal differences in the initiation or growth rate of tumors arising from germline versus somatic mutations, more effective and earlier screening in hereditary cases,16 or differences in the onset of signs and symptoms of retinoblastoma in bilateral and unilateral disease. Cases diagnosed prior to 1986 in this cohort exhibited decreased overall survival compared with cases diagnosed in the subsequent temporal strata. This may reflect improved screening paradigms with earlier detection, and subsequent treatment of earlier stage lesions, leading to improved survival; this is consistent with our finding that lower T stage associated with increased survival. Another possibility is changes in treatment paradigms leading to increased survival. We also observed a decrease in the proportion of high-grade tumors over the study interval. Earlier detection of tumors may identify lesions at a more well-differentiated state (lower grade), and this could also potentially account for the improvement in overall survival during the study interval. Other alternatives include environmental factors and evolving patterns of lesion severity underlying the observed change in the proportion of high-grade tumors over time. We were surprised by the trend in tumor grade; given the shift away from enucleation in recent decades, we hypothesized that a greater proportion of tumors with accompanying histologic data would have been characterized as high-grade lesions in recent years, as enucleation is now performed for more advanced-stage cancers. There has been a marked decrease in the utilization of radiotherapy for this malignancy over the last four decades in favor of chemotherapy and local ablative treatment of lesions. Detailed characterization of these treatment modalities is not readily available via SEER and thus beyond the scope of this study.
In the Cox proportional hazards regression model, only bilateral disease and advanced T stage were significant risk factors for decreased survival. Although Wong et al.17 revealed potential discrepancies in the incidence of retinoblastoma between races in the SEER dataset, multivariate analysis did not demonstrate race as a significance covariate in predicting patient overall survival in our study. While Abramson et al.18 have described a correlation between age at diagnosis and development of new ocular tumors, age at diagnosis was not associated with overall survival in this cohort. It is important to note that the AJCC TNM staging system is not the most commonly utilized retinoblastoma classification system by ocular oncologists, and the 6th edition of this classification used by the SEER database is outdated, with slight revisions in the more recent 8th edition. T staging in this system is predicated upon tumor size and involvement of ocular structures, and our findings support the prognostic value of the AJCC sixth edition staging scheme.
The limitations of this study relate primarily to the use of cancer registry data from an epidemiologic dataset such as SEER. Clinical findings from registry data are not available for examination by the investigator; disease staging and tumor grading assigned to each case were not independently verifiable. Nonetheless datasets such as SEER confer the ability to assess and detect trends in relatively rare diseases such retinoblastoma, from multiple treatment centers and across geographic regions, which are can not be discerned by other means.
Conclusion
The current study demonstrated that overall survival in retinoblastoma increased during the latter two-thirds of the study interval. Smaller tumors, bilateral retinoblastoma, and the lowest grade lesions were associated with younger age at diagnosis. While there was a decrease in the proportion of high-grade tumors over the study interval, we did not observe a decrease in the mean age at diagnosis. T4-stage tumors were associated with decreased survival in comparison to lower-stage lesions. Bilateral retinoblastoma was associated with decreased overall survival and an increased incidence of second, non-ocular malignancies, most notably pineoblastoma and osteosarcoma, compared with unilateral retinoblastoma. There has been a marked decrease in the utilization of radiotherapy for retinoblastoma over the last four decades. These findings represent additional prognostic information that aid in counseling families of patients with retinoblastoma, and may serve to guide therapeutic intervention, research, and assessment of new therapeutics in patients with retinoblastoma.
Acknowledgments
Funding/Support: This work was supported in part by NIH grant 1K12EY021475-01 and an Unrestricted Departmental grant from the Research to Prevent Blindness, New York, NY 10022
Other Acknowledgments: This study used the SEER database. The interpretation and reporting of these data are the sole responsibility of the authors. The authors acknowledge the efforts of the Surveillance, Epidemiology, and End Results (SEER) Program tumor registry.
Footnotes
Publisher's Disclaimer: This is a PDF file of an unedited manuscript that has been accepted for publication. As a service to our customers we are providing this early version of the manuscript. The manuscript will undergo copyediting, typesetting, and review of the resulting proof before it is published in its final citable form. Please note that during the production process errors may be discovered which could affect the content, and all legal disclaimers that apply to the journal pertain.
Financial Disclosures: None (MTA, FYC, MJS, YIL)
Contributions of Authors: design and conduct of the study (MTA, YIL); collection, management, analysis, and interpretation of the data (MTA, FYC, MJS, YIL); preparation, review, and approval of the manuscript (MTA, FYC, MJS, YIL)
Conflicts of interest: None
References
- 1.Devesa SS. The incidence of retinoblastoma. Am J Ophthalmol. 1975;80(2):263–5. doi: 10.1016/0002-9394(75)90143-9. [published Online First: 1975/08/01] [DOI] [PubMed] [Google Scholar]
- 2.Tamboli D, Topham A, Singh N, et al. Retinoblastoma: A SEER Dataset Evaluation for Treatment Patterns, Survival, and Second Malignant Neoplasms. Am J Ophthalmol. 2015;160(5):953–8. doi: 10.1016/j.ajo.2015.07.037. [DOI] [PubMed] [Google Scholar]
- 3.Chan HS, Gallie BL, Munier FL, et al. Chemotherapy for retinoblastoma. Ophthalmol Clin North Am. 2005;18(1):55–63. viii. doi: 10.1016/j.ohc.2004.11.002. doi: S0896-1549(04)00147-6 [pii] 10.1016/j.ohc.2004.11.002 [published Online First: 2005/03/15] [DOI] [PubMed] [Google Scholar]
- 4.Gallie BL, Budning A, DeBoer G, et al. Chemotherapy with focal therapy can cure intraocular retinoblastoma without radiotherapy. Arch Ophthalmol. 1996;114(11):1321–8. doi: 10.1001/archopht.1996.01100140521001. [published Online First: 1996/11/01] [DOI] [PubMed] [Google Scholar]
- 5.Abramson DH, Dunkel IJ, Brodie SE, et al. A phase I/II study of direct intraarterial (ophthalmic artery) chemotherapy with melphalan for intraocular retinoblastoma initial results. Ophthalmology. 2008;115(8):1398–404. 404 e1. doi: 10.1016/j.ophtha.2007.12.014. doi: S0161-6420(07)01359-0 [pii] 10.1016/j.ophtha.2007.12.014 [published Online First: 2008/03/18] [DOI] [PubMed] [Google Scholar]
- 6.Wong JR, Morton LM, Tucker MA, et al. Risk of subsequent malignant neoplasms in long-term hereditary retinoblastoma survivors after chemotherapy and radiotherapy. Journal of clinical oncology : official journal of the American Society of Clinical Oncology. 2014;32(29):3284–90. doi: 10.1200/JCO.2013.54.7844. [DOI] [PMC free article] [PubMed] [Google Scholar]
- 7.Gobin YP, Dunkel IJ, Marr BP, et al. Intra-arterial chemotherapy for the management of retinoblastoma: four-year experience. Arch Ophthalmol. 129(6):732–7. doi: 10.1001/archophthalmol.2011.5. doi: archophthalmol.2011.5 [pii] 10.1001/archophthalmol.2011.5 [published Online First: 2011/02/16] [DOI] [PubMed] [Google Scholar]
- 8.Shields CL, Ramasubramanian A, Rosenwasser R, et al. Superselective catheterization of the ophthalmic artery for intraarterial chemotherapy for retinoblastoma. Retina. 2009;29(8):1207–9. doi: 10.1097/IAE.0b013e3181b4ce39. 00006982-200909000-00024 [pii] [published Online First: 2009/09/08] [DOI] [PubMed] [Google Scholar]
- 9.Broaddus E, Topham A, Singh AD. Incidence of retinoblastoma in the USA: 1975–2004. Br J Ophthalmol. 2009;93(1):21–3. doi: 10.1136/bjo.2008.138750. doi: bjo.2008.138750 [pii] 10.1136/bjo.2008.138750 [published Online First: 2008/07/16] [DOI] [PubMed] [Google Scholar]
- 10.Broaddus E, Topham A, Singh AD. Survival with retinoblastoma in the USA: 1975–2004. Br J Ophthalmol. 2009;93(1):24–7. doi: 10.1136/bjo.2008.143842. doi: bjo.2008.143842 [pii] 10.1136/bjo.2008.143842 [published Online First: 2008/08/23] [DOI] [PubMed] [Google Scholar]
- 11.Abramson DH, Giovinazzo V, Servodidio CA, et al. Visual fields in a successfully radiated retinoblastoma patient. Journal of ophthalmic nursing & technology. 1992;11(1):17–9. [PubMed] [Google Scholar]
- 12.Percy CL, Van Holten V, Muir CS, et al. International classification of diseases for oncology. 2. Geneva: World Health Organization; 1990. [Google Scholar]
- 13.Greene FL American Joint Committee on Cancer., American Cancer Society. AJCC cancer staging manual. 6. New York: Springer-Verlag; 2002. [Google Scholar]
- 14.Ramasubramanian A, Kytasty C, Meadows AT, et al. Incidence of pineal gland cyst and pineoblastoma in children with retinoblastoma during the chemoreduction era. Am J Ophthalmol. 156(4):825–9. doi: 10.1016/j.ajo.2013.05.023. doi: S0002-9394(13)00360-7 [pii] 10.1016/j.ajo.2013.05.023 [published Online First: 2013/07/24] [DOI] [PubMed] [Google Scholar]
- 15.Abramson DH, Frank CM. Second nonocular tumors in survivors of bilateral retinoblastoma: a possible age effect on radiation-related risk. Ophthalmology. 1998;105(4):573–9. doi: 10.1016/S0161-6420(98)94006-4. discussion 79–80. doi: S0161-6420(98)94006-4 [pii] 10.1016/S0161-6420(98)94006-4 [published Online First: 1998/04/17] [DOI] [PubMed] [Google Scholar]
- 16.Rothschild PR, Levy D, Savignoni A, et al. Familial retinoblastoma: fundus screening schedule impact and guideline proposal. A retrospective study. Eye (Lond) 25(12):1555–61. doi: 10.1038/eye.2011.198. doi: eye2011198 [pii] 10.1038/eye.2011.198 [published Online First: 2011/09/17] [DOI] [PMC free article] [PubMed] [Google Scholar]
- 17.Wong JR, Tucker MA, Kleinerman RA, et al. Retinoblastoma incidence patterns in the US Surveillance, Epidemiology, and End Results program. JAMA ophthalmology. 2014;132(4):478–83. doi: 10.1001/jamaophthalmol.2013.8001. [DOI] [PubMed] [Google Scholar]
- 18.Abramson DH, Greenfield DS, Ellsworth RM. Bilateral retinoblastoma. Correlations between age at diagnosis and time course for new intraocular tumors. Ophthalmic paediatrics and genetics. 1992;13(1):1–7. doi: 10.3109/13816819209070046. [DOI] [PubMed] [Google Scholar]


