

Abstract
Magnetic resonance imaging (MRI) is a powerful technique for observing the function of specific cells and molecules inside living organisms. However, compared to optical microscopy, in which fluorescent protein reporters are available to visualize hundreds of cellular functions ranging from gene expression and chemical signaling to biomechanics, to date relatively few such reporters are available for MRI. Efforts to develop MRI-detectable biomolecules have mainly focused on proteins containing or transporting paramagnetic metals for T1 and T2 relaxation enhancement or large numbers of exchangeable protons for chemical exchange saturation transfer. While these pioneering developments established several key uses of biomolecular MRI, such as imaging of gene expression and functional biosensing, they also revealed that low molecular sensitivity poses a major challenge for broader adoption in biology and medicine. Recently, new classes of biomolecular reporters have been developed based on alternative contrast mechanisms, including enhancement of spin diffusivity, interactions with hyperpolarized nuclei, and modulation of blood flow. These novel reporters promise to improve sensitivity and enable new forms of multiplexed and functional imaging.
Keywords: Magnetic resonance imaging (MRI), contrast agents, biomolecular reporters, diffusion, hyperpolarization
Graphical abstract
1. Introduction
The ability to image the function of specific cells and molecules within the context of living mammalian organisms is critical for basic biological studies and the development of cellular and genetic therapeutics. Magnetic resonance imaging (MRI) is ideally suited to provide this capability due to its ability to image whole organs and animals non-invasively with high spatial and temporal resolution. However, unlike optical imaging, which has access to a multitude of biomolecular reporters to visualize specific aspects of cellular function, MRI is still in its infancy with regard to its repertoire of biomolecular tools. Over the past 20 years, efforts to develop such tools have primarily focused on biomolecules embodying the properties of synthetic contrast agents, such as paramagnetic ions, superparamagnetic nanoparticles, and chemical exchange substrates, or on causing the accumulation of these synthetic agents in cells, thereby altering the magnetic resonance signal of water protons or other nuclei in their vicinity. These biomolecular reporters have enabled the visualization of previously invisible processes using MRI, such as gene expression, cell migration, and neurotransmission. In addition, they have enabled the use of advanced protein engineering techniques, including directed evolution, to develop dynamic sensors capable of transducing time-varying biochemical signals into MRI contrast changes for real-time functional imaging. Despite these advances, the broader adoption of these technologies by the biomedical community has been hindered by important limitations of these reporters, including their relatively low molecular sensitivity and requirement of metal or synthetic cofactors.
Recently, new biomolecular contrast mechanisms have been introduced that attempt to overcome these limitations, including proteins that act on hyperpolarized nuclei, alter water transport and modify hemodynamics. Notably, some of these new mechanisms are uniquely enabled by biomolecules; that is, they would be impossible or difficult to implement with synthetic agents. The goal of this review is to briefly describe the new classes of biomolecular reporters, place them within the quantitative context of existing contrast mechanisms, and provide an outlook for future developments.
2. Quantitative framework
A key focus of this review is the molecular sensitivity of biomolecular reporters, which we define as the minimal concentration of the reporter that must be present in a voxel to achieve an acceptable level of contrast. While this depends on several factors, including field strength, the overall signal-to-noise ratio (SNR) and the properties of background tissue, we will examine performance under “typical” conditions for conventional small animal 1H imaging – the primary arena for biomolecular reporter development. Given an SNR of 400 (corresponding to a typical spin echo-based image acquisition sequence at 7 T with 10 averages and an isotropic voxel size of 300 µm, adapted from [1]), a reporter would have to increase or decrease the signal in a voxel by 1.25% to achieve a contrast-to-noise ratio (CNR) of 5 (i.e. 1.25% of 400). This CNR is sufficient to detect reporter-based contrast relative to tissue [2]. The minimal reporter concentration needed to achieve this CNR will serve as our basis for comparing the reporter classes described in the following sections and shown in Table 1. Given the wide range of molecular weights encompassed by biomolecular MRI reporters, as well as the inherent dependence of certain contrast mechanisms on molecular size, both molar and mass-based estimates are useful for reporter comparison. Hence, in addition to asking “how many molecules must a cell make” to produce visible contrast (in µM), we also ask “how much total protein mass must a cell make” for this purpose (in µg/mL). Calculations are further explained in the Appendix.
Table 1.
Mechanisms of Biomolecular MRI Contrast
| Mechanism | Example | Approximate Detection Limit |
Advantages | Disadvantages |
|---|---|---|---|---|
|
| ||||
| T1 | P450-BM3 [9] | 14 µM | Readily engineered as molecular sensors | Metal requirement |
| 700 µg/mL | ||||
|
| ||||
| T2 | Ferritin [25, 26, 114–116] | 84 nM | Relatively sensitive | Metal requirement |
| 40 µg/mL | Background T2 contrast | |||
|
| ||||
| CEST | LRP [33] | 2.5 µM | No metal requirement | Background CEST from proteins in tissue |
| 81 µg/mL | ||||
| (assuming no background CEST) | Multiplexing | |||
|
| ||||
| Accumulation & Activation | TIMD2 [46] | Unknown | Sensitivity due to amplification | Requires exogenous contrast agent |
| Pharmacokinetically limited | ||||
|
| ||||
| Diffusion | AQP1 [56] | 500 nM | No metal requirement | High background in some tissues |
| 14 µg/mL | Autologous | |||
|
| ||||
| HyperCEST | Gas Vesicles [92] | 10 pM | Molar sensitivity due to hyperpolarization | Requires hyperpolarized xenon delivery |
| 4 µg/mL | Multiplexing | |||
|
| ||||
| Hemodynamics | CGRP [101] | 10 nM | Sensitivity due to amplification | Background contrast and unknown long-term effects |
| 53 ng/mL | Potentially fast kinetics | |||
3. Established Mechanisms of Biomolecular MRI: T1, T2, CEST, Accumulation and Activation
We start by briefly describing the established classes of biomolecular MRI reporters as background for our discussion of new mechanisms. Interested readers may also consult several excellent reviews [3–8].
3.1. T1 Reporters
Biomolecular T1 agents are typically metalloproteins containing iron or manganese cofactors [9–11], which produce relaxation enhancement via a predominantly inner-sphere dipole-dipole mechanism, achieving relaxivity (rCA as defined in Eq. A4 and Table 3 of the Appendix) on the order of single mM−1 s−1 (Fig. 1a). In addition to acting as reporters, metalloproteins can be engineered as molecular sensors, wherein the binding of specific ligands occludes water coordination to the metal ion, resulting in reduced relaxivity. For example, the bacterial cytochrome P450-BM3 contains a heme-bound Fe(III) atom, which produces T1 contrast with a relaxivity of 1.4 mM−1 s−1 at 4.7 T. A catalytically-inactive version of this protein was engineered by Shapiro et al. using directed evolution to bind the neurotransmitter dopamine and thereby act as a sensor of this neurotransmitter [9]. This sensor and its derivatives have been applied to studying dopamine and serotonin release and reuptake in rodent brains [12, 13].
Table 3.
List of assumed parameters
| S. No. | Variable | Definition | Value |
|---|---|---|---|
| 1 | R1,bkgr | Background T1 relaxation rate in the absence of contrast agent | 0.67 s−1 |
| 2 | rCA | T1 or T2 relaxivity of contrast agent | 1 mM−1 s−1 (T1) 3000 mM−1 s−1 (T2) |
| 3 | R2,bkgr | Background T2 relaxation rate in the absence of contrast agent | 20 s−1 |
| 4 | xH2O | Concentration of water in tissues | 38.5 M |
| 5 | nCA | Number of exchangeable protons in CEST agent | 200 |
| 6 | α | Saturation efficiency in CEST imaging | 1 |
| 7 | kCA→w | Exchange rate of protons from CEST agent to bulk water | 1 kHz |
| 8 | T1 | Longitudinal relaxation time of water | 1.5 s |
| 9 | tsat | CEST saturation time | 1.5 s |
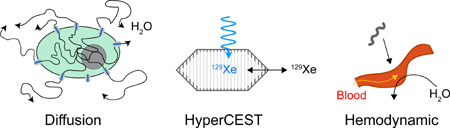
Figure 1. Mechanisms of Biomolecular MRI Contrast.

(a) T1 reporters include proteins containing paramagnetic metal ions such as iron or manganese. (b) T2 reporters include proteins biomineralizing iron oxide nanoparticles. (c) CEST reporters include proteins with large numbers of exchangeable protons. (d) Accumulation and activation-based reporters transport, trap or catalytically activate exogenous contrast agents. (e) Diffusion based reporters are proteins that facilitate the exchange of water across the cell membrane. (f) HyperCEST reporters contain chemically distinct binding sites for xenon. (g) Hemodynamic reporters act on the vasculature to increase local blood flow.
A significant limitation of existing biomolecular T1 reporters and sensors is their modest relaxivity, in the range of 1–2 mM−1 s−1. For a 1.25% change in signal in a T1-weighted image (with a background T1 of 1.5 s), ~ 14 µM concentration of the reporter (~ 700 µg/ml for a 50 kDa protein such as the dopamine sensor [9]) is needed to produce the required 0.01 s−1 relaxation enhancement. This concentration may be difficult to achieve through heterologous expression, especially given the need to load the protein with metal ions and/or additional co-factors such as heme groups. Nevertheless, the ability to engineer these proteins as functional sensors has made them useful as injectable imaging agents that are expressed and purified separately.
Efforts to improve relaxivity have focused on identifying proteins with higher-spin metals, including Mn2+ [10], and exchanging natural metals with higher-spin alternatives including Mn2+ and Gd3+ [14, 15]. In theory, if appropriate proteins can be engineered, and issues with metal bioavailability can be solved, the molecular sensitivity could improve, especially for imaging conducted at lower field strengths [16].
3.2. T2 Reporters
One of the first biomolecular MRI reporters to be used in mammals was ferritin, an iron storage protein that biomineralizes a ferrihydrite core with up to 4,500 iron atoms inside a 12 nm diameter protein shell (Fig. 1b). The ferritin core is magnetic, allowing the protein to produce T2 or T2* contrast, although a theoretical understanding of this contrast mechanism is incomplete [17]. Since its development as a reporter, ferritin has been used in several studies to monitor cell migration or gene expression. In addition, ferritin-based sensors have been engineered to produce enhanced T2 relaxation in response to analytes such as protein kinase A through a clustering mechanism [18]. The quantitative sensitivity of ferritin depends on its loading level, which is typically ~ 2,500 iron atoms per particle, which provide a relaxivity at 7 T of 1.28 mM−1 s−1 in terms of iron or 3,000 mM−1 s−1 in terms of ferritin particles [19]. To produce a 1.25% signal change on top of a typical 50 ms tissue T2, a relaxation enhancement of ~ 0.25 s−1 requires a relatively low ferritin particle concentration of 84 nM and a protein mass of ~ 40 µg/mL (given a total molecular weight of ~ 480 kDa for ferritin). However, a significant challenge with T2 reporters is the specificity of their contrast, since multiple sources of magnetic susceptibility differences, such as blood and air compartments, exist inside tissues [20, 21]. These can confound the assignment of hypointense regions on T2 images. Signal changes significantly larger than 1.25%, and concomitantly higher concentrations of ferritin, may therefore be required to confidently locate the reporter in certain tissues. This may be challenging, since even 84 nM ferritin already represents an iron concentration of ~ 210 µM, which may not be achievable in all tissues. Additionally, the relaxivity of ferritin and other magnetic materials in tissues has a strong dependence on their subcellular spatial arrangement [22].
Significant room for improvement exists in the sensitivity of biomolecular T2 reporters when they are compared to synthetic iron oxide nanoparticles and biogenic magnetite from magnetotactic bacteria, which have relaxivities on the order of 100 mM−1 s−1. Indeed, purified ferritin loaded with a superparamagnetic iron core in vitro under high temperature and alkaline pH, has a more than 100-fold stronger per-iron relaxivity compared to natural ferritin [23]. However, magnetite/maghemite mineralization in mammalian cells or bacteria, other than magnetotactic bacteria or their close relatives [24], has not been reported, and is challenging due to the strict chemical conditions required for such mineralization. Recent attempts to engineer or evolve ferritin have resulted in particles with somewhat stronger MRI contrast, but no evidence of minerals other than ferrihydrite [25–27]. Other biomolecular T2 reporters that may interest the reader include hemoglobin [28], tyrosinase [29], and mms6 [30].
3.3. Chemical Exchange Saturation Transfer (CEST) Reporters
Another pioneering form of biomolecular MRI, CEST imaging, takes advantage of the abundance of exchangeable protons on the protein backbone and amino acid side chains (Fig. 1c). By applying radiofrequency saturation at the chemical shift of these protons while they exchange with surrounding water, a fraction of the aqueous proton pool becomes depolarized, thereby producing contrast. Although this exchange also takes place with endogenous proteins present in tissue, the overexpression of proteins containing large numbers of proton-exchangeable amino acids, such as lysine-rich protein or human protamine 1, can generate significant contrast above background [31–33]. Molecular sensitivity is further aided by the fact that each protein contains hundreds of exchangeable protons. An additional feature of biomolecular CEST reporters is their potential for multiplexed imaging, which can be accomplished using poly-amino acids (such as poly-lysine and poly-arginine) that have exchangeable proton signals at specific chemical shifts [34].
The molecular sensitivity of CEST reporters is limited by the proton exchange rate, which must be slow compared to their chemical shift difference from water, Δω, for efficient saturation transfer [35–37], but faster than T1 or T2 relaxation. With a typical exchange rate on the order of 1 kHz, 200 exchangeable groups, and a saturation time comparable to T1, the 1.25% signal change detection limit under ideal saturation conditions should be on the order of 2.5 µM (or ~ 80 µg/mL protein assuming a molecular weight of 32 kDa as for poly-lysine [33]). However, in in vivo applications, biomolecular CEST agents must also overcome background CEST contrast from endogenous proteins, making their detection at such low concentrations more difficult. Despite this limitation, protein-based CEST reporters have been used in several in vivo applications, and innovative pulse sequences and processing schemes have been developed to help maximize reporter-specific contrast [38–40].
3.4. Accumulation or Activation Reporters
In addition to biomolecular MRI reporters that act directly on nuclei, it is also possible to generate MRI contrast indirectly via biomolecules that locally trap or activate exogenous contrast agents (Fig. 1d). This mechanism represents a form of amplification because each biomolecular reporter can transport or chemically modify multiple contrast agents, each of which then interacts with nuclei. Indeed, the earliest examples of biomolecular reporters for magnetic resonance belong to this category. In 1990, Koretsky et al. showed that overexpression of creatine kinase led to accumulation of phosphocreatine, which could be detected with 31P NMR [41]. Another early example was beta galactosidase, which cleaves a sugar group from a specially designed Gd3+ chelate, thereby unblocking water accessibility and increasing T1 relaxivity [42]. Other reporters have been based on proteins that transport paramagnetic species such as Mn2+[11], gadolinium chelates [43], transferrin [44, 45] or ferritin [46] into cells or trap small molecule CEST reporters [47]. Alternatively, proteins have been engineered to display biotin on the cell surface, allowing binding and accumulation of an inorganic imaging agent linked to a biotin-binding protein such as streptavidin or transferrin [48, 49].
Since each protein potentially leads to accumulation of many contrast-generating molecules, reporters acting through amplified mechanisms can reach a high level of molecular sensitivity, and are therefore likely to find many uses. Their key limitations reflect the need to administer an exogenous agent prior to read-out, with concomitant pharmacokinetics and toxicity profiles, and the potential difficulty of interpreting quantitatively the resulting contrast with regard to biomolecule concentration. In addition, amplification introduces substrate accumulation or activation kinetics into the temporal performance of these reporters, making it more difficult to engineer them as dynamic sensors.
4. Emerging Mechanisms of Biomolecular MRI: Diffusion, Hyperpolarization, and Hemodynamics
4.1. Diffusion based Reporters
One of the newest additions to biomolecular MRI is the use of water-permeable membrane channels as reporter genes for diffusion weighted imaging (DWI) (Fig. 1e). DWI is a widely-used technique in anatomical imaging, in which diffusion weighting is commonly achieved by applying a pair of pulsed magnetic field gradients, which dephase nuclear spins in proportion to how far they diffuse during a defined period [50–52]. Accordingly, water molecules that diffuse more freely have more severely dephased proton spins and appear darker in DWI. In biological tissues, the effective diffusivity of water depends on multiple parameters, including the local diffusivity in intracellular and extracellular compartments, the relative volume fraction occupied by cells, and the exchange rate of water across the plasma membrane [53–55].
In light of the importance of transmembrane diffusion, it was recently proposed that facilitating water exchange across the membrane by overexpressing water-permeable channels would result in enhanced contrast in DWI or more specialized sequences [56, 57]. The most natural class of molecules for achieving this goal is aquaporins, a highly conserved family of tetrameric integral membrane proteins that mediate the selective exchange of water molecules across the plasma membrane in a wide range of cell types [58–63]. In 2016, Mukherjee et al. demonstrated that mammalian cells engineered to overexpress the human gene aquaporin 1 (AQP1) using lentiviral vectors could be visualized by DWI in vitro and in tumor xenografts in mice (Fig. 2a, b). Strikingly, expression in cultured cells at concentrations as low as 500 nM (or 14 µg/mL for the 28 kDa aquaporin protein) resulted in changes in the apparent diffusion coefficient (ADC) of 50% [56].
Figure 2. Diffusion-based Reporters.

(a) Diffusion weighted images of mammalian cells expressing AQP1 and GFP (negative control) acquired using Δeff = 298 ms and b-values of 2089 s/mm2 (CHO), 1000 s/mm2 (U87), and 800 s/mm2 (N2a) (b) Left: Experimental approach for establishing bilateral tumor xenografts, inducing transgene expression with doxycycline (dox), and acquiring diffusion-weighted images. Right: Representative diffusion weighted image of a horizontal section of the mouse brain 48 hours after dox injection. Inset shows a diffusion weighted image of the same mouse brain prior to dox induction. Images were acquired using Δeff = 98 ms and b = 1000 s/mm2 (c) Monte Carlo simulations of water diffusion in cells show an increase in apparent diffusion coefficient (ADC) with increasing cell membrane permeability and at long diffusion times (Δeff) that is achieved using stimulated echo DWI (d) Increase in ADC in CHO, U87, and N2a cells relative to control cells expressing GFP, measured at Δeff = 398 ms. Adapted with permission from [56].
Making aquaporin work as a sensitive reporter gene required the use of a stimulated echo DWI sequence rather than standard spin echo DWI [53, 64]. This is because longer timescales are needed for water molecules to encounter membranes as a diffusion barrier (Fig. 2c). The key pulse sequence parameter driving this interaction is known as Δ, which needs to be 100 ms or longer to produce pronounced aquaporin-dependent contrast, whereas in typical DWI, Δ ~ 10 ms. This dependence was examined in detail via Monte Carlo simulations and experiments (Fig. 2c). At Δ = 398 ms, an ADC change of more than 180% was measured in cells expressing AQP1 under a strong inducible promoter (Fig. 2d). Another parameter potentially affecting this contrast mechanism concerns the fraction of cells in a tissue that overexpresses aquaporin. For instance, one might imagine that a highly permeable cell surrounded by impermeable cells would have negligible influence on overall diffusivity. Interestingly, simulations and experiments both showed that while a non-linear relationship indeed exists between expressing fraction and overall contrast, sub-populations as small at 10% can be visualized. Based on their high sensitivity and functionality in mixed populations, aquaporins should be useful for genetically labeling cell-based therapeutics to track them in the context of animal models and potentially in human patients.
Aquaporin overexpression is non-toxic, as shown in three cell lines and tumor xenografts engineered to overexpress aquaporins [56]. This is not surprising, since aquaporins such as AQP1 are highly selective for water, which they simply allow to diffuse back and forth across the cell membrane under the osmotically balanced conditions existing in all but a few body organs. Two further advantages of this class of reporter genes are that it requires no metals or exogenously administered contrast agents and can be autologous to the host species, reducing concerns about reporter immunogenicity. In addition, aquaporin produces contrast orthogonal to paramagnetic and CEST reporters, potentially allowing multiplexing. Furthermore, the wide variety of aquaporin genes present across all domains of life opens the door to engineering improved and potentially functional biomolecular reporters.
One limitation of aquaporin as a reporter gene is the variation in endogenous water diffusivity across tissue types, driven by factors such as cell size and density, as well as native expression of aquaporins. Tissues with inherently low water diffusivity are the most suitable for imaging with aquaporins, provided that the aquaporin reporter gene can be delivered and expressed in the tissue using established approaches for gene delivery such as viral vectors. For instance, tumors, with their dense cellularity and low background diffusion, are ideal tissues to express aquaporin reporters to image gene expression in preclinical animal models, while the brain, with its comparatively lower cellularity and inherently high aquaporin expression in glia, has a more diffusive background making the detection of aquaporin overexpression more challenging. These issues may be partially addressed with pulse sequence development; for example, acquiring DWI images at multiple values of Δ would help distinguish contrast based on cell permeability from contrast based on morphology. In addition, animal models involving genetic knockdown of endogenous aquaporins [62, 63] may be used to reduce native aquaporin expression to generate local contrast in high-expressing tissues.
In addition to aquaporin, a separate study recently reported that the urea transporter (UT-B) could also be used as a reporter gene based on its ability to increase the permeability of cell membranes [57]. In addition to urea, UT-B is able to transport water at rates similar to aquaporin. UT-B expression was visualized using a filter-exchange imaging (FEXI) sequence, in which a pulsed gradient is first used to dephase fast-diffusing extracellular water, then a variable time is given for exchange of water from this compartment with the slower-diffusing cytoplasmic water, after which a second diffusion-weighting is applied to measure the apparent diffusivity. Membrane permeability results in faster exchange between the compartments, allowing the ADC to return to equilibrium more quickly. Using this sequence, the apparent exchange rate between the two compartments increased by up to ~ 100% with UT-B expression in vitro, and it was possible to image gene expression in vivo. Notably, no significant changes in ADC were measured in cells expressing UT-B, which is likely due to the study’s use of a spin echo DWI sequence with a short Δ.
4.2. Reporters for hyperpolarized MRI
Among the recent breakthroughs in molecular MRI is hyperpolarization - the preparation of nuclear spins in nonequilibrium states of high magnetization. This technology directly addresses the relatively low sensitivity of MRI, which is fundamentally due to the weakness of the interaction of nuclear spins with the applied magnetic field relative to Boltzmann energy. Hyperpolarization can be performed via several methods, including dynamic nuclear polarization (DNP) [65, 66], symmetry-breaking chemical reactions with parahydrogen [67–69], and gas phase collisional spin exchange with optically excited alkalis [70–72], resulting, in the most favorable cases, in polarization increases on the order of 10,000-fold compared to thermal equilibrium [73, 74]. Molecules hyperpolarized using these methods can then be introduced into in vitro specimens and in vivo organisms, where their nonequilibrium polarization has a lifetime governed by T1 [75–78]. Importantly, because of the much higher net magnetization, imaging can be performed at much lower nucleus concentrations. Hyperpolarized organic compounds, such as 13C-pyruvate and fumarate, are typically imaged in a single shot following injection into the body, revealing their transport and metabolism [79] (using chemical shift imaging), which can provide clinically valuable information about diseases such as cancer [76, 80] and renal disorders [77]. Similarly, hyperpolarized noble gases such as 129Xe can be delivered into the body repeatedly via inhalation, producing gas-phase contrast in the lungs and solution-phase contrast in perfused tissues.
The increased average signal of hyperpolarized nuclei naturally motivates the development of contrast agents acting on molecules containing such nuclei (Fig. 1f). In particular, the biocompatibility and renewable (via inhalation) magnetization of 129Xe, has made it an attractive target for contrast agent development. In 2006, a seminal study by Schröder et al. [81] showed that organic compounds designed to bind xenon and alter its chemical shift could produce MRI contrast at nanomolar concentrations using the hyperpolarized analog of CEST, named HyperCEST. In this technique, saturation is applied at the chemical shift of xenon in the chemical host, which is then transferred to aqueous xenon via chemical exchange. In addition to the strong, hyperpolarized starting signal, this technique benefits from the high specificity of the host-bound xenon’s chemical shift and its large separation (~ 100 ppm) from the aqueous peak. Several groups have developed innovative reporters and sensors based on Xe-binding hosts [82–86].
Initially, the prospect of developing analogous biomolecular HyperCEST reporters was considered remote due to the weak and short-lived interaction of xenon with most proteins [87–91]. However, in 2014 a study by Shapiro et al. showed that an unusual class of gas-filled protein nanostructures called gas vesicles (GVs) could interact with hyperpolarized xenon so as to produce HyperCEST contrast at picomolar concentrations [92]. GVs, which evolved in photosynthetic microbes as a means to regulate buoyancy, comprise hollow gas compartments with dimensions on the order of 250 nm, enclosed by a 2 nm-thick protein shell, which is permeable to gas but excludes liquid water [93, 94] (Fig. 3, a–b). The study showed that GVs can interact with xenon to produce HyperCEST contrast with peak saturation approximately 175 ppm upfield from dissolved 129Xe (Fig. 3, c–d). The large chemical shift separation enables the contrast to be extremely efficient, with a GV detection limit in the picomolar range (Fig. 3e), orders of magnitude lower than comparable proton contrast agents. Furthermore, GVs formed by different species of bacteria and archaea, in which these nanostructures differ in size and shape, produce HyperCEST saturation at different chemical shifts, thereby enabling multiplexed imaging. GVs have been shown to produce contrast as antibody-functionalized markers of cancer cells and as reporters of gene expression in E. coli.
Figure 3. HyperCEST Reporters.

(a) Diagram of a gas vesicle: a hollow gas-containing nano-compartment (solid shading) surrounded by a gas-permeable protein shell (ribbed shading). (b) Transmission electron micrographs of individual GVs purified from Halobacterium NRC-1 in their intact (left) and collapsed (right) state. (c) Diagram of 129Xe chemical exchange saturation transfer between bulk aqueous solvent (left) and GVs (hexagons) either in isolation or inside a cell (gray). (d) Frequency-dependent saturation spectra for intact (red) and collapsed (black) GVs. (e) Saturation contrast image of a three-compartment phantom containing 400pM GVs, 100pM GVs and buffer. Adapted with permission from [92, 113].
The development of GVs as biomolecular reporters for HyperCEST leads to several interesting avenues for further investigation. For example, it will be interesting to study how the chemical shift observed for different types of particles relates to their genetically encoded properties, including size, shape, clustering state and the amino acid composition of their shell. Also important are the quantitative parameters defining the efficiency of HyperCEST contrast, including the binding capacity of GVs for xenon and the rate of exchange with surrounding media, which can be studied using the quantitative HyperCEST methodology developed by Kunth et al. [95]. This will enable the development of optimal radiofrequency saturation parameters for the specific exchange rate of GVs, and open the door to further engineering at the molecular level.
In addition to GVs, other biological structures may be able to serve as HyperCEST agents. For example, bacterial spores, a dormant cellular state comprising a multi-layered structure of ~ 1.5 µm size, were recently demonstrated for HyperCEST at a chemical shift 4.5 ppm downfield from aqueous xenon [84]. In addition, using strong saturation to compensate for fast exchange, it is possible to perform HyperCEST based on chemical exchange between free xenon in solution and xenon bound to the small protein, beta-lactamase [85].
Besides 129Xe, other hyperpolarized molecules that have been paired with biomolecular reporters including 13C labeled molecules such as N-acetyl-L-methionine (paired with aminoacylase) [96], 3,5-difluorobenzyl-L-glutamic acid (paired with carboxypeptidase G2) [97], pyruvate (paired with pyruvate decarboxylase) [98], urea (DWI with urea transporter UT-B) [99], and 19F labeled substrates that interact with bovine trypsin [100].
Ultimately, the effectiveness of hyperpolarized reporters in vivo depends on the ability of their cognate nuclei to reach target tissues while retaining significant polarization. In the case of 129Xe, its solubility (Ostwald coefficient 0.14) and T1 half-life (~ 10 s) suggest that the concentration of hyperpolarized xenon in a vascularized tissue such as the brain in mice will be on the order of 100 µM (assuming breathing of a 50% mixture of half-polarized, isotopically enriched 129Xe). At this concentration, and correcting for the longer effective T1 time of polarization replenishment by inhalation, SNR is expected to be ~ 1% that of proton MRI, reducing overall spatial resolution. However, the molecular sensitivity will be sub-nanomolar. Assuming the need to saturate 66% of the signal over a timescale of T1, an exchange rate of 10 kHz and an occupancy of 1,000 xenon atoms per GV, this results in a detection limit of ~ 10 pM particles or 4 µg/mL protein. Translating HyperCEST to in vivo applications is a major focus of ongoing research.
4.3. Reporters modulating hemodynamics
Another recently introduced mechanism for biomolecular MRI involves peptides that act on smooth muscle cells to increase blood flow locally, resulting in blood oxygenation level dependent (BOLD) contrast [101] (Fig. 1g). Blood perfusion is naturally modulated in tissues based on metabolic demand via signaling molecules such as nitric oxide, and peptides such as the calcitonin gene related peptide (CGRP) [102, 103]. It was shown recently that local injection or cellular secretion of CGRP could elicit changes in BOLD contrast. Impressively, ~ 10 nM concentrations of this molecule were sufficient to produce this effect. CGRP can be considered a new kind of amplified reporter. Rather than acting directly on nuclear spins, it elicits a local change in the concentration of a paramagnetic contrast agent, in this case deoxyhemoglobin. However, unlike most other amplified reporters, no external administration of contrast agents is required, and kinetics can be rapid, since the blood flow can increase and decrease on a second timescale in response to appropriate signals. Furthermore, CGRP can be engineered as a molecular sensor, for example by incorporating autoinhibitory domains that become cleaved by proteases [101].
One potential limitation of hemodynamics-based reporters is the presence of active, fluctuating background signal in tissues such as the brain. However, this can be distinguished from reporter-induced signal by its kinetics or by inhibition of the background signaling. The potential effects of such inhibition, or of repeated or prolonged release of CGRP on physiology, also merit further study as this technology moves to broader adoption.
5. Outlook
The development of new classes of biomolecules that produce MRI contrast, such as water channels, vasomodulatory peptides, and gas vesicles is a significant step forward in expanding the capabilities of biomolecular MRI beyond the realm of conventional contrast mechanisms. Moving ahead, additional breakthroughs are possible through the discovery or engineering of biomolecules that leverage other emerging contrast mechanisms, which have thus far been limited to synthetic implementations. Notable examples include paramagnetic CEST (paraCEST) agents, parahydrogen-induced hyperpolarized molecules, and magnetic resonance energy transfer (MRET) -based sensors.
ParaCEST imaging achieves enhanced CEST sensitivity through the use of paramagnetic ions to induce large chemical shifts (50–100 ppm) in the resonance frequency of exchangeable protons, thereby enabling highly selective saturation and faster proton exchange compared with conventional CEST [36, 104]. Bioavailable metals such as iron [105], cobalt [106], and nickel [107] are well suited for paraCEST, which suggests that naturally occurring Ni, Co, and Fe-based metalloproteins could be developed as paraCEST reporter genes. Another approach to boost the sensitivity of MRI is parahydrogen induced polarization (PHIP) [68, 69]. In this technique, hyperpolarization is spontaneously transferred from the singlet parahydrogen spin state of H2 gas to a suitable substrate via chemical hydrogenation or reversible exchange at a catalytic site to achieve ~ 800 to 5000-fold gain in NMR signal for protons or heteronuclei (such as 13C, 15N, 19F) in the substrate molecule [67, 69]. Hyperpolarization transfer is typically achieved using solvent-phase catalysis with organometallic complexes, which has constrained the in vivo applicability of parahydrogen-based molecular imaging owing to toxicity concerns [108]. The development of biomolecular catalysts for aqueous phase hydrogenation or exchange-based transfer to polarize bioactive molecules in water would greatly simplify the translation of this highly sensitive MRI approach to living animals.
In addition to reporters, there is a great need for molecular sensors to dynamically interrogate cellular function. From this standpoint, new reporter proteins such as aquaporins and gas vesicles could serve as the basis for developing biomolecular sensors by leveraging tools and principles of protein engineering and synthetic biology [109], as has been done with T1, T2 and CEST-based sensors [9, 18, 32]. In addition, a new mechanism for modulating MRI contrast, called MRET [110], may provide another avenue towards dynamic MRI sensors analogous to optical reporters based on Förster resonance energy transfer (FRET). In MRET, T1 relaxation is tuned by controlling the nanoscale separation between a paramagnetic T1 enhancer (such as a synthetic Gd-chelate) and a superparamagnetic quencher nanoparticle (such as iron oxide). Reducing the distance between the paramagnetic enhancer and the quencher narrows the spectral density of electron spin fluctuations, leading to inefficient paramagnetic relaxation and longer T1 times [110]. The implementation of this concept in biomolecular sensors depends on first achieving biomineralization of strongly magnetic materials in cells. Biomolecular mineralization of super-paramagnetic materials would also enable their application for magnetic particle imaging (MPI) imaging, which has the potential to achieve background-free imaging with high sensitivity using direct detection of particle magnetization rather than water magnetic resonance [111, 112]. In summary, we envision that the evolution of future generations of sensitive biomolecular MRI reporters and cellular sensors will play a crucial role in expanding the scope of truly functional imaging in the context of living animals.
Highlights.
Biomolecular reporters are essential to enable MR imaging of cellular function
Several breakthrough concepts in biomolecular MRI reporters were recently developed
Water channel proteins serve as reporter genes for diffusion-weighted imaging
Gas-filled proteins produce contrast in hyperpolarized 129Xe MRI
Peptides altering blood flow produce locally enhanced hemodynamic contrast
Acknowledgments
Work in the Shapiro laboratory related to this article is supported by the Heritage Medical Research Institute, the Burroughs Wellcome Career Award at the Scientific Interface, the Pew Scholarship in the Biomedical Sciences, the Packard Fellowship for Science and Engineering, the Dana Foundation, the Human Frontier Science Program, the W.M. Keck Foundation and the National Institutes of Health (U54CA199090A). AM was supported by the James G. Boswell Postdoctoral Fellowship. PR was supported by a NSF Graduate Research Fellowship and the NIH Biotechnology Leaders Program.
Glossary
- ADC
Apparent Diffusion Coefficient
- AQP1
Aquaporin 1
- BOLD
Blood Oxygenation Level Dependent
- CEST
Chemical Exchange Saturation Transfer
- CGRP
Calcitonin Gene Related Peptide
- CNR
Contrast-to-Noise Ratio
- DNP
Dynamic Nuclear Polarization
- DWI
Diffusion Weighted Imaging
- FEXI
Filter Exchange Imaging
- FRET
Förster Resonance Energy Transfer
- GV
Gas Vesicle
- HyperCEST
Hyperpolarized Chemical Exchange Saturation Transfer
- MPI
Magnetic Particle Imaging
- MRET
Magnetic Resonance Energy Transfer
- MRI
Magnetic Resonance Imaging
- ParaCEST
Paramagnetic Chemical Exchange Saturation Transfer
- PHIP
Parahydrogen Induced Polarization
- SNR
Signal-to-Noise Ratio
- UT-B
Urea Transporter
Appendix
Calculations assume a background signal-to-noise ratio (SNR) of 400, adapted from [1], and yield the reporter concentration needed to achieve a contrast-to-noise ratio (CNR) of 5 by producing a 1.25% change in signal [2] (see Tables 2 and 3 for lists of the various symbols and assumed parameters).
Table 2.
List of variables
| S. No. | Variable | Definition |
|---|---|---|
| 1 | Sbkgr | Background MRI signal in the absence of contrast agent |
| 2 | SCA | MRI signal in the presence of a contrast agent |
| 3 | R1,CA | T1 relaxation rate in the presence of contrast agent |
| 4 | TR, TR,opt | Repetition time, optimal repetition time |
| 5 | xCA | Concentration of T1, T2, or CEST agent |
| 6 | R2,CA | T2 relaxation rate in the presence of contrast agent |
| 7 | TE,TE,opt | Echo time, optimal echo time |
| 8 | PTR | Proton transfer ratio |
Concentration of T1 contrast agent needed to achieve a CNR of 5
The evolution of longitudinal magnetization in a T1-weighted experiment can be described using the following equation [117]:
| (A1) |
To achieve a CNR of 5, the T1 agent must enhance longitudinal magnetization by a factor of 1.25% relative to the background signal:
| (A2) |
| (A3) |
The relaxation rate in the presence of a contrast agent can be expressed by the following equation:
| (A4) |
Substituting the value of R1,CA from Eq. (A4) in Eq. (A3), we arrive at the following expression for contrast agent concentration:
| (A5) |
To calculate the optimal TR, we use Eq. (A6), which evaluates the TR that maximizes signal relative to background:
| (A6) |
Eq. (A5) and (A6) can be solved numerically to evaluate xCA which is the minimum concentration of the T1 agent needed to produce a 1.25% signal enhancement using an optimized TR time.
Concentration of T2 contrast agent needed to achieve a CNR of 5
A similar approach can be used to calculate the minimum concentration of T2 agent required to produce a 1.25% decrease in signal relative to background. In this case, dephasing of transverse magnetization from spin-spin interactions is described by the following equation [117]:
| (A7) |
To achieve a CNR of 5, the T2 agent must reduce the MRI signal by a factor of 1.25% relative to the background:
| (A8) |
The relaxation rate produced by a contrast agent can be approximated by the following equation:
| (A9) |
Substituting the value of R2,CA from Eq. (9) in Eq. (8), we arrive at the following expression for contrast agent concentration:
| (A10) |
To calculate the optimal TE, we use Eq. (11), which evaluates the TE that maximizes signal relative to background:
| (A11) |
Eq. (10) and (11) can be solved analytically to evaluate xCA which is the minimum concentration of the T2 agent needed to produce a 1.25% signal change using an optimal TE time.
Concentration of CEST agent needed to achieve a CNR of 5
Steady state proton transfer ratio for a CEST agent can be described using the following equation [35]:
| (A12) |
The minimum concentration of a CEST reporter required to achieve a signal change of 1.25% can be calculated directly from the above equation.
Footnotes
Publisher's Disclaimer: This is a PDF file of an unedited manuscript that has been accepted for publication. As a service to our customers we are providing this early version of the manuscript. The manuscript will undergo copyediting, typesetting, and review of the resulting proof before it is published in its final citable form. Please note that during the production process errors may be discovered which could affect the content, and all legal disclaimers that apply to the journal pertain.
COMPETING INTERESTS
The authors declare no competing financial interests.
References
- 1.DiFrancesco M, Rasmussen J, Yuan W, Pratt R, Dunn S, Dardzinski B, Holland S. Comparison of SNR and CNR for in vivo mouse brain imaging at 3 and 7T using well matched scanner configurations. Medical physics. 2008;35:3972–3978. doi: 10.1118/1.2968092. [DOI] [PMC free article] [PubMed] [Google Scholar]
- 2.Mills PH, Ahrens ET. Theoretical MRI contrast model for exogenous T2 agents. Magnetic resonance in medicine. 2007;57:442–447. doi: 10.1002/mrm.21145. [DOI] [PubMed] [Google Scholar]
- 3.Gilad AA, Winnard PT, van Zijl P, Bulte JW. Developing MR reporter genes: promises and pitfalls. NMR in biomedicine. 2007;20:275–290. doi: 10.1002/nbm.1134. [DOI] [PubMed] [Google Scholar]
- 4.Lee S-W, Lee S-H, Biswal S. Magnetic resonance reporter gene imaging. Theranostics. 2012;2:403–412. doi: 10.7150/thno.3634. [DOI] [PMC free article] [PubMed] [Google Scholar]
- 5.Jasanoff A. MRI contrast agents for functional molecular imaging of brain activity. Current opinion in neurobiology. 2007;17:593–600. doi: 10.1016/j.conb.2007.11.002. [DOI] [PMC free article] [PubMed] [Google Scholar]
- 6.Gilad AA, Ziv K, McMahon MT, Van Zijl PC, Neeman M, Bulte JW. MRI reporter genes. Journal of Nuclear Medicine. 2008;49:1905–1908. doi: 10.2967/jnumed.108.053520. [DOI] [PMC free article] [PubMed] [Google Scholar]
- 7.Vandsburger MH, Radoul M, Cohen B, Neeman M. MRI reporter genes: applications for imaging of cell survival, proliferation, migration and differentiation. NMR in Biomedicine. 2013;26:872–884. doi: 10.1002/nbm.2869. [DOI] [PMC free article] [PubMed] [Google Scholar]
- 8.Matsumoto Y, Jasanoff A. Metalloprotein-based MRI probes. FEBS letters. 2013;587:1021–1029. doi: 10.1016/j.febslet.2013.01.044. [DOI] [PMC free article] [PubMed] [Google Scholar]
- 9.Shapiro MG, Westmeyer GG, Romero PA, Szablowski JO, Küster B, Shah A, Otey CR, Langer R, Arnold FH, Jasanoff A. Directed evolution of a magnetic resonance imaging contrast agent for noninvasive imaging of dopamine. Nature biotechnology. 2010;28:264–270. doi: 10.1038/nbt.1609. [DOI] [PMC free article] [PubMed] [Google Scholar]
- 10.Bartelle BB, Mana MD, Suero-Abreu GA, Rodriguez JJ, Turnbull DH. Engineering an effective Mn-binding MRI reporter protein by subcellular targeting. Magnetic resonance in medicine. 2015;74:1750–1757. doi: 10.1002/mrm.25566. [DOI] [PMC free article] [PubMed] [Google Scholar]
- 11.Bartelle BB, Szulc KU, Suero-Abreu GA, Rodriguez JJ, Turnbull DH. Divalent metal transporter, DMT1: A novel MRI reporter protein. Magnetic resonance in medicine. 2013;70:842–850. doi: 10.1002/mrm.24509. [DOI] [PMC free article] [PubMed] [Google Scholar]
- 12.Hai A, Cai LX, Lee T, Lelyveld VS, Jasanoff A. Molecular fMRI of Serotonin Transport. Neuron. 2016;92:754–765. doi: 10.1016/j.neuron.2016.09.048. [DOI] [PMC free article] [PubMed] [Google Scholar]
- 13.Lee T, Cai LX, Lelyveld VS, Hai A, Jasanoff A. Molecular-level functional magnetic resonance imaging of dopaminergic signaling. Science. 2014;344:533–535. doi: 10.1126/science.1249380. [DOI] [PMC free article] [PubMed] [Google Scholar]
- 14.Lelyveld VS, Brustad E, Arnold FH, Jasanoff A. Metal-substituted protein MRI contrast agents engineered for enhanced relaxivity and ligand sensitivity. Journal of the American Chemical Society. 2011;133:649–651. doi: 10.1021/ja107936d. [DOI] [PMC free article] [PubMed] [Google Scholar]
- 15.Xue S, Yang H, Qiao J, Pu F, Jiang J, Hubbard K, Hekmatyar K, Langley J, Salarian M, Long RC. Protein MRI contrast agent with unprecedented metal selectivity and sensitivity for liver cancer imaging. Proceedings of the National Academy of Sciences. 2015;112:6607–6612. doi: 10.1073/pnas.1423021112. [DOI] [PMC free article] [PubMed] [Google Scholar]
- 16.Caravan P, Farrar CT, Frullano L, Uppal R. Influence of molecular parameters and increasing magnetic field strength on relaxivity of gadolinium-and manganese-based T1 contrast agents. Contrast media & molecular imaging. 2009;4:89–100. doi: 10.1002/cmmi.267. [DOI] [PMC free article] [PubMed] [Google Scholar]
- 17.Gossuin Y, Gillis P, Hocq A, Vuong QL, Roch A. Magnetic resonance relaxation properties of superparamagnetic particles. Wiley Interdisciplinary Reviews: Nanomedicine and Nanobiotechnology. 2009;1:299–310. doi: 10.1002/wnan.36. [DOI] [PubMed] [Google Scholar]
- 18.Shapiro MG, Szablowski JO, Langer R, Jasanoff A. Protein nanoparticles engineered to sense kinase activity in MRI. Journal of the American Chemical Society. 2009;131:2484. doi: 10.1021/ja8086938. [DOI] [PMC free article] [PubMed] [Google Scholar]
- 19.Gossuin Y, Muller RN, Gillis P, Bartel L. Relaxivities of human liver and spleen ferritin. Magnetic resonance imaging. 2005;23:1001–1004. doi: 10.1016/j.mri.2005.10.009. [DOI] [PubMed] [Google Scholar]
- 20.Cunningham CH, Arai T, Yang PC, McConnell MV, Pauly JM, Conolly SM. Positive contrast magnetic resonance imaging of cells labeled with magnetic nanoparticles. Magnetic Resonance in Medicine. 2005;53:999–1005. doi: 10.1002/mrm.20477. [DOI] [PubMed] [Google Scholar]
- 21.Terreno E, Castelli DD, Viale A, Aime S. Challenges for molecular magnetic resonance imaging. Chemical reviews. 2010;110:3019–3042. doi: 10.1021/cr100025t. [DOI] [PubMed] [Google Scholar]
- 22.Davis HC, Ramesh P, Bhatnagar A, Lee-Gosselin A, Barry JF, Glenn DR, Walsworth RL, Shapiro MG. Mapping the Microscale Origins of MRI Contrast with Subcellular NV Diamond Magnetometry. arXiv preprint arXiv:1610.01924. 2016 doi: 10.1038/s41467-017-02471-7. [DOI] [PMC free article] [PubMed] [Google Scholar]
- 23.Bulte JW, Douglas T, Mann S, Frankel RB, Moskowitz BM, Brooks RA, Baumgarner CD, Vymazal J, Strub MP, Frank JA. Magnetoferritin: characterization of a novel superparamagnetic MR contrast agent. Journal of Magnetic Resonance Imaging. 1994;4:497–505. doi: 10.1002/jmri.1880040343. [DOI] [PubMed] [Google Scholar]
- 24.Kolinko I, Lohße A, Borg S, Raschdorf O, Jogler C, Tu Q, Pósfai M, Tompa É, Plitzko JM, Brachmann A. Biosynthesis of magnetic nanostructures in a foreign organism by transfer of bacterial magnetosome gene clusters. Nature nanotechnology. 2014;9:193–197. doi: 10.1038/nnano.2014.13. [DOI] [PubMed] [Google Scholar]
- 25.Matsumoto Y, Chen R, Anikeeva P, Jasanoff A. Engineering intracellular biomineralization and biosensing by a magnetic protein. Nature communications. 2015;6:8721. doi: 10.1038/ncomms9721. [DOI] [PMC free article] [PubMed] [Google Scholar]
- 26.Liu X, Lopez PA, Giessen TW, Giles M, Way JC, Silver PA. Engineering Genetically-Encoded Mineralization and Magnetism via Directed Evolution. Scientific Reports. 2016;6:38019. doi: 10.1038/srep38019. [DOI] [PMC free article] [PubMed] [Google Scholar]
- 27.Radoul M, Lewin L, Cohen B, Oren R, Popov S, Davidov G, Vandsburger MH, Harmelin A, Bitton R, Greneche J-M. Genetic manipulation of iron biomineralization enhances MR relaxivity in a ferritin-M6A chimeric complex. Scientific reports. 2016;6:26550. doi: 10.1038/srep26550. [DOI] [PMC free article] [PubMed] [Google Scholar]
- 28.Sun PZ, Schoening ZB, Jasanoff A. In vivo oxygen detection using exogenous hemoglobin as a contrast agent in magnetic resonance microscopy. Magnetic resonance in medicine. 2003;49:609–614. doi: 10.1002/mrm.10405. [DOI] [PubMed] [Google Scholar]
- 29.Weissleder R, Simonova M, Bogdanova A, Bredow S, Enochs WS, Bogdanov A., Jr MR imaging and scintigraphy of gene expression through melanin induction. Radiology. 1997;204:425–429. doi: 10.1148/radiology.204.2.9240530. [DOI] [PubMed] [Google Scholar]
- 30.Zhang X-Y, Robledo BN, Harris SS, Hu XP. A bacterial gene, mms6, as a new reporter gene for magnetic resonance imaging of mammalian cells. Mol Imaging. 2014;13:1–12. doi: 10.2310/7290.2014.00046. [DOI] [PubMed] [Google Scholar]
- 31.Bar-Shir A, Liu G, Chan KW, Oskolkov N, Song X, Yadav NN, Walczak P, McMahon MT, Van Zijl PC, Bulte JW. Human protamine-1 as an MRI reporter gene based on chemical exchange. ACS chemical biology. 2014;9:134–138. doi: 10.1021/cb400617q. [DOI] [PMC free article] [PubMed] [Google Scholar]
- 32.Airan RD, Bar-Shir A, Liu G, Pelled G, McMahon MT, van Zijl P, Bulte JW, Gilad AA. MRI biosensor for protein kinase A encoded by a single synthetic gene. Magnetic resonance in medicine. 2012;68:1919–1923. doi: 10.1002/mrm.24483. [DOI] [PMC free article] [PubMed] [Google Scholar]
- 33.Gilad AA, McMahon MT, Walczak P, Winnard PT, Raman V, van Laarhoven HW, Skoglund CM, Bulte JW, van Zijl PC. Artificial reporter gene providing MRI contrast based on proton exchange. Nature biotechnology. 2007;25:217–219. doi: 10.1038/nbt1277. [DOI] [PubMed] [Google Scholar]
- 34.McMahon MT, Gilad AA, DeLiso MA, Cromer Berman SM, Bulte JW, van Zijl P. New “multicolor” polypeptide diamagnetic chemical exchange saturation transfer DIACEST contrast agents for MRI. Magnetic Resonance in Medicine. 2008;60:803–812. doi: 10.1002/mrm.21683. [DOI] [PMC free article] [PubMed] [Google Scholar]
- 35.van Zijl P, Yadav NN. Chemical exchange saturation transfer (CEST): what is in a name and what isn’t? Magnetic resonance in medicine. 2011;65:927–948. doi: 10.1002/mrm.22761. [DOI] [PMC free article] [PubMed] [Google Scholar]
- 36.Sherry AD, Woods M. Chemical exchange saturation transfer contrast agents for magnetic resonance imaging. Annu. Rev. Biomed. Eng. 2008;10:391–411. doi: 10.1146/annurev.bioeng.9.060906.151929. [DOI] [PMC free article] [PubMed] [Google Scholar]
- 37.Liu G, Song X, Chan KW, McMahon MT. Nuts and bolts of chemical exchange saturation transfer MRI. NMR in Biomedicine. 2013;26:810–828. doi: 10.1002/nbm.2899. [DOI] [PMC free article] [PubMed] [Google Scholar]
- 38.Farrar CT, Buhrman JS, Liu G, Kleijn A, Lamfers ML, McMahon MT, Gilad AA, Fulci G. Establishing the lysine-rich protein CEST reporter gene as a CEST MR imaging detector for oncolytic virotherapy. Radiology. 2015;275:746–754. doi: 10.1148/radiol.14140251. [DOI] [PMC free article] [PubMed] [Google Scholar]
- 39.Minn I, Bar-Shir A, Yarlagadda K, Bulte JW, Fisher PB, Wang H, Gilad AA, Pomper MG. Tumor-specific expression and detection of a CEST reporter gene. Magnetic resonance in medicine. 2015;74:544–549. doi: 10.1002/mrm.25748. [DOI] [PMC free article] [PubMed] [Google Scholar]
- 40.Song X, Gilad AA, Joel S, Liu G, Bar-Shir A, Liang Y, Gorelik M, Pekar JJ, van Zijl P, Bulte JW. CEST phase mapping using a length and offset varied saturation (LOVARS) scheme. Magnetic resonance in medicine. 2012;68:1074–1086. doi: 10.1002/mrm.23312. [DOI] [PMC free article] [PubMed] [Google Scholar]
- 41.Koretsky AP, Brosnan MJ, Chen L, Chen J, Van Dyke T. NMR detection of creatine kinase expressed in liver of transgenic mice: determination of free ADP levels. Proceedings of the National Academy of Sciences. 1990;87:3112–3116. doi: 10.1073/pnas.87.8.3112. [DOI] [PMC free article] [PubMed] [Google Scholar]
- 42.Louie AY, Hüber MM, Ahrens ET, Rothbächer U, Moats R, Jacobs RE, Fraser SE, Meade TJ. In vivo visualization of gene expression using magnetic resonance imaging. Nature biotechnology. 2000;18:321–325. doi: 10.1038/73780. [DOI] [PubMed] [Google Scholar]
- 43.Patrick PS, Hammersley J, Loizou L, Kettunen MI, Rodrigues TB, Hu D-E, Tee S-S, Hesketh R, Lyons SK, Soloviev D. Dual-modality gene reporter for in vivo imaging. Proceedings of the National Academy of Sciences. 2014;111:415–420. doi: 10.1073/pnas.1319000111. [DOI] [PMC free article] [PubMed] [Google Scholar]
- 44.Deans AE, Wadghiri YZ, Bernas LM, Yu X, Rutt BK, Turnbull DH. Cellular MRI contrast via coexpression of transferrin receptor and ferritin. Magnetic resonance in medicine. 2006;56:51–59. doi: 10.1002/mrm.20914. [DOI] [PMC free article] [PubMed] [Google Scholar]
- 45.Weissleder R, Moore A, Mahmood U, Bhorade R, Benveniste H, Chiocca EA, Basilion JP. In vivo magnetic resonance imaging of transgene expression. Nature medicine. 2000;6:351–354. doi: 10.1038/73219. [DOI] [PubMed] [Google Scholar]
- 46.Patrick PS, Rodrigues TB, Kettunen MI, Lyons SK, Neves AA, Brindle KM. Development of Timd2 as a reporter gene for MRI. Magnetic resonance in medicine. 2015;75:1697–1707. doi: 10.1002/mrm.25750. [DOI] [PMC free article] [PubMed] [Google Scholar]
- 47.Bar-Shir A, Liu G, Liang Y, Yadav NN, McMahon MT, Walczak P, Nimmagadda S, Pomper MG, Tallman KA, Greenberg MM. Transforming thymidine into a magnetic resonance imaging probe for monitoring gene expression. Journal of the American Chemical Society. 2013;135:1617–1624. doi: 10.1021/ja312353e. [DOI] [PMC free article] [PubMed] [Google Scholar]
- 48.Tannous BA, Grimm J, Perry KF, Chen JW, Weissleder R, Breakefield XO. Metabolic biotinylation of cell surface receptors for in vivo imaging. Nature methods. 2006;3:391–396. doi: 10.1038/nmeth875. [DOI] [PubMed] [Google Scholar]
- 49.Bartelle BB, Berríos-Otero CA, Rodriguez JJ, Friedland AE, Aristizábal O, Turnbull DH. Novel Genetic Approach for In Vivo Vascular Imaging in Mice. Circulation research. 2012;110:938–947. doi: 10.1161/CIRCRESAHA.111.254375. [DOI] [PMC free article] [PubMed] [Google Scholar]
- 50.Le Bihan D. Looking into the functional architecture of the brain with diffusion MRI. Nature Reviews Neuroscience. 2003;4:469–480. doi: 10.1038/nrn1119. [DOI] [PubMed] [Google Scholar]
- 51.Neil JJ. Diffusion imaging concepts for clinicians. Journal of Magnetic Resonance Imaging. 2008;27:1–7. doi: 10.1002/jmri.21087. [DOI] [PubMed] [Google Scholar]
- 52.Norris DG. The effects of microscopic tissue parameters on the diffusion weighted magnetic resonance imaging experiment. NMR in Biomedicine. 2001;14:77–93. doi: 10.1002/nbm.682. [DOI] [PubMed] [Google Scholar]
- 53.Li H, Jiang X, Xie J, McIntyre JO, Gore JC, Xu J. Time-dependent influence of cell membrane permeability on MR diffusion measurements. Magnetic resonance in medicine. 2015;75:1927–1934. doi: 10.1002/mrm.25724. [DOI] [PMC free article] [PubMed] [Google Scholar]
- 54.Badaut J, Fukuda AM, Jullienne A, Petry KG. Aquaporin and brain diseases. Biochimica et Biophysica Acta (BBA)-General Subjects. 2014;1840:1554–1565. doi: 10.1016/j.bbagen.2013.10.032. [DOI] [PMC free article] [PubMed] [Google Scholar]
- 55.Sehy JV, Banks AA, Ackerman JJ, Neil JJ. Importance of intracellular water apparent diffusion to the measurement of membrane permeability. Biophysical journal. 2002;83:2856–2863. doi: 10.1016/S0006-3495(02)75294-6. [DOI] [PMC free article] [PubMed] [Google Scholar]
- 56.Mukherjee A, Wu D, Davis HC, Shapiro MG. Non-invasive imaging using reporter genes altering cellular water permeability. Nature Communications. 2016;7:13891. doi: 10.1038/ncomms13891. [DOI] [PMC free article] [PubMed] [Google Scholar]
- 57.Schilling F, Ros S, Hu D-E, D’Santos P, McGuire S, Mair R, Wright AJ, Mannion E, Franklin RJ, Neves AA. MRI measurements of reporter-mediated increases in transmembrane water exchange enable detection of a gene reporter. Nature Biotechnology. 2017;35:75–80. doi: 10.1038/nbt.3714. [DOI] [PMC free article] [PubMed] [Google Scholar]
- 58.Yang B, Verkman A. Water and glycerol permeabilities of aquaporins 1–5 and MIP determined quantitatively by expression of epitope-tagged constructs inXenopus oocytes. Journal of Biological Chemistry. 1997;272:16140–16146. doi: 10.1074/jbc.272.26.16140. [DOI] [PubMed] [Google Scholar]
- 59.Sukstanskii A, Yablonskiy D, Ackerman J. Effects of permeable boundaries on the diffusion-attenuated MR signal: insights from a one-dimensional model. Journal of Magnetic Resonance. 2004;170:56–66. doi: 10.1016/j.jmr.2004.05.020. [DOI] [PubMed] [Google Scholar]
- 60.Ma T, Frigeri A, Tsai S-T, Verbavatz J, Verkman A. Localization and functional analysis of CHIP28k water channels in stably transfected Chinese hamster ovary cells. Journal of Biological Chemistry. 1993;268:22756–22764. [PubMed] [Google Scholar]
- 61.Agre P, Bonhivers M, Borgnia MJ. The aquaporins, blueprints for cellular plumbing systems. Journal of Biological Chemistry. 1998;273:14659–14662. doi: 10.1074/jbc.273.24.14659. [DOI] [PubMed] [Google Scholar]
- 62.Badaut J, Ashwal S, Adami A, Tone B, Recker R, Spagnoli D, Ternon B, Obenaus A. Brain water mobility decreases after astrocytic aquaporin-4 inhibition using RNA interference. Journal of Cerebral Blood Flow & Metabolism. 2011;31:819–831. doi: 10.1038/jcbfm.2010.163. [DOI] [PMC free article] [PubMed] [Google Scholar]
- 63.Fukuda AM, Adami A, Pop V, Bellone JA, Coats JS, Hartman RE, Ashwal S, Obenaus A, Badaut J. Posttraumatic reduction of edema with aquaporin-4 RNA interference improves acute and chronic functional recovery. Journal of Cerebral Blood Flow & Metabolism. 2013;33:1621–1632. doi: 10.1038/jcbfm.2013.118. [DOI] [PMC free article] [PubMed] [Google Scholar]
- 64.Pilatus U, Shim H, Artemov D, Davis D, Van Zijl P, Glickson JD. Intracellular volume and apparent diffusion constants of perfused cancer cell cultures, as measured by NMR. Magnetic resonance in medicine. 1997;37:825–832. doi: 10.1002/mrm.1910370605. [DOI] [PubMed] [Google Scholar]
- 65.Griffin R, Prisner T. High field dynamic nuclear polarization—the renaissance. Physical Chemistry Chemical Physics. 2010;12:5737–5740. doi: 10.1039/c0cp90019b. [DOI] [PMC free article] [PubMed] [Google Scholar]
- 66.Wolber J, Ellner F, Fridlund B, Gram A, Johannesson H, Hansson G, Hansson L, Lerche MH, Månsson S, Servin R. Generating highly polarized nuclear spins in solution using dynamic nuclear polarization, Nuclear Instruments and Methods in Physics Research Section A: Accelerators, Spectrometers. Detectors and Associated Equipment. 2004;526:173–181. [Google Scholar]
- 67.Adams RW, Aguilar JA, Atkinson KD, Cowley MJ, Elliott PI, Duckett SB, Green GG, Khazal IG, López-Serrano J, Williamson DC. Reversible interactions with para-hydrogen enhance NMR sensitivity by polarization transfer. Science. 2009;323:1708–1711. doi: 10.1126/science.1168877. [DOI] [PubMed] [Google Scholar]
- 68.Natterer J, Bargon J. Parahydrogen induced polarization. Progress in Nuclear Magnetic Resonance Spectroscopy. 1997;31:293–315. [Google Scholar]
- 69.Bowers CR, Weitekamp DP. Transformation of symmetrization order to nuclear-spin magnetization by chemical reaction and nuclear magnetic resonance. Physical Review Letters. 1986;57:2645–2648. doi: 10.1103/PhysRevLett.57.2645. [DOI] [PubMed] [Google Scholar]
- 70.Navon G, Song Y, Room T, Appelt S. Enhancement of solution NMR and MRI with laser-polarized xenon. Science. 1996;271:1848–1851. [Google Scholar]
- 71.Kauczor H-U, Surkau R, Roberts T. MRI using hyperpolarized noble gases. European radiology. 1998;8:820–827. doi: 10.1007/s003300050479. [DOI] [PubMed] [Google Scholar]
- 72.Walker TG, Happer W. Spin-exchange optical pumping of noble-gas nuclei. Reviews of Modern Physics. 1997;69:629–642. [Google Scholar]
- 73.Ardenkjær-Larsen JH, Fridlund B, Gram A, Hansson G, Hansson L, Lerche MH, Servin R, Thaning M, Golman K. Increase in signal-to-noise ratio of> 10,000 times in liquid-state NMR. Proceedings of the National Academy of Sciences. 2003;100:10158–10163. doi: 10.1073/pnas.1733835100. [DOI] [PMC free article] [PubMed] [Google Scholar]
- 74.Ross B, Bhattacharya P, Wagner S, Tran T, Sailasuta N. Hyperpolarized MR imaging: neurologic applications of hyperpolarized metabolism. American Journal of Neuroradiology. 2010;31:24–33. doi: 10.3174/ajnr.A1790. [DOI] [PMC free article] [PubMed] [Google Scholar]
- 75.McCarney ER, Armstrong BD, Lingwood MD, Han S. Hyperpolarized water as an authentic magnetic resonance imaging contrast agent. Proceedings of the National Academy of Sciences. 2007;104:1754–1759. doi: 10.1073/pnas.0610540104. [DOI] [PMC free article] [PubMed] [Google Scholar]
- 76.Brindle KM, Bohndiek SE, Gallagher FA, Kettunen MI. Tumor imaging using hyperpolarized 13C magnetic resonance spectroscopy. Magnetic resonance in medicine. 2011;66:505–519. doi: 10.1002/mrm.22999. [DOI] [PubMed] [Google Scholar]
- 77.Clatworthy MR, Kettunen MI, Hu D-E, Mathews RJ, Witney TH, Kennedy BW, Bohndiek SE, Gallagher FA, Jarvis LB, Smith KG. Magnetic resonance imaging with hyperpolarized [1, 4-13C2] fumarate allows detection of early renal acute tubular necrosis. Proceedings of the National Academy of Sciences. 2012;109:13374–13379. doi: 10.1073/pnas.1205539109. [DOI] [PMC free article] [PubMed] [Google Scholar]
- 78.Henry P-G, Adriany G, Deelchand D, Gruetter R, Marjanska M, Öz G, Seaquist ER, Shestov A, K Uğurbil. In vivo 13 C NMR spectroscopy and metabolic modeling in the brain: a practical perspective. Magnetic resonance imaging. 2006;24:527–539. doi: 10.1016/j.mri.2006.01.003. [DOI] [PubMed] [Google Scholar]
- 79.Brindle KM. Imaging metabolism with hyperpolarized 13C–labeled cell substrates. Journal of the American Chemical Society. 2015;137:6418–6427. doi: 10.1021/jacs.5b03300. [DOI] [PubMed] [Google Scholar]
- 80.Nelson SJ, Kurhanewicz J, Vigneron DB, Larson PE, Harzstark AL, Ferrone M, van Criekinge M, Chang JW, Bok R, Park I. Metabolic imaging of patients with prostate cancer using hyperpolarized [1-13C] pyruvate. Science translational medicine. 2013;5:198. doi: 10.1126/scitranslmed.3006070. [DOI] [PMC free article] [PubMed] [Google Scholar]
- 81.Schröder L, Lowery TJ, Hilty C, Wemmer DE, Pines A. Molecular imaging using a targeted magnetic resonance hyperpolarized biosensor. Science. 2006;314:446–449. doi: 10.1126/science.1131847. [DOI] [PubMed] [Google Scholar]
- 82.Meldrum T, Seim KL, Bajaj VS, Palaniappan KK, Wu W, Francis MB, Wemmer DE, Pines A. A xenon-based molecular sensor assembled on an MS2 viral capsid scaffold. Journal of the American Chemical Society. 2010;132:5936–5937. doi: 10.1021/ja100319f. [DOI] [PubMed] [Google Scholar]
- 83.Stevens TK, Palaniappan KK, Ramirez RM, Francis MB, Wemmer DE, Pines A. HyperCEST detection of a 129Xe-based contrast agent composed of cryptophane-A molecular cages on a bacteriophage scaffold. Magnetic resonance in medicine. 2013;69:1245–1252. doi: 10.1002/mrm.24371. [DOI] [PubMed] [Google Scholar]
- 84.Bai Y, Wang Y, Goulian M, Driks A, Dmochowski IJ. Bacterial spore detection and analysis using hyperpolarized 129 Xe chemical exchange saturation transfer (Hyper-CEST) NMR. Chemical Science. 2014;5:3197–3203. doi: 10.1039/c4sc01190b. [DOI] [PMC free article] [PubMed] [Google Scholar]
- 85.Wang Y, Roose BW, Palovcak EJ, Carnevale V, Dmochowski IJ. A Genetically Encoded β-Lactamase Reporter for Ultrasensitive 129Xe NMR in Mammalian Cells. Angewandte Chemie International Edition. 2016;55:8984–8987. doi: 10.1002/anie.201604055. [DOI] [PMC free article] [PubMed] [Google Scholar]
- 86.Witte C, Martos V, Rose HM, Reinke S, Klippel S, Schröder L, Hackenberger CP. Live-cell MRI with Xenon Hyper-CEST Biosensors Targeted to Metabolically Labeled Cell-Surface Glycans. Angewandte Chemie International Edition. 2015;54:2806–2810. doi: 10.1002/anie.201410573. [DOI] [PubMed] [Google Scholar]
- 87.Prange T, Schiltz M, Pernot L, Colloc’h N, Longhi S, Bourguet W, Fourme R. Exploring hydrophobic sites in proteins with xenon or krypton, Proteins: Structure, Function, and Bioinformatics. 1998;30:61–73. [PubMed] [Google Scholar]
- 88.Locci E, Dehouck Y, Casu M, Saba G, Lai A, Luhmer M, Reisse J, Bartik K. Probing proteins in solution by 129Xe NMR spectroscopy. Journal of magnetic resonance. 2001;150:167–174. doi: 10.1006/jmre.2001.2325. [DOI] [PubMed] [Google Scholar]
- 89.Rubin SM, Lee S-Y, Ruiz EJ, Pines A, Wemmer DE. Detection and characterization of xenon-binding sites in proteins by 129 Xe NMR spectroscopy. Journal of molecular biology. 2002;322:425–440. doi: 10.1016/s0022-2836(02)00739-8. [DOI] [PubMed] [Google Scholar]
- 90.Bowers C, Storhaug V, Webster CE, Bharatam J, Cottone A, III, Gianna R, Betsey K, Gaffney B. Exploring surfaces and cavities in lipoxygenase and other proteins by hyperpolarized xenon-129 NMR. Journal of the American Chemical Society. 1999;121:9370–9377. doi: 10.1021/ja991443+. [DOI] [PMC free article] [PubMed] [Google Scholar]
- 91.Tilton R, Jr, Kuntz I., Jr Nuclear magnetic resonance studies of xenon-129 with myoglobin and hemoglobin. Biochemistry. 1982;21:6850–6857. doi: 10.1021/bi00269a035. [DOI] [PubMed] [Google Scholar]
- 92.Shapiro MG, Ramirez RM, Sperling LJ, Sun G, Sun J, Pines A, Schaffer DV, Bajaj VS. Genetically encoded reporters for hyperpolarized xenon magnetic resonance imaging. Nature chemistry. 2014;6:629–634. doi: 10.1038/nchem.1934. [DOI] [PubMed] [Google Scholar]
- 93.Walsby A. Gas vesicles. Microbiological reviews. 1994;58:94–144. doi: 10.1128/mr.58.1.94-144.1994. [DOI] [PMC free article] [PubMed] [Google Scholar]
- 94.Pfeifer F. Distribution, formation and regulation of gas vesicles. Nature Reviews Microbiology. 2012;10:705–715. doi: 10.1038/nrmicro2834. [DOI] [PubMed] [Google Scholar]
- 95.Kunth M, Witte C, Schröder L. Quantitative chemical exchange saturation transfer with hyperpolarized nuclei (qHyper-CEST): Sensing xenon-host exchange dynamics and binding affinities by NMR. The Journal of chemical physics. 2014;141:194202. doi: 10.1063/1.4901429. [DOI] [PubMed] [Google Scholar]
- 96.Chen AP, Hurd RE, Gu Yp, Wilson DM, Cunningham CH. 13C MR reporter probe system using dynamic nuclear polarization. NMR in biomedicine. 2011;24:514–520. doi: 10.1002/nbm.1618. [DOI] [PubMed] [Google Scholar]
- 97.Jamin Y, Gabellieri C, Smyth L, Reynolds S, Robinson SP, Springer CJ, Leach MO, Payne GS, Eykyn TR. Hyperpolarized 13C magnetic resonance detection of carboxypeptidase G2 activity. Magnetic resonance in medicine. 2009;62:1300–1304. doi: 10.1002/mrm.22049. [DOI] [PubMed] [Google Scholar]
- 98.Dzien P, Tee SS, Kettunen MI, Lyons SK, Larkin TJ, Timm KN, Hu DE, Wright A, Rodrigues TB, Serrao EM. 13C magnetic resonance spectroscopy measurements with hyperpolarized [1-13C] pyruvate can be used to detect the expression of transgenic pyruvate decarboxylase activity in vivo. Magnetic resonance in medicine. 2015;76:391–401. doi: 10.1002/mrm.25879. [DOI] [PMC free article] [PubMed] [Google Scholar]
- 99.Patrick PS, Kettunen MI, Tee SS, Rodrigues TB, Serrao E, Timm KN, McGuire S, Brindle KM. Detection of transgene expression using hyperpolarized 13C urea and diffusion-weighted magnetic resonance spectroscopy. Magnetic resonance in medicine. 2015;73:1401–1406. doi: 10.1002/mrm.25254. [DOI] [PubMed] [Google Scholar]
- 100.Lee Y, Zeng H, Ruedisser S, Gossert AD, Hilty C. Nuclear magnetic resonance of hyperpolarized fluorine for characterization of protein-ligand interactions. Journal of the American Chemical Society. 2012;134:17448–17451. doi: 10.1021/ja308437h. [DOI] [PubMed] [Google Scholar]
- 101.Desai M, Slusarczyk AL, Chapin A, Barch M, Jasanoff A. Molecular imaging with engineered physiology. Nature Communications. 2016;7:13607. doi: 10.1038/ncomms13607. [DOI] [PMC free article] [PubMed] [Google Scholar]
- 102.Frostell C, Fratacci MD, Wain JC, Jones R, Zapol WM. Inhaled nitric oxide. A selective pulmonary vasodilator reversing hypoxic pulmonary vasoconstriction. Circulation. 1991;83:2038–2047. doi: 10.1161/01.cir.83.6.2038. [DOI] [PubMed] [Google Scholar]
- 103.Brain S, Williams T, Tippins J, Morris H, MacIntyre I. Calcitonin gene-related peptide is a potent vasodilator. Nature. 1985;313:54–56. doi: 10.1038/313054a0. [DOI] [PubMed] [Google Scholar]
- 104.Zhang S, Merritt M, Woessner DE, Lenkinski RE, Sherry AD. PARACEST agents: modulating MRI contrast via water proton exchange. Accounts of chemical research. 2003;36:783–790. doi: 10.1021/ar020228m. [DOI] [PubMed] [Google Scholar]
- 105.Dorazio SJ, Tsitovich PB, Siters KE, Spernyak JA, Morrow JR. Iron (II) paraCEST MRI contrast agents. Journal of the American Chemical Society. 2011;133:14154–14156. doi: 10.1021/ja204297z. [DOI] [PMC free article] [PubMed] [Google Scholar]
- 106.Dorazio SJ, Olatunde AO, Spernyak JA, Morrow JR. CoCEST: cobalt (II) amide-appended paraCEST MRI contrast agents. Chemical Communications. 2013;49:10025–10027. doi: 10.1039/c3cc45000g. [DOI] [PMC free article] [PubMed] [Google Scholar]
- 107.Olatunde AO, Dorazio SJ, Spernyak JA, Morrow JR. The NiCEST approach: nickel (II) paraCEST MRI contrast agents. Journal of the American Chemical Society. 2012;134:18503–18505. doi: 10.1021/ja307909x. [DOI] [PubMed] [Google Scholar]
- 108.Glöggler S, Colell J, Appelt S. Para-hydrogen perspectives in hyperpolarized NMR. Journal of Magnetic Resonance. 2013;235:130–142. doi: 10.1016/j.jmr.2013.07.010. [DOI] [PubMed] [Google Scholar]
- 109.Gilad AA, Shapiro MG. Molecular Imaging in Synthetic Biology, and Synthetic Biology in Molecular Imaging. Molecular Imaging and Biology. 2017:1–6. doi: 10.1007/s11307-017-1062-1. [DOI] [PMC free article] [PubMed] [Google Scholar]
- 110.Choi J-s, Kim S, Yoo D, Shin T-H, Kim H, Gomes MD, Kim SH, Pines A, Cheon J. Distance-dependent magnetic resonance tuning as a versatile MRI sensing platform for biological targets. Nature Materials. 2017;16:537–542. doi: 10.1038/nmat4846. [DOI] [PubMed] [Google Scholar]
- 111.Panagiotopoulos N, Duschka RL, Ahlborg M, Bringout G, Debbeler C, Graeser M, Kaethner C, Lüdtke-Buzug K, Medimagh H, Stelzner J. Magnetic particle imaging: current developments and future directions. International journal of nanomedicine. 2015;10:3097–3114. doi: 10.2147/IJN.S70488. [DOI] [PMC free article] [PubMed] [Google Scholar]
- 112.Saritas EU, Goodwill PW, Croft LR, Konkle JJ, Lu K, Zheng B, Conolly SM. Magnetic particle imaging (MPI) for NMR and MRI researchers. Journal of Magnetic Resonance. 2013;229:116–126. doi: 10.1016/j.jmr.2012.11.029. [DOI] [PMC free article] [PubMed] [Google Scholar]
- 113.Shapiro MG, Goodwill PW, Neogy A, Yin M, Foster FS, Schaffer DV, Conolly SM. Biogenic gas nanostructures as ultrasonic molecular reporters. Nature nanotechnology. 2014;9:311–316. doi: 10.1038/nnano.2014.32. [DOI] [PMC free article] [PubMed] [Google Scholar]
- 114.Iordanova B, Ahrens ET. In vivo magnetic resonance imaging of ferritin-based reporter visualizes native neuroblast migration. Neuroimage. 2012;59:1004–1012. doi: 10.1016/j.neuroimage.2011.08.068. [DOI] [PMC free article] [PubMed] [Google Scholar]
- 115.Cohen B, Dafni H, Meir G, Harmelin A, Neeman M. Ferritin as an endogenous MRI reporter for noninvasive imaging of gene expression in C6 glioma tumors. Neoplasia. 2005;7:109–117. doi: 10.1593/neo.04436. [DOI] [PMC free article] [PubMed] [Google Scholar]
- 116.Cohen B, Ziv K, Plaks V, Israely T, Kalchenko V, Harmelin A, Benjamin LE, Neeman M. MRI detection of transcriptional regulation of gene expression in transgenic mice. Nature medicine. 2007;13:498–503. doi: 10.1038/nm1497. [DOI] [PubMed] [Google Scholar]
- 117.Gries H, Krause W. Contrast Agents I: Magnetic Resonance Imaging. 2002 [Google Scholar]