

Abstract
Haploinsufficiency of the AT-rich interactive domain 1B (ARID1B) gene causes autism spectrum disorder (ASD) and intellectual disability, however, the neurobiological basis for this is unknown. Here, we generated Arid1b knockout mice and examined heterozygotes to model human patients. Arid1b heterozygous mice showed a decreased number of cortical GABAergic interneurons and reduced proliferation of interneuron progenitors in the ganglionic eminence. Arid1b haploinsufficiency also led to an imbalance between excitatory and inhibitory synapses in the cerebral cortex. Furthermore, we found that Arid1b haploinsufficiency suppressed histone H3 lysine 9 acetylation (H3K9Ac) overall, and in particular reduced H3K9Ac of the Pvalb promoter, resulting in decreased transcription. Arid1b heterozygous mice exhibited abnormal cognitive and social behavior, which was rescued by treatment with a positive allosteric GABAA receptor modulator. Our results demonstrate a critical role for the Arid1b gene in interneuron development and behavior, and provide insight into the pathogenesis of ASD and intellectual disability.
Keywords: Arid1b, haploinsufficiency, autism spectrum disorder, intellectual disability, interneuron, parvalbumin, GABA
INTRODUCTION
Autism spectrum disorder (ASD) impairs the ability of individuals to communicate and interact with others. Approximately 75% of individuals with ASD also have intellectual disability, which is characterized by significant limitations in cognitive functions and adaptive behaviors1. While ASD and intellectual disability are currently defined using behavioral criteria, little is known about the neuropathogenesis of these conditions. There are no pharmacological and/or genetic treatments to prevent ASD or intellectual disability, and current treatment options focus on behavioral management and educational and physical therapies. Development of therapeutic tools requires identification and targeting of causative factors.
Recent genetic studies have reported that haploinsufficiency of AT-rich interactive domain 1B (ARID1B) causes ASD and non-syndromic and syndromic intellectual disability including Coffin-Siris syndrome2–4. However, the neurobiological function of ARID1B during brain development is unknown. ARID1B is a component of the human Brg1/Brm associated factor (BAF) chromatin remodeling complex and controls gene expression by facilitating DNA access for transcription factors5. The ARID1B protein binds to DNA sequences via its AT-rich DNA-binding domain. Chromatin remodeling as an epigenetic mechanism is critically linked to ASD and intellectual disability6.
GABAergic interneurons play an important role in neural circuitry and emotional and cognitive behaviors7. The balance of excitatory and inhibitory neurotransmission is essential for controlling memory and emotional behaviors and is disrupted in ASD and intellectual disability8,9. Reduction of inhibitory signaling is particularly involved in ASD-like behaviors in human and mouse models of ASD10,11. Proper positioning and differentiation of interneurons during brain development are important for establishing anatomical and functional circuitry necessary for normal cognition12.
To investigate the neurobiological role of Arid1b, we have generated Arid1b knockout mice. Arid1b heterozygous mice in particular could be an excellent model for disorders related to ARID1B haploinsufficiency. We found that Arid1b haploinsufficiency leads to an excitation/inhibition imbalance by reducing the number of GABAergic interneurons in the cerebral cortex. Furthermore, we showed that treatment with a GABAAR positive allosteric modulator rescues ASD-like behavior and cognitive dysfunction in Arid1b heterozygous mice, suggesting an association between lower numbers of GABAergic interneurons and behavioral outcomes. Our findings suggest a pathogenic mechanism for ASD and intellectual disability.
RESULTS
Altered number and distribution of cortical interneurons in Arid1b+/− mice
Arid1b knockout mice were generated using ES cells that contain a ‘knockout-first’ design13 of the targeted Arid1b allele harboring LoxP sites flanking exon 5 (Supplementary Fig. 1). We first examined the lamination patterns of excitatory pyramidal neurons in P28 and P91 wild-type control (Arid1b+/+) and Arid1b+/− brains. Arid1b+/− cortices showed grossly normal CUX1 and TBR1 layering patterns, comparable to control cortices (Supplementary Fig. 2 and Supplementary Table 1). Furthermore, we observed no significant changes in the densities of CUX1-, TBR1-, or NeuN-positive neurons as well as Olig2-positive oligodendrocytes or GFAP-positive astrocytes in Arid1b+/− cortices (Supplementary Fig. 2).
Next, we assessed the positioning and density of inhibitory interneurons in Arid1b+/− brains. Interestingly, GABA- and parvalbumin-positive neuron densities were decreased in Arid1b+/− cortices compared with controls at P91 (Fig. 1a–d and Supplementary Table 1). We also found that interneurons were abnormally positioned in Arid1b+/− cortical layers. Other regions, such as the amygdala, thalamus, and hippocampus in Arid1b+/− brains at P28 and P91, also showed reduced numbers of GABA- and parvalbumin-positive interneurons (Supplementary Fig. 3). However, we found no change in the densities of somatostatin-, calbindin- and calretinin-positive cells in Arid1b+/− cortices compared with controls (Supplementary Fig. 4 and Supplementary Table 1). Additionally, we assessed interneuron numbers in conditional Arid1blox/+ mice after crossing with the Dlx5/6-Cre-IRES-EGFP14 or Nkx2.1-Cre15 mouse line. The densities of GABA- and parvalbumin-positive neurons were decreased in Arid1bloxP/+; Dlx5/6-Cre-IRES-EGFP and Arid1bloxP/+; Nkx2.1-Cre cortices compared with Arid1b+/+; Dlx5/6-Cre-IRES-EGFP and Arid1b+/+; Nkx2.1-Cre controls (Supplementary Fig. 5a–g). Conditional deletion of Arid1b did not lead to significant changes in body weight in mutant mice (Supplementary Fig. 5h). The reduced cortical interneurons in postnatal Arid1b+/− mice led us to examine whether the abnormalities observed in mutants began during embryonic development. The number of EGFP-positive interneurons was significantly reduced in Arid1b+/−; Dlx5/6-Cre-IRES-EGFP cortices at E12.5, E14.5, E16.5 and E18.5 compared with controls (Fig. 1e–h and Supplementary Fig. 6). Taken together, these results show that Arid1b haploinsufficiency leads to a substantial reduction in cortical interneurons.
Figure 1. Abnormal number of cortical interneurons in Arid1b+/− mice.
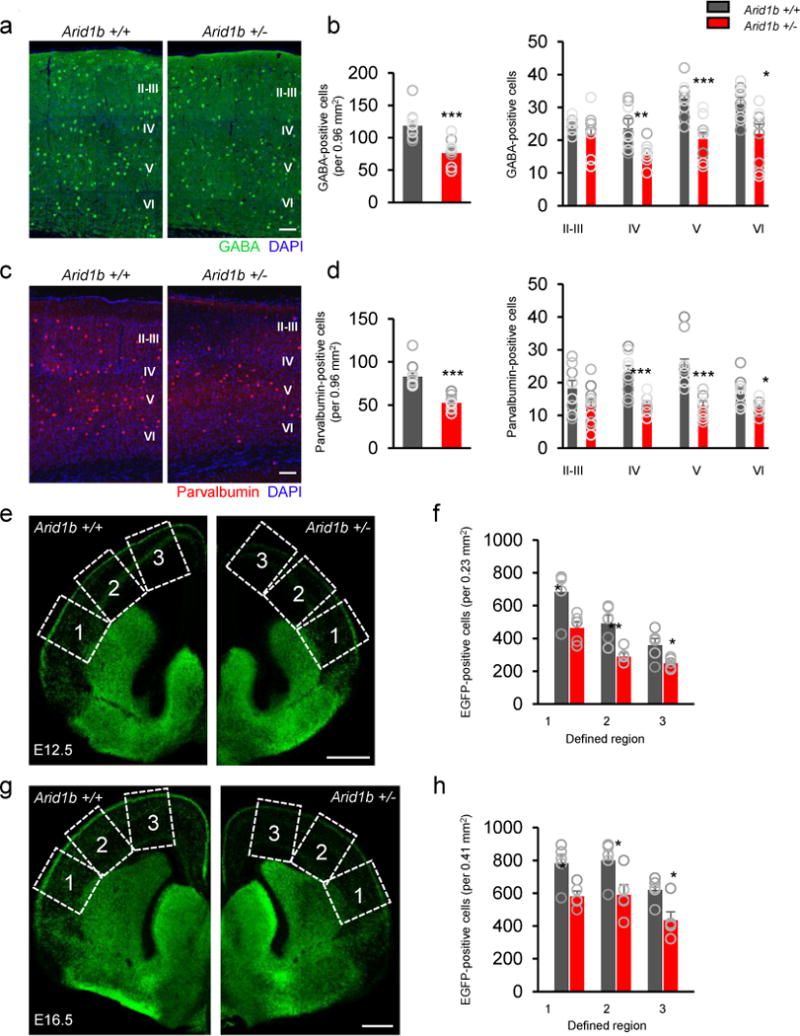
The number of interneurons was decreased in Arid1b+/− cerebral cortices. (a and c) Cortical sections of P91 Arid1b+/+ and Arid1b+/− mice were immunostained using GABA and parvalbumin antibodies. Scale bar= 100 μm. (b and d) Quantification of a and c. GABA- or parvalbumin-positive cells were counted in layers I-VI of the cortex at P91. Histograms show the total number of GABA- or parvalbumin-positive cells throughout cortical layers (left panel; GABA: t18= 4.372, ***P= 0.0004; parvalbumin: t18= 5.927, ***P<0.0001) and in each layer (right panel; GABA layer IV: t18= 3.769, **P= 0.0014; GABA layer V: t18= 4.794, ***P= 0.0001; GABA layer VI: t18= 3.024, **P= 0.0073; parvalbumin layer IV: t18= 4.515, ***P= 0.0003; parvalbumin layer V: t18= 4.386, ***P= 0.0004; parvalbumin layer VI: t18= 2.496, *P= 0.0225). N= 10 mice for Arid1b+/+ (8 males, 2 females) and Arid1b+/− (7 males, 3 females). Statistical significance was determined by a two-tailed Student’s t test. (e-h) Interneurons expressing EGFP were assessed in E12.5 (e) and E16.5 (g) cortices from Arid1b+/+; Dlx5/6-Cre-IRES-EGFP and Arid1b+/−; Dlx5/6-Cre-IRES-EGFP mice. Scale bar= 400 μm. (f and h) Quantified numbers of cortical interneurons shown in e (region 1: t8= 2.849, *P= 0.0215; region 2: t8= 3.664, **P= 0.0064; region 3: t8= 2.495, *P= 0.0372) and g (region 1: t8= 3.112, *P= 0.0144; region 2: t8= 2.545, *P= 0.0344; region 3: t8= 3.044, *P= 0.016). The cortex was divided into three equally defined regions along the lateral cortex as indicated by dashed boxes and numbers. N= 5 mice for each age and group. Statistical significance was determined by a two-tailed Student’s t test. Data shown are the mean ± SEM.
Development of cortical interneurons in Arid1b+/− mice
Interneuron migration plays an important role in determining the quantity and positioning of cortical interneurons. Using time-lapse imaging of EGFP-positive interneurons on cortical slices from E13.5 control (Arid1b+/+; Dlx5/6-Cre-IRES-EGFP) and Arid1b+/−; Dlx5/6-Cre-IRES-EGFP mice, we found no significant differences in migration speeds in Arid1b+/− interneurons compared with controls (Fig. 2a–c). We then examined the proliferation of Arid1b+/− ventral progenitors in the medial ganglionic eminence (MGE), which is the primary source of cortical interneurons in the developing brain. The number of proliferating cells positive to phosphorylated histone-H3 or BrdU was decreased in Arid1b+/− MGEs compared with controls (Fig. 2d, e). Next, we assessed apoptotic cells in control and Arid1b+/− MGEs and lateral ganglionic eminences (LGEs) by cleaved caspase-3 and TUNEL staining. The numbers of cleaved caspase-3-positive and TUNEL-positive cells were increased in Arid1b+/− MGEs and LGEs (Fig. 2f, g). The increased dying cells in the MGE were progenitors as they were double-positive to phosphorylated-histone H3 and cleaved caspase-3 (Fig. 2h). To further confirm our observations, we assessed cell death in cultured MGE progenitors. The number of proliferating progenitors labeled with BrdU was decreased in Arid1b+/− cultures compared with controls while the numbers of cleaved caspase-3- or TUNEL-positive cells were increased (Fig. 2i–l). These results suggest that Arid1b haploinsufficiency reduces the number of cortical interneurons by inhibiting proliferation and promoting apoptosis of GE progenitors during brain development. We examined expression of the components in Wnt/β-catenin signaling, which plays an important role in ventral progenitor proliferation and development. The protein levels of β-catenin and its target Cyclin D1 were decreased in Arid1b knockout ventral telencephalons in a gene dose-dependent manner while the level of phospho-β-catenin was increased (Supplementary Fig. 7a, b). The transcript levels of Ctnnb1 and its target genes as well as Wnt family genes were mostly downregulated in Arid1b knockout samples (Supplementary Fig. 7c, d).
Figure 2. Migration, apoptosis, and proliferation of interneuron progenitors in Arid1b+/− mice.
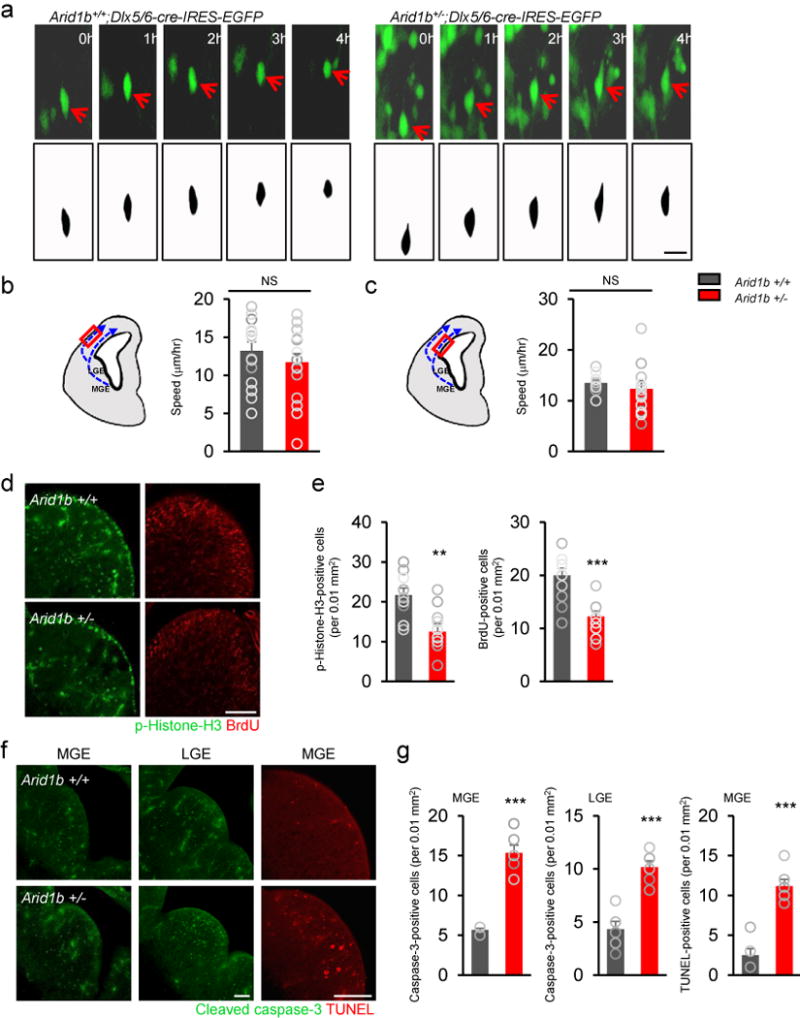

(a) Using time-lapse imaging, interneuron migration was assessed in organotypic slices from E13.5 Arid1b+/+;Dlx5/6-Cre-IRES-EGFP and Arid1b+/−;Dlx5/6-Cre-IRES-EGFP cortices. The speed of interneuron migration was not different between EGFP-positive neurons from Arid1b+/+;Dlx5/6-Cre-IRES-EGFP and Arid1b+/−;Dlx5/6-Cre-IRES-EGFP cortices. Red arrows indicate the same cell traced by time-lapse imaging. Scale bar= 30 μm. (b and c) Interneuron migration speed was measured along two known interneuron migratory routes; one along the marginal zone (b) and the other along the ventral zone (c). N= 20 cells from 3 mice for each condition. Statistical significance was determined by a two-tailed Student’s t test. NS: no significance. (d) Arid1b haploinsufficiency decreases progenitor proliferation in the MGE. Ventral brain sections containing Arid1b+/+ and Arid1b+/− MGEs at E12.5 were immunostained with phospho-histone H3 and BrdU antibodies after a 24 h BrdU pulse. (e) Quantification of d. Histograms show the numbers of phospho-histone H3 (t18= 3.487, **P= 0.0026) and BrdU (t22= 4.704, ***P= 0.0001)-positive cells per 0.01 mm2 in the MGE. Scale bar= 100 μm. N= 10 mice for each group for phospho-histone H3, and 12 mice for each group for BrdU. Statistical significance was determined by a two-tailed Student’s t test. (f) Cell death was assessed in control and mutant MGEs and LGEs by immunostaining using a cleaved caspase-3 antibody or by the TUNEL assay. (g) Quantification of f. Mutant GEs had more dying cells. N= 6 mice for each group. Statistical significance was determined by a two-tailed Student’s t test. Cleaved caspase-3 (MGE: t10= 6.246, ***P<0.0001; LGE: t10= 9.561, ***P<0.0001). TUNEL (t10= 7.296, ***P<0.0001). (h) The number of cleaved caspase-3/phospho-histone H3 double-positive cells was increased in the Arid1b+/− MGE at E14.5 (t18= 4.667, ***P= 0.0002). N= 10 mice for each genotype. Statistical significance was determined by a two-tailed Student’s t test. (i) MGE primary cells were cultured from E12.5 Arid1b+/+ and Arid1b+/− mice for 2 days. The cells were then incubated with 10 μM BrdU for 24 hours, fixed and immunostained with cleaved caspase-3 and BrdU antibodies. Scale bar= 40 μm. (j) Quantification of i. N= 6 cell culture replicates using 6 mice for each condition; cell counts= 1023 cells for Arid1b+/+ and 646 cells for Arid1b+/−. Statistical significance was determined by a two-tailed Student’s t test. Cleaved caspase-3 (t10= 2.419, *P= 0.0361). BrdU (t10= 3.520, **P= 0.0055). (k) After 2 days of MGE culture, the TUNEL assay was performed. Scale bar= 40 μm. (l) Quantification of TUNEL-positive cells. Apoptosis was increased in Arid1b mutant cells (t10= 6.982, ***P= 0.0001). N= 6 cell culture replicates using 6 mice for each condition; cell counts= 598 cells for Arid1b+/+ and 605 cells for Arid1b+/−. Statistical significance was determined by a two-tailed Student’s t test. Data shown are the mean ± SEM.
We investigated neurite morphology of Arid1b heterozygous interneurons by tracing EGFP-positive cells in P91 Arid1b+/−;Dlx5/6-Cre-IRES-EGFP mice. The length and number of Arid1b+/− interneuron neurites were decreased in Arid1b+/−;Dlx5/6-Cre-IRES-EGFP mice compared with Arid1b+/+;Dlx5/6-Cre-IRES-EGFP mice (Supplementary Fig. 8).
Synaptic structure and function in Arid1b+/− mice
The altered number and morphology of interneurons suggest that the Arid1b+/− cortex may have abnormal neuronal connectivity. Indeed, the numbers of inhibitory synaptic puncta positive to VIAAT and glutamic acid decarboxylase 2 (GAD2) were decreased in Arid1b+/− cortices compared with control numbers (Fig. 3a, b). However, we found no change in the number of excitatory synaptic puncta positive to vesicular glutamate transporter 1 (VGluT1, Slc17a7) in Arid1b+/− cortices. Also, we observed no changes in the number of excitatory synapses assessed by colocalized puncta of the postsynaptic marker, disks large homolog 4 (PSD95), and presynaptic marker VGluT1 in P91 Arid1b+/− cortices (Supplementary Fig. 9). We measured the ratio of VGluT1-positive to VIAAT-positive synapses in cortical layers 2/3e. Arid1b+/− cortices exhibited a higher ratio of excitatory to inhibitory synapses than controls (Fig. 3c), suggesting excitatory/inhibitory (E/I) imbalance. Additionally, using real-time PCR we found that the levels of Gad1 and Gad2 mRNAs were downregulated in Arid1b+/− cortices (Fig. 3d, Supplementary Fig. 7e). The mRNA levels of inhibitory postsynaptic markers Gphn and Arhgef9 were decreased in Arid1b+/− cortices while the levels of excitatory markers Slc17a7 and Dlg4 were not changed in Arid1b+/− cortices compared with control levels. However, Arid1b−/− cortices showed reduced levels of Slc17a7 and Dlg4 compared with wild type and Arid1b+/− samples (Supplementary Fig. 7e). GABA receptor levels were not changed in Arid1b+/− samples, but decreased in Arid1b−/− samples (Fig. 3d, Supplementary Fig. 7e). The protein level of GAD1 was also decreased in Arid1b+/− cortices (Fig. 3e, f).
Figure 3. Altered synapses in Arid1b+/− mice.

The number of inhibitory synapses was reduced in Arid1b+/− mice. (a) Inhibitory and excitatory synapses in P91 Arid1b+/+ and Arid1b+/− cortices were examined by immunostaining using antibodies to inhibitory presynaptic markers VIAAT and GAD2 and an excitatory presynaptic marker VGluT1. Scale bar= 5 μm. (b) Quantification of a. The numbers of VIAAT - and GAD2-positive synaptic puncta were decreased in Arid1b+/− mice at P91, while the number of excitatory presynaptic puncta was not different. VIAAT staining (t18= 4.823, ***P= 0.0001): N= 10 mice for Arid1b+/+ (8 males, 2 females) and Arid1b+/− (7 males, 3 females). GAD2 staining (t44= 4.226, ***P= 0.0001): N= 23 mice for Arid1b+/+ (13 males, 10 females) and Arid1b+/− (14 males, 9 females); VGluT1 staining: N= 15 mice for Arid1b+/+ (7 males, 8 females) and Arid1b+/− (7 males, 8 females). Statistical significance was determined by a two-tailed Student’s t test. NS: no significance. (c) A dot plot shows the ratio of VGluT1-positive to VIAAT-positive puncta measured in a and b. Histogram shows the puncta ratio per 2500 μm2 area in the cortex. There was an increase in this ratio in Arid1b+/− cortical samples (t54= 4.435, ***P<0.0001). N= 28 mice for Arid1b+/+ (15 males, 13 females) and Arid1b+/− (14 males, 14 females). Statistical significance was determined by a two-tailed Student’s t test. (d) The mRNA levels of Gad1, Gad2, Gphn, Arhgef9, Slc17a7, Dlg4, Gabra1, Gabrb2 and Gabrg2 were assessed in P91 Arid1b+/+ and Arid1b+/− cortical tissues by using real-time PCR (Gad1:t18= 2.709, *P= 0.0144; Gad2:t18= 2.960, **P= 0.0084; Gphn:t18= 3.865, **P= 0.0011; Arhgef9 :t18= 2.506, *P= 0.0201). N= 10 independent experiments using 10 mice for each group. Statistical significance was determined by a two-tailed Student’s t test. (e) Western blotting with an antibody to GAD1 was performed using cortical lysates from P91 Arid1b+/+ and Arid1b+/− mice. (f) Quantification of e. N= 3 independent experiments using 6 mice for each group (t4= 3.424, *P= 0.0367). The intensity of protein and mRNA was normalized to the GAPDH level. Data were shown as relative changes versus Arid1b+/+ controls. Statistical significance was determined by a two-tailed Student’s t test. Data shown are the mean ± SEM.
To determine if Arid1b haploinsufficiency affects excitatory and inhibitory neurotransmission, we performed whole-cell recordings on pyramidal neurons in cortical slices. No changes were found in the frequency, inter-event interval, and amplitude of mEPSCs between control and Arid1b+/− neurons (Fig. 4a, Supplementary Fig. 10a). In contrast, the frequency of mIPSC was decreased in Arid1b+/− cortical neurons compared with controls (Fig. 4b, Supplementary Fig. 10b). The cumulative fraction curves revealed an increased inter-event interval in Arid1b+/− cortical neurons. We further examined the morphology of inhibitory synapses in Arid1b+/− mice. Arid1b+/− cortices at P91 showed an increase in the cleft width of symmetric synapses, compared with controls, whereas they had the decreased length of postsynaptic density (Fig. 4c, d). Together, our data show that Arid1b haploinsufficiency results in E/I imbalance via abnormal formation and transmission of inhibitory synapses.
Figure 4. Postsynaptic currents and ultrastructure of inhibitory synapses in Arid1b+/− mice.

(a) Histograms show that mEPSC frequency, mEPSC amplitude, and mEPSC cumulative probability plot of inter-event interval were not significantly changed in Arid1b+/− cortical slices compared with Arid1b+/+ cortical slices. Recordings were performed at −70 mV. Data were filtered at 2 kHz (1 kHz for presentation) and digitized at 20 kHz. N= 10 cells from 3 independent experiments using 3 mice for each condition. Statistical significance was determined by a two-tailed Student’s t test. NS: no significance. (b) Histograms show quantification of mIPSC frequency, mIPSC amplitude, and mIPSC cumulative probability plot of inter-event interval. Decreased frequency of mIPSC was observed in Arid1b+/− cortical slices. Inter-event interval of mIPSCs was increased in Arid1b+/− cortical slices. Recordings were performed at 0 mV. Data were filtered at 2 kHz (1 kHz for presentation) and digitized at 20 kHz. N= 10 cells from 3 independent experiments using 3 mice for each condition (t18= 2.447, *P= 0.0249). Statistical significance was determined by a two-tailed Student’s t test. NS: no significance. (c) Electron micrographs of inhibitory (symmetric) synapses (red arrows) in P91 Arid1b+/+ and Arid1b+/− mice (top panels). Scale bar= 250 μm. Higher magnification images were shown in bottom panels (white bars indicate cleft width). Scale bar= 25 μm. (d) Quantification of the synaptic cleft width and the postsynaptic density length. The width of synaptic clefts was increased in Arid1b+/− synapses while the postsynaptic density length was decreased. Synaptic cleft width (t77= 8.456, ***P<0.0001): N= 43 and 44 synapses using 3 mice for Arid1b+/+ and Arid1b+/−, respectively. Synaptic density length (t80= 4.522, ***P<0.0001): N= 38 and 42 synapses using 3 mice for Arid1b+/+ and Arid1b+/−, respectively. Statistical significance was determined by a two-tailed Student’s t test. Data shown are the mean ± SEM.
Arid1b haploinsufficiency disrupts epigenetic programing
We assessed histone H3 acetylation and methylation, essential for transcription regulation, in Arid1b+/− brains. We found that the levels of transcriptional activators, histone H3 acetylation at Lysine 9 (H3K9ac) and histone H3 trimethylation at Lysine 4 (H3K4me3), were decreased in Arid1b+/− cortices, compared with control levels, while the level of the transcriptional repressor, histone H3 trimethylation at Lysine 27 (H3K27me3), was increased (Fig. 5a, b, Supplementary Fig. 7a, b). Arid1b−/− cortices contained H3K9ac and H3K4me3 levels similar to Arid1b+/− samples, but showed the increased level of H3K27me3 (Supplementary Fig. 7a, b). The levels of all histone subunits such as H1, H2A, H3, and H4 showed no changes between Arid1b+/− and control samples (Fig 5a, c). These results suggested that Arid1b haploinsufficiency might suppress the activity of histone acetyltransferases (HATs) or enhance the activity of histone deacetylases (HDACs) in the brain. However, HAT and HDAC assays showed no differences in the activity of the histone modifiers between control and Arid1b+/− cortices (Fig. 5d). H3K9 acetylation can be regulated by the amounts of HATs or HDACs as well as by the activity. Compared with controls, Arid1b+/− cortices showed no changes in mRNA levels of several HATs and HDACs including Crebbp (Cbp), Ep300, Kat2b (Pcaf), Kat5, Hdac1, Hdac2, Hdac3, and Hdac4 (Fig. 5e). We further assessed the levels of histone deacetylase 4 localized in the nucleus and cytosol because nuclear accumulation of the protein is associated with neuronal development. Again, there was no change in nuclear accumulation of this histone deacetylase between Arid1b+/− and control cortices (Fig. 5f). Interestingly, the protein level of acetyl-CREB-binding protein (CBP), which enhances HAT function, was decreased in Arid1b+/− cortices while the levels of CBP and PCAF were not altered (Fig 5g, h, Supplementary Fig. 7a, b). However, the level of PCAF in Arid1b−/− cortices was decreased compared with control and Arid1b+/− sample levels (Supplementary Fig. 7a, b). Next, we examined the physical association of H3K9ac and HATs. ARID1B could potentially mediate the interaction between HATs and histone H3. Indeed, using Co-IP we found decreased levels of CBP and PCAF bound to H3K9ac in Arid1b+/− cortices compared with controls (Fig 5i, j). We verified the reduced binding of the HATs and histone H3 using another method, the proximity-dependent biotin identification (BioID2)16. Similar to the Co-IP results, the levels of CBP and PCAF bound to histone H3 were decreased in Arid1b+/− samples (Fig. 5k, l). These data suggest that ARID1B may function as a bridge between histone H3 and HATs.
Figure 5. Arid1b regulates histone acetylation on the Pvalb promoter.


(a) Western blots show altered histone acetylation and methylation in Arid1b+/− cortices. (b) Quantification of a. The band intensity of each protein was normalized to the GAPDH level. Histone H3 acetylation at K9: t8= 5.163, ***P= 0.0009. Histone H3 trimethylation at Lysine 4: t8= 10.60, ***P<0.0001. Histone H3 trimethylation at Lysine 27: t8= 8.325, ***P<0.0001. N= 5 independent experiments using 5 mice for each genotype. Statistical significance was determined by a two-tailed Student’s t test. (c) The mRNA levels of histone genes were assessed by using real-time PCR in cortical tissues of P91 Arid1b+/+ and Arid1b+/− mice. N= 5 independent experiments using 5 mice for each group. The level of Gapdh mRNA was used for normalization. Data were shown as relative changes in Arid1b+/− versus Arid1b+/+ control samples. Statistical significance was determined by a two-tailed Student’s t test. NS: no significance. (d) The activities of HATs and HDACs showed no changes in Arid1b+/− cortices. N= 5 independent experiments using 5 mice for each genotype. Statistical significance was determined by a two-tailed Student’s t test. NS: no significance. (e) The mRNA levels of Hat and Hdac genes were assessed using real-time PCR in cortical tissues of P91 Arid1b +/+ and Arid1b+/− mice. The levels of mRNAs for histone genes were normalized to the Gapdh mRNA levels. Data were shown as relative changes in Arid1b+/− versus Arid1b+/+ samples. N= 9 independent experiments using 9 mice for each group. Statistical significance was determined by a two-tailed Student’s t test. No significance was found for each comparison. (f) Western blotting for HDAC4 using nuclear (Nuc) and cytoplasmic (Cyto) extracts prepared from Arid1b+/+ and Arid1b+/− cortices. Histone H3 was used as a nuclear marker. (g) Western blotting showed that the level of acetyl-CBP was decreased, while CBP and PCAF protein levels were not changed in Arid1b+/− cortices. (h) Quantification of g. The band intensity of each protein was normalized to the GAPDH level (t10= 5.521, ***P= 0.0003). N= 6 independent experiments using 6 mice for each condition. Statistical significance was determined by a two-tailed Student’s t test. NS: no significance. (i) Co-immunoprecipitation experiments showed the association of H3K9ac with CBP, PCAF, and ARID1B in cortices. (j) Quantification of i. H3K9ac with CBP: t4= 7.252, **P= 0.0019. H3K9ac with PCAF: t4= 2.883, *P= 0.0472. H3K9ac with ARID1B: t4= 4.230, *P= 0.0134. CBP with H3K9ac: t4= 10.05, ***P= 0.0006. PCAF with H3K9ac: t10= 12.64, ***P= 0.0002. N= 3 independent experiments using 3 mice for each condition. Statistical significance was determined by a two-tailed Student’s t test. (k) The BioID2 assay shows histone H3 interaction with CBP, PCAF, and ARID1B. (l) Quantification of k. CBP: t10= 7.378, ***P<0.0001. PCAF: t10= 4.095, **P= 0.0022. ARID1B: t10= 4.496, **P= 0.0011. N= 6 independent experiments using 6 mice for each condition. Statistical significance was determined by a two-tailed Student’s t test. (m) Real-time PCR showed Pvalb and Ntrk2 mRNA levels in Arid1b+/− cortices. Arid1b: t20= 5.021, ***P= 0.0001. Pvalb: t20= 4.722, ***P= 0.0001. Ntrk2: t20= 3.123, **P= 0.0054. N= 11 independent experiments using 11 mice for each genotype. Statistical significance was determined by a two-tailed Student’s t test. (n) A schematic drawing showing the Pvalb gene promoter regions examined by ChIP-qPCR. (o) The ChIP-qPCR assay showed that ARID1B to the Pvalb promoter was decreased in Arid1b+/− cortices. (p) Quantification of o. Region 1: t6= 3.710, **P= 0.01. Region 2: t6= 3.187, *P= 0.0189. N= 4 independent experiments using 4 mice for each condition. Statistical significance was determined by a two-tailed Student’s t test. (q) The ChIP-qPCR assay showed that the association of H3K9ac with the Pvalb promoter was decreased in Arid1b+/− cortices. (r) Quantification of q. Region 1: t6= 3.274, *P= 0.017. Region 2: t6= 2.510, *P= 0.0459. N= 4 independent experiments using 4 mice for each condition. Statistical significance was determined by a two-tailed Student’s t test. (s) The ChIP-qPCR assay showed that the association of RNA polymerase II phospho-CTD (Ser5) with the Pvalb promoter was decreased in Arid1b+/− cortices. (t) Quantification of s. Region 1: t6= 5.916, **P= 0.001. Region 2: t6= 5.237, **P= 0.0019. N= 4 independent experiments using 4 mice for each condition. Statistical significance was determined by a two-tailed Student’s t test. Data shown are the mean ± SEM.
Arid1b haploinsufficiency led to decreased levels of Pvalb and Ntrk2 transcripts (Fig. 5m). Thus, we investigated whether ARID1B regulates histone H3 acetylation in the Pvalb promoter using the ChIP-qPCR assay. The upstream regions adjacent to the transcription start site of the first exon were analyzed (Fig. 5n). We found that ARID1B bound to the Pvalb promoter around the transcription start site in control cortices (Fig. 5o, p). ARID1B binding to Pvalb promoter regions 1 and 2 was decreased in Arid1b+/− cortices, whereas Pvalb promoter region 3 binding was not changed. To verify that ARID1B binding at the Pvalb promoter causes expression changes via epigenetic mechanisms, we performed other sets of ChIP-qPCR experiments. First, we included two negative controls. We examined whether ARID1B binds to a distal intergenic or an intron region of the Pvalb gene. We found no binding of ARID1B to the regions (Supplementary Fig. 11a, b). Second, we performed the ChIP-PCR to investigate two promoter regions of excitatory neuron-relevant genes, Slc17a7 and Dlg4. The mRNA levels of these genes were not changed in Arid1b+/− cortices compared with control levels (Fig. 3d and Supplementary Fig. 7e). We found that ARID1B bound to the Slc17a7 and Dlg4 promoters around transcription start sites, but the levels of ARID1B binding were not different between control and Arid1b+/− cortices (Supplementary Fig. 11c, d). Finally, we performed two more sets of the ChIP-qPCR assay examining ARID1B binding to the promoters of inhibitory neuron-relevant Gad1 and Slc32a1 genes. Expression of these genes was downregulated in Arid1b+/− cortices (Fig. 3d and Supplementary Fig. 7e). ARID1B was associated with Gad1 and Slc32a1 promoter regions in wild type and Arid1b+/− cortical tissues (Supplementary Fig. 11e, f). The levels of ARID1B binding to the promoters were decreased in Arid1b+/− samples, compared with the levels in controls. These results suggest an adverse effect of Arid1b haploinsufficiency on gene expression related to interneuron development.
Next, we examined an association of H3K9ac with the Pvalb promoter in Arid1b+/− cortices. H3K9ac bound to the Pvalb promoter regions, but the levels of H3K9ac in Pvalb promoter regions 1 and 2 were decreased in Arid1b+/− cortices, similar to the ARID1B interaction pattern to the Pvalb promoter (Fig. 5q, r). To verify that the reduced H3K9ac signature and transcription were specific to the Pvalb gene in parvalbumin cells, we measured the level of H3K9ac binding to promoters of Syt2 and Ppargc1a, which are specifically expressed in parvalbumin interneurons, but not in other types of interneurons or excitatory neurons17–19. We found that the Syt2 and Ppargc1a mRNA levels were not significantly altered in Arid1b+/− cortices compared with the control level (Supplementary Fig. 12a). The ChIP-qPCR assay showed that H3K9ac bound to Syt2 and Ppargc1a promoters in control and Arid1b+/− cortices (Supplementary Fig. 12b–g). The levels of H3K9ac binding to the promoters were not changed in Arid1b+/− samples. These results suggest that by controlling physical access of histone modifiers and subsequently creating favorable and relaxed chromatin environments, ARID1B may facilitate Pvalb gene transcription. Thus, we tested if ARID1B happloinsufficiency interferes with the initiation of Pvalb gene transcription. We performed the ChIP-qPCR assay using an antibody to phosphorylated (Ser5)-carboxy-terminal domain (CTD) of RNA polymerase II. The CTD is distinctly phosphorylated at the serine 5 residue only during transcription initiation. The levels of phospho-CTD (Ser5) associated with the Pvalb promoter were decreased in Arid1b+/− cortices compared with control levels (Fig. 5s, t), indicating that transcription initiation of the Pvalb gene was suppressed in Arid1b+/− cortices. Transcription initiation of the Ntrk2 gene was similarly suppressed in Arid1b+/− cortices (Supplementary Fig. 11g–i). In contrast, the levels of phospho-CTD (Ser5) in the Syt2 promoter were not different between control and Arid1b+/− cortices (Supplementary Fig. 12h, i). Together, our data suggest that ARID1B regulates Pvalb gene expression by recruiting HATs to histone molecules on the target promoter and facilitating chromatin remodeling for transcription initiation control.
Abnormal cognitive and social behavior in Arid1b+/− mice
To address the functional relevancy of the morphological and biochemical changes in Arid1b+/− mice, we examined cognitive, social and emotional behaviors that model clinical features of ASD and intellectual disability. We first performed the Morris water maze test. During the acquisition phase, the differences in escape latency time between the two genotypes continued in a consistent manner after 4 days of training (Fig. 6a), indicating the capacity for spatial learning in Arid1b+/− mice is limited, rather than delayed. In the probe trial, Arid1b+/− mice crossed the platform location fewer times, whereas both control and Arid1b+/− mice showed no differences in swimming distances and swimming speeds (Fig. 6b, c). In the T-maze test, Arid1b+/− mice exhibited an impaired spatial reference memory (Fig. 6d). We also assessed recognition memory using a novel object recognition test. While control mice spent more time approaching and in proximity to the novel object, Arid1b+/− mice did not show any preference for exploring either familiar or novel objects (Fig. 6e). Arid1b conditional mutant mice (Arid1bloxP/+; Dlx5/6-Cre-IRES-EGFP) showed similar impairments in recognition memory (Supplementary Fig. 13a). Additionally, the rotarod test revealed motor learning defects in Arid1b+/− mice (Fig. 6f). These results demonstrate that Arid1b+/− mice have impaired cognitive functioning in areas such as spatial and non-spatial learning and memory.
Figure 6. Arid1b+/− mice show impaired cognitive and social behavior.

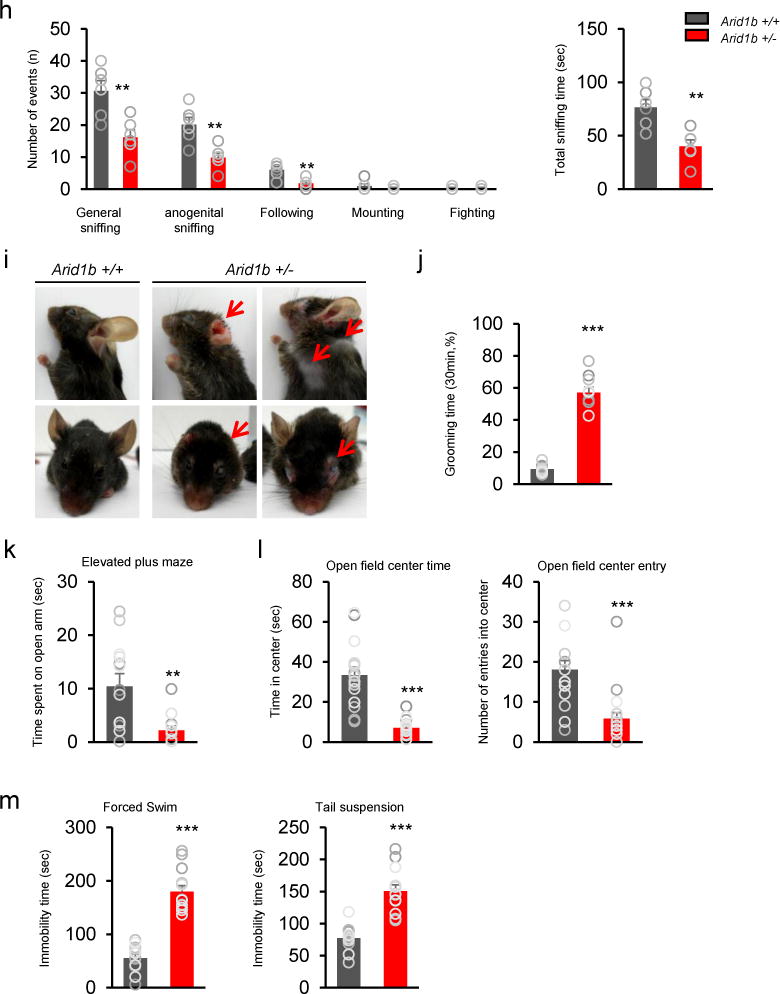
(a) The Morris water maze assay shows spatial learning disability in Arid1b+/− mice. 4 days: t70= 2.031, *P= 0.0463. 5 days: t70= 4.977, ***P<0.0001. 6 days: t70= 5.397, ***P<0.0001. 7 days: t70= 4.374, ***P<0.0001. 8 days: t70= 4.270, ***P<0.0001. 9 days: t70= 4.928, ***P<0.0001. 10 days: t70= 3.932, ***P= 0.0002. N= 8 mice (4 male, 4 female) for Arid1b+/+ and 10 mice (5 male, 5 female) for Arid1b+/−. Statistical significance was determined by a two-tailed Student’s t test. (b) Representative swim paths of Arid1b+/+ and Arid1b+/− mice during a probe trial after training. (c) Quantification of b. Arid1b+/− mice showed a decrease in platform crossings (t16= 3.868, **P= 0.0014). Statistical significance was determined by a two-tailed Student’s t test. NS: no significance. (d) In the T-maze test, the success rate of food retrieval in Arid1b+/− mice was decreased compared with Arid1b+/+ mice (t10= 6.991, ***P<0.0001). N= 6 mice (3 males, 3 females) for each genotype. Statistical significance was determined by a two-tailed Student’s t test. (e) The novel object recognition test was performed. t15= 4.749, ***P= 0.0003. N= 9 (5 males, 4 females) for Arid1b+/+ mice; N= 8 (5 males, 3 females) for Arid1b+/− mice. Statistical significance was determined by a two-tailed Student’s t test. NS: no significance. (f) In the rotarod test, the latency to fall during test phases was reduced in Arid1b+/− mice. 4 days: t34= 2.359, *P= 0.0242. 6 days: t34= 2.198, *P= 0.0353. 13 days: t34= 2.141, *P= 0.0397. N= 6 mice (3 males, 3 females) for each genotype. Statistical significance was determined by a two-tailed Student’s t test. (g) Using the three-chamber paradigm, the sociability test was performed in Arid1b+/+ and Arid1b+/− mice. t20= 6.313, ***P<0.0001. In the social novelty test, Arid1b+/− mice spent less time with the novel mouse (stranger II) than with the familiar mouse (Stranger I). Arid1b+/+: t20= 4.874, ***P<0.0001. Arid1b+/−: t22= 4.900, ***P<0.0001. N= 11 male mice for Arid1b+/+ and 12 male mice for Arid1b+/−. Statistical significance was determined by a two-tailed Student’s t test. NS: no significance. (h) Social interaction was performed using an open field apparatus. Arid1b+/− mice showed decreased interaction compared with Arid1b+/+ mice (left panel). Sniffing: t10= 3.678, **P= 0.0043. Anogenital sniffing: t10= 3.872, **P= 0.0031. Following: t10= .867, **P= 0.0031. The right panel shows quantification of total sniffing time (t10= 3.896, **P= 0.0033). N= 6 male mice for each genotype. Statistical significance was determined by a two-tailed Student’s t test. (i) Excessive grooming leads to severe facial, neck, and shoulder lesions in Arid1b+/− mice (red arrows). (j) Arid1b+/− mice showed increased grooming time compared with Arid1b+/+ mice (t18= 13.64, ***P<0.0001). N= 10 mice for Arid1b+/+ (6 males, 4 females) and Arid1b+/− (5 males, 5 females). Statistical significance was determined by a two-tailed Student’s t test. (k) In the elevated plus maze test, Arid1b+/− mice spent less time in the open arms (t23= 3.251, **P= 0.0035). N= 13 mice (7 males, 6 females) for Arid1b+/+ and 12 mice (6 males, 6 females) for Arid1b+/−. Statistical significance was determined by a two-tailed Student’s t test. (l) The time spent in the center and the numbers of entries into the center were examined in the open field. Open field center time: t34= 7.189, ***P<0.0001. Open field center entries: t34= 4.713, ***P<0.0001. N= 16 mice (9 males, 7 females) for Arid1b+/+ and 20 mice (11 males, 9 females) for Arid1b+/−. Statistical significance was determined by a two-tailed Student’s t test. (m) In both the forced swim test and the tail suspension test, the immobility time was increased in Arid1b+/− mice. Forced swim test: t23= 9.169, ***P<0.0001. Tail suspension test: t23= 6.416, ***P<0.0001. N= 12 mice (7 males, 5 females) for Arid1b+/+ and 13 mice (7 males, 6 females) for Arid1b+/−. Statistical significance was determined by a two-tailed Student’s t test. Data shown are the mean ± SEM.
Next, we used the three-chamber social test to assess social interaction behavior. In the sociability test, control mice spent more time in the chamber containing an unfamiliar stranger mouse than in the empty chamber, whereas Arid1b+/− and Arid1bloxP/+; DLX-Cre-IRES-EGFP mice showed no preference for either chamber (Fig. 6g, Supplementary Fig. 13b). In a social novelty test, control mice showed preference for the second stranger mouse, whereas Arid1b+/− and Arid1bloxP/+; DLX-Cre-IRES-EGFP mice spent more time in the chamber containing the first, more familiar, stranger mouse. Social interaction in Arid1b+/− mice was confirmed in an open-field apparatus. Arid1b+/− mice exhibited reduced time spent with general sniffing, anogenital sniffing, and following behavior (Fig. 6h). Interestingly, approximately 20% of Arid1b+/− mice demonstrated excessive grooming behavior, resulting in severe self-injury, such as torn ears or hair loss in face, neck, and shoulder regions (Fig. 6i, j). Excessive grooming was also observed in Arid1bLoxP/+; Dlx5/6-Cre-IRES-EGFP, and Arid1bLoxP/+; Nkx2.1-Cre mice (Supplementary Fig. 13c). These results show that Arid1b+/− mice exhibit impaired social interaction and repetitive behaviors, which are core features of ASD.
Individuals with ASD frequently experience heightened anxiety. Using the elevated plus maze test and the open field test, we found that Arid1b+/− and Arid1bloxP/+; DLX-Cre-IRES-EGFP mice showed increased anxiety (Fig. 6k, l, Supplementary Fig. 13d, e). Arid1b mutant mice showed decreased moving distances in the open field test, compared with wild type mice (Supplementary Fig. 14a, b). We also performed the forced-swim test and the tail suspension test to assess depression-related behavior. Arid1b+/− mice showed markedly increased immobilization behavior in both tests compared with control mice (Fig. 6m). Together, our behavioral assessment using Arid1b+/− mice shows that Arid1b haploinsufficiency diminishes intellectual functioning and social interaction, and elevates anxiety-like behavior.
Because Arid1b+/− mice showed a decreased number of GABAergic interneurons in the brain, we examined whether pharmacological modulation of GABA activity could rescue the abnormal behaviors observed in Arid1b+/− mice. We first performed the novel object recognition test in control and Arid1b+/− mice after intraperitoneal injection of clonazepam, a positive allosteric modulator of GABAA receptor. Treatment with clonazepam increased the amount of time Arid1b+/− mice spent investigating the novel object to wild type levels (Fig. 7a). In the three-chamber social test, clonazepam treatment did not induce changes in the measured sociability of either control or Arid1b+/− mice (Fig. 7b). When a second stranger mouse was introduced for the social novelty assessment, however, clonazepam treatment of Arid1b+/− mice successfully rescued the impaired social novelty phenotype. The clonazepam treatment also reversed the reduced center time and moving distance of Arid1b mutant mice in the open field test (Fig 7c, d, Supplementary Fig. 14c). However, depression measures using the forced swim test and the tail suspension test showed no reversible effect of clonazepam in Arid1b+/− mice compared with controls (Fig. 7e, f). Our results showed that clonazepam rescues impaired recognition, social memory and elevated anxiety in Arid1b+/− mice. The decreased mISPC frequency in Arid1b+/− cortical slices was also reversed by the clonazepam treatment (Supplementary Fig. 14d). The mIPSC amplitude was not changed in any condition. Full length Western blots are presented in Supplementary Fig. 15.
Figure 7. Activation of GABA signaling rescues abnormal behaviors in Arid1b+/− mice.

(a) Increase in the GABA tone reverses recognition memory deficits in Arid1b+/− mice. Either saline or 0.0625 mg/kg clonazepam was administered to control and Arid1b+/− mice intraperitoneally, followed by the object recognition test. Saline-treated Arid1b+/+: t14= 9.402, ***P<0.0001. Clonazepam-treated Arid1b+/+: t20= 11.34, ***P<0.0001. Clonazepam-treated Arid1b+/−: t22= 8.345, ***P<0.0001. N= 8 mice (5 males, 3 females) for saline-treated Arid1b+/+, 10 mice (7 males, 3 females) for clonazepam-treated Arid1b+/+, N= 7 mice (5 males, 2 females) for saline-treated Arid1b+/−, and 10 mice (6 males, 4 females) for clonazepam-treated Arid1b+/−. Statistical significance was determined by a two-tailed Student’s t test. NS: no significance. (b) In the sociability test, clonazepam-treated Arid1b+/− mice had no preference for either chamber. Saline-treated Arid1b+/+: t16= 6.082, ***P<0.0001. Clonazepam-treated Arid1b+/+: t16= 6.153, ***P<0.0001. However, the social novelty test showed that social memory in Arid1b+/− mice was restored by clonazepam treatment. Saline-treated Arid1b+/+: t16= 6.767, ***P<0.0001. Clonazepam-treated Arid1b+/+: t16= 5.355, ***P<0.0001. Saline-treated Arid1b+/−: t16= 5.170, ***P= 0.0001. Clonazepam-treated Arid1b+/−: t16= 5.124, ***P= 0.0001. N= 9 male mice for saline-treated Arid1b+/+, 9 male mice for clonazepam-treated Arid1b+/+, 7 male mice for saline-treated Arid1b+/−, and 9 male mice for clonazepam-treated Arid1b+/−. Statistical significance was determined by a two-tailed Student’s t test. NS: no significance. (c) Representative tracing of mouse movement in the open field test. (d) Quantification of c. Open field center time: F3,28= 8.89, ***P<0.0001 for saline-treated Arid1b+/+ versus saline-treated Arid1b+/−; #P<0.05 for saline-treated Arid1b+/− versus clonazepam-treated Arid1b+/−. Center entries: F3,28= 7.668, ***P<0.0001 for saline-treated Arid1b+/+ versus saline-treated Arid1b+/−; #P<0.05 for saline-treated Arid1b+/− versus clonazepam-treated Arid1b+/−. N= 9 mice (6 males, 3 females) for saline-treated Arid1b+/+, 8 mice (5 males, 3 females) for clonazepam-treated Arid1b+/+; 9 mice (6 males, 3 females) for saline-treated Arid1b+/−, and 6 mice (5 males, 1 female) for clonazepam-treated Arid1b+/−. Statistical significance was determined by one-way ANOVA with the Bonferonni correction test. NS: no significance. (e and f) Immobility time was measured in Arid1b+/+ and Arid1b+/− mice by the forced swim test (e) or the tail suspension test (f). Forced swim test: F3,20 = 5.605, *P<0.05 for saline-treated Arid1b+/+ versus saline-treated Arid1b+/−. Tail suspension test: F3,20 = 14.8, ***P<0.0001 for saline-treated Arid1b+/+ versus saline-treated Arid1b+/−; *P<0.05 for saline-treated Arid1b+/+ versus clonazepam-treated Arid1b+/−. N= 6 mice (3 males, 3 females) for saline-treated Arid1b+/+, 6 mice (4 males, 2 females) for clonazepam-treated Arid1b+/+, 6 mice (3 males, 3 females) for saline-treated Arid1b+/−, and 6 mice (5 males, 1 female) for clonazepam-treated Arid1b+/−. Statistical significance was determined by one-way ANOVA with the Bonferonni correction test. NS: no significance. Data shown are the mean ± SEM.
DISCUSSION
Despite recent advances in genetic studies of ASD and intellectual disability, the underlying mechanisms for these neurological conditions remain poorly understood. In this study, we showed that haploinsufficiency of the chromatin remodeling complex gene Arid1b disrupts normal interneuron development and function in the mouse brain. This is an important finding because, while ARID1B haploinsufficiency is known to cause ASD and intellectual disability2–4,20, the cellular and molecular basis for ARID1B haploinsufficiency-related neurodevelopmental disorders has not been delineated. Our results suggest that ARID1B haploinsufficiency disrupts normal histone modifications and histone modifier access to some genes related to interneuron development. Another significant impact of this study is the creation of an animal model for ARID1B haploinsufficiency. The behavioral phenotypes of this mouse recapitulate the deficits in cognitive and social functions observed in individuals with ASD or intellectual disability. This mouse model can be further utilized for anatomical and functional studies examining abnormal neurodevelopmental conditions.
We found that cortical GABAergic interneurons were decreased in Arid1b+/− and Arid1b conditional knockout mice, while interneuron migration routes and speeds remained normal. Thus, the depletion of interneurons in the cerebral cortex appears to be caused by defective proliferation and maintenance of interneuron progenitors in the MGE, the origin of as much as 60–80% of cortical interneurons21. This decrease in cortical interneurons in Arid1b+/− and Arid1b conditional knockout mice was largely specific to parvalbumin-positive neurons. The number of calretinin-positive interneurons, which are mainly derived from the CGE, was not altered in Arid1b+/− mice, suggesting that ARID1B haploinsufficiency may induce differential spatial sensitivity in progenitor regulation. Reduced inhibitory neurons may induce a compensatory increase in the number or level of inhibitory postsynaptic components in Arid1b mutant brains. However, the levels of postsynaptic inhibitory components, Gphn and Arhgef9, were decreased in Arid1b+/− cortices compared with control samples. Thus, in addition to the decreased inhibitory inputs, reduced reception capacity appears to contribute to the disrupted inhibitory transmission in Arid1b+/− mice. Cortical excitatory neurons derived from radial progenitors showed grossly normal positioning, numbers and neurite morphology in Arid1b+/− mice. Our previous work showed that Arid1b knockdown reduced dendritic arborization in cortical pyramidal neurons22. This study used shRNA to knockdown Arid1b. One of the limitations in shRNA-mediated gene knockdown is the difficulty in controlling the quantity of gene knockdown. More than half of Arid1b knockdown could alter pyramidal neuron morphology.
GABAergic interneurons play an important role as inhibitory neurons in neural circuitry by regulating pyramidal neuron activity. Alterations in parvalbumin interneuron numbers and Pvalb mRNA levels have been reported in autistic human brains23–28. Imbalanced E/I is associated with autistic brain composition and is generally caused by deficient GABAergic signaling, leading to broken circuit homeostasis8,29. Pvalb knockout mice also show core symptoms of ASD and exhibit E/I imbalance30,31. Consistently, our mouse model of ASD shows a selective reduction of parvalbumin-positive neurons as well as E/I imbalance in structural and functional synaptic connectivity. The decrease in GABAergic interneurons may cause imbalanced excitation and inhibition in Arid1b+/− brains, leading to abnormal behavior similar to ASD. Aberrant neural mechanisms during interneuron development such as proliferation, placement, neurite outgrowth, and synapse formation might induce behavioral phenotypes individually or cooperatively in Arid1b+/− mice. Specific aspects of interneuron development that play a key role in Arid1b haploinsufficiency-driven behavior remain to be elucidated. Also, we don’t exclude the possibility that some impacts in excitatory neurons caused by Arid1b deficiency could have contributed to abnormal behavior in Arid1b mutant mice.
Our results demonstrated that the levels of histone acetylation and methylation were decreased in Arid1b+/− mice, suggesting a role of ARID1B in remodeling the chromatin complex by inducing the physical access of histone modifying enzymes such as PCAF and CBP to histone molecules. As a result, the target genes in the condensed chromatin could be transformed into a more relaxed structure to create favorable environments for greater levels of gene transcription. The association of ARID1B with HATs or HDACs has been shown to regulate HAT and HDAC activity in mouse osteoblast cells32. However, we found no changes in activity of HATs or HDACs, or in the mRNA levels of multiple HAT, HDAC and histone genes in Arid1b+/− cortices. These results suggest that ARID1B has no direct regulatory activity on HATs or HDACs in the brain. Rather, ARID1B may regulate histone modification via protein-protein interaction with histone modifiers. Recently, studies have shown that mutations in the gene encoding BRG1, the central subunit of the BAF chromatin remodeling complex, reduces the binding of the BAF complex to acetylated histones33,34. The BAF complex is required for histone acetylation by acetyl transferase proteins34. Our data showed that Arid1b haploinsufficiency decreases the expression levels of interneuron-associated genes, Pvalb and Ntrk2, and alters epigenetic signatures in the brain. Still, understanding the genomic mechanisms and parvalbumin neuron-specificity of these mechanisms requires further work. It is possible that the decreased number of parvalbumin-positive neurons in Arid1b mutants could lead to the reduced epigenetic signatures for phospho-CTD (Ser5) and H3K9ac to the Pvalb promoter. Alternatively, given the high level changes in overall histone modifications in Arid1b mutant brains, the epigenetic changes may occur broadly in several other cell types.
Our mouse model effectively mirrors the behavioral characteristics of intellectual disability and ASD. Arid1b+/− and Arid1b conditional knockout mice displayed impaired spatial learning, recognition memory, and reference memory. Open field and social behavior tests also revealed decreased social interaction in the mice. Mice with mutations in genes encoding Smarca2 and Actl6b, other subunits of the BAF complex, have severe defects in social interaction and long-term memory35. Thus, this chromatin remodeling complex may provide a cellular and molecular platform for normal intellectual and social behavior. In addition, Arid1b+/− mice showed heightened levels of anxiety- and depression-related behaviors, which are common symptoms of ASD36. For people with intellectual disability, the prevalence of anxiety disorders has likewise been shown to be much higher37. This may be due to reduced cognitive function and increased vulnerability to environmental demands. Communication difficulties may also make it more difficult for people with cognitive disabilities to deal with anxiety or fear. ARID1B haploinsufficiency may be responsible for multiple facets of characteristic ASD behaviors. Other isoforms of Arid1b that are not affected by the Arid1b mutation could exist in the mouse line. Additionally, it is possible that the genetic background for the mouse line may impact the effect of Arid1b haploinsufficiency. Thus it is important to consider allele specificity, genetic backgrounds, and knockout strategies for comparing phenotypes of other Arid1b haploinsufficiency models. In a recent study, an Arid1b mouse generated using CRISPR/Cas9 gene-editing shows impairments in social and anxiety behavior as well as body growth38. These phenotypes are consistent with our mouse model. However, the Arid1b mouse shows no learning, memory, and cognitive deficiencies, which is contrast with our findings and surprising given the association of Arid1b haploinsufficiency with intellectual disability.
GABA allosteric modulators including clonazepam, a benzodiazepine, have been used to treat seizures and anxiety39. We found that clonazepam injection rescues deficits in object and social recognition and anxiety in Arid1b+/− mice. These results suggest that treatment with a benzodiazepine could be a potential pharmacological intervention for symptoms of ASD. Furthermore, our results suggest that pharmacological manipulation of GABA signaling is a potential treatment strategy for cognitive and social dysfunctions in ASD- or intellectual disability-associated disorders due to mutations in chromatin remodeling genes.
METHODS
Methods, including statements of data availability and any associated accession codes and references, are available in the online version of the paper.
ONLINE METHODS
Generation of Arid1b knockout mice
The ES cell clone used for creating the Arid1b mouse model was the JM8.N4 strain obtained from the European Conditional Mouse Mutagenesis program (EUCOMM) and contains a “knockout first” design (https://www.mousephenotype.org/data/alleles/MGI:1926129/tm1a(EUCOMM)Hmgu/ IKMC project ID: 25129). Exon 5 of the Arid1b gene was targeted to create a deletion allele. The knockout first allele for the Arid1b locus was created by injecting the targeted ES cell clones into the blastocysts derived from an albino C57BL6 strain (Jackson Laboratory, #000058) in the Mouse Genome Engineering Core Facility at the University of Nebraska Medical Center. The chimeras were first bred to a Flpo mouse strain (MMRRC UCD, stock # 036512) to delete the knockout first cassette in the intron 4–5 and convert the allele to the floxed allele. Elimination of the neomycin cassette was confirmed by PCR genotyping. The heterozygous floxed mice were crossed with appropriate Cre drivers for tissue-specific Arid1b deletion. To generate the global Arid1b KO allele, the knockout first allele was crossed with a CMV-Cre mouse strain (Jackson laboratory, #006054), and the resulting Arid1b KO allele in which the neo cassette, one FRT, one loxP, and exon 5 were removed was selected by genomic PCR and sequencing using appropriate primers. The genomic sequences showing the deletion break points of mutant genomic DNAs were shown in Supplementary Table 2. Based on the lack of protein in the null mice, we presume that the transcript from the deleted allele undergoes nonsense-mediated decay. The Mice were housed in a cage with 12:12h light-dark cycle. No more than 5 mice were housed in a cage. Mice were handled according to a protocol approved by the University Nebraska Medical Center Institutional Animal Care and Use Committee.
Real-time reverse transcription PCR
Quantitative real-time PCR was performed as described previously40. Total RNA was extracted from wild-type and Arid1b mutant brain tissues using Trizol reagent (Invitrogen). First-strand complementary DNA (cDNA) was prepared by reverse transcription using the Verso cDNA synthesis kit (Thermo Fisher Scientific). To determine the conditions for the logarithmic phase during PCR amplification with target mRNA, aliquots (1 μg) were amplified using different numbers of cycles. A linear relationship between PCR product band visibility and number of amplification cycles was observed for target mRNAs. Real-time PCR was performed with 1 μl of the cDNA template added to 10 μl of 2x SYBR Premix Ex Taq (Applied Biosystems) and specific primers (10 pM each). Primer sequences are presented in Supplementary Table 3. Real-time PCR (Applied Biosystems) was carried out for 40 cycles of denaturation at 95°C for 15 sec, annealing at 58°C for 15 sec, and extension at 72°C for 15 sec. Target gene expression was quantified relative to that of an internal control gene (GAPDH) based on the comparison of the threshold cycle (CT) at constant fluorescence intensity. The amount of transcript was inversely related to the observed CT and the CT was expected to increase by 1 for every two-fold dilution of the transcript. Relative expression (R) was calculated using the equation R = 2−[ΔCT sample-ΔCT control]. All data were normalized relative to GAPDH as well as to the respective controls.
Western blot analysis and Immunoprecipitation
Western blotting and immunoprecipitation were performed as described previously41. For Immunoprecipitation, rabbit-anti-H3K9ac antibody (Abcam, ab4441, 1:200), rabbit anti-CBP (Cell Signaling Technology, #7389, 1:200) and rabbit anti-PCAF (Cell Signaling Technology, #3378, 1:200) were immobilized on Dynabeads protein G (Invitrogen). Reaction mixtures were rocked at 4°C for 24 h and the beads were washed four times with washing buffer. The beads were separated from the supernatant by binding to DynaMag-2 (Life Technology). After running on a PAGE gel and performing membrane transfer, the resulting blot was subjected to Western blotting. Primary antibodies used for Western blotting were mouse anti-ARID1B (Abcam, ab57461, 1:1,000; Abnova, H00057492-M02, 1:1,000), mouse anti-GAD1 (Millipore, MAB5406, 1:1,000), rabbit anti-calbindin-D28k (Millipore, AB1778, 1:1,000), mouse anti-calretinin (Millipore, MAB1568, 1:1,000), rabbit anti-H3K9ac (Abcam, ab4441, 1:1,500), rabbit anti-H3K4me3 (Cell Signaling Technology, #9751, 1:1,500), rabbit anti-H3K27me3 (Cell Signaling Technology, #9733, 1:1,500), rabbit anti-H3 (Cell Signaling Technology, #4499, 1:2,000), rabbit anti-Acetyl-CBP/p300 (Cell Signaling Technology, #4771, 1:800), rabbit anti-CBP (Cell Signaling Technology, #7389, 1:1,000), rabbit anti-PCAF (Cell Signaling Technology, #3378, 1:1,500), rabbit anti-HDAC4 (Sigma-Aldrich, H9411, 1:1,500), rabbit anti-β-catenin (Cell Signaling Technology, #8480, 1:1,000), rabbit anti-p-β-catenin (Phospho Solution, P120-3337, 1:1,000), rabbit anti-Cyclin D1 (Cell Signaling Technology, #2922, 1:1,000), rabbit anti-HA (Cell Signaling Technology, #3724, 1:1,500) or rabbit anti-GAPDH (Millipore, MAB374, 1:2,000). Membranes were developed and imaged using ECL chemiluminescence reagent (Thermo Fisher Scientific) and the Fluo-chem HD2 imaging system (ProteinSimple), respectively. Signal specificity was ensured by omitting each primary antibody. For quantification of band intensity, blots from 3 independent experiments for each molecule of interest were analyzed using ImageJ software (NIH). Background samples from an area near each lane were subtracted from each band to acquire mean band density. GAPDH was used as an internal control to normalize band intensity.
Immunostaining
Immunostaining of brain sections or dissociated cells was performed as described previously42,43. Primary antibodies used were mouse anti-ARID1B (Abcam, ab57461, 1:500; Abnova, H00057492-M02, 1:500), rabbit anti-GABA (Sigma, A2052, 1:500), mouse anti-parvalbumin (Millipore, MAB1572, 1:500), rabbit anti-cleaved caspase-3 (Cell Signaling Technology, #9664, 1:300), mouse anti-BrdU (BD Biosciences, #555627, 1:800), rabbit anti-Phospho-Histone H3 (Cell Signaling Technology, #9701, 1:800), rabbit anti-VIAAT (Phosphosolution, 2100-VGAT, 1:500), guinea pig anti- VGluT11 (Millipore, AB5905, 1:500), rat anti-GAD2 (Developmental Studies Hybridoma Bank, GAD6, 1:500), rat anti-somatostatin (Millipore, MAB354, 1:500), rabbit anti-calbindin-D28k (Millipore, AB1778, 1:500), mouse anti-calretinin (Millipore, MAB1568, 1:500), rabbit anti-Cux1 (Santa Cruz, sc-13024, 1:500), mouse anti-NeuN (Millipore, MAB377, 1:1000), rabbit anti-TBR1 (Millipore, AB10554, 1:500), rabbit anti-Olig2 (Millipore, AB9610, 1:500), rabbit anti-GFAP (DAKO, Z0334, 1:500), rabbit anti-PSD95 (Abcam, ab18258, 1:500) and chicken anti-GFP (Invitrogen, A10262, 1:1,500) antibodies. Appropriate secondary antibodies conjugated with Alexa dyes (Invitrogen) were used to detect primary antibodies. DAPI (Sigma-Aldrich) was used to stain nuclei.
Morphometry
For the quantification of numbers and lengths of cells and neurites, images of 20 different brain sections at periodic distances along the rostro-caudal axis were taken with Zeiss LSM710 confocal microscopes as described previously44. N numbers for each experiment were described in figure legends. Mouse Cultured neurons were also assessed with these microscopes. More than 20 fields scanned horizontally and vertically were examined in each condition. Cell numbers were described in figure legends. The images were analyzed using ZEN (Zeiss), QCapture software (QImaging), and ImageJ (NIH). The calculated values were averaged, and some results were recalculated as relative changes versus control.
Cell culture
The medial ganglionic eminence (MGE) cells were isolated from E12.5–14.5 mice. Meninges were removed and MGE cells were dissociated with trituration after trypsin/EDTA treatment. The cells were plated onto poly-D-lysine/laminin-coated coverslips and cultured in the medium containing Neurobasal medium (Invitrogen), 2 mM glutamine, 2% (v/v) B27 supplement (Invitrogen), 1% (v/v) N2 supplement (Invitrogen), and 50 U/mL penicillin/streptomycin (Invitrogen).
TUNEL assay
As described previously45, tissue sections and cell cultures were fixed with 4% PFA, and in situ detection of cells with DNA-strand breaks was performed using In Situ Cell Death Detection Kit (Roche Diagnostics) according to the manufacture’s instruction.
Time-lapse experiments
Organotypic brain slices were prepared from E13.5 mice as described previously46,47. Cortical slices from Dlx5/6-Cre-IRES-EGFP mice crossed with Arid1b+/+ or Arid1b+/− allele were embedded in 3% low melting point agarose and coronal cortical slices at 250 μm thickness were prepared using a LEICA VT1000S vibratome. The slices were then placed on poly-lysine/laminin-coated transwell inserts and cultured in neurobasal media organotypically using an air interface protocol until imaging. For time-lapse imaging, an LSM710 inverted confocal microscope (Zeiss) equipped with a CO2 incubator chamber (5% CO2, 37°C) was used. Multiple Z-stacks with the options of 10–20 successive ‘z’ optical planes spanning 50–70 μm were acquired on pre-selected positions of electroporated slices. Repetitive imaging was performed every 30 min for up to 8 h. Mean velocity of migrating cells was obtained using the ImageJ plug-in Manual Tracking.
Electron microscopy
Brains were fixed in 2% glutaraldehyde and 2% paraformaldehyde in 0.1 M cacodylate buffer overnight at 4°C. Coronal brain slices (150 μm) were made with a vibratome. Samples were then post-fixed with 1% OsO4 for 1 h, dehydrated, and embedded in Araldite resin (Electron Microscopy Sciences). Thin sections (60 nm) were post-stained with 2% uranyl acetate and Reynold’s lead citrate. Imaging was performed on a FEI Tecnai G2 Spirit transmission electron microscope equipped with a LAB6 crystal operating at an accelerating voltage of 80 kV. The digital images were captured with AMT CCD camera. Excitatory and inhibitory synapses were analyzed separately after classification into “symmetric” and “asymmetric” synapses. The synaptic cleft was measured as the gap between the presynaptic and postsynaptic membranes in digitally magnified images. The synaptic length was assessed as the length of postsynaptic density.
Whole-cell electrophysiology and data analysis
Voltage-clamp whole-cell recordings were obtained from slices of wild-type and mutant cerebral cortices. Acute prefrontal cortical slices were placed in ice-cold artificial cerebrospinal fluid (ACSF) of the following composition (in mM): 130 NaCl, 24 NaHCO3, 3.5 KCl, 1.25 NaH2PO4, 2.4 CaCl2, 2.5 MgCl2 and 10 glucose saturated with 95% O2/5% CO2. 300 μm thick coronal sections were collected using vibrating microtome (Leica VT1200, Buffalo Grove, IL, USA). Whole-cell patch recordings were obtained from layer V prelimbic cortical pyramidal neurons with patch pipettes (3–5 mOhm) filled with a solution containing 126 mM cesium methanesulfonate, 8 mM NaCl, 10 mM HEPES, 2.9 mM QX-314, 8 mM Na2-phosphocreatine, 0.3 mM Na2GTP, 4 mM MgATP, 0.1 mM CaCl2, 1 mM EGTA (pH 7.3). Neurons were held at a holding potential of −70 mV for mEPSCs and 0 mV for mIPSCs. For recording mEPSCs 1 μM tetrodotoxin and 100 μM picrotoxin were added to the external recording solution, and for mIPSCs 1 μM tetrodotoxin, 10 μM NBQX and 50 μM D-AP5 were added. The slices were treated with 10 μM clonazepam for 7 min after 5 min baseline recording and followed by 7 min wash. Signal was filtered at 2 kHz and digitized at 20 kHz using an Axon Digidata 1440A analog-to-digital board (Molecular Devices). Recordings were performed from three mice for each genotype. Recordings with a pipette access resistance less than 20 mOhm and that of less than 20% changes during the duration of recording were included. The mEPSC and mIPSC recordings were analyzed using minianalysis software (Synaposoft) with an amplitude threshold set at 6–8 pA for cultured neuron recordings and 5 pA for slice recordings. The frequency, amplitude and decay were measured in each group.
Chromatin Immunoprecipitation (ChIP) PCR assay
ChIP analysis was performed by using the Magna ChIP Kit (Millipore). Briefly, Arid1b mutant cortical tissues were cross-linked with 1.5% formaldehyde for 20 min at room temperature. This reaction was stopped by adding 0.125 M glycine for 5 min, and the samples were then washed three times with PBS at room temperature. Tissues were dissociated with 20–25 strokes by the Dounce Homogenizer (Wheaton). Dissociated cells were then lysed and sonicated with the S220 High Performance Ultrasonicator (Covaris). Sonicated chromatin, dynabeads protein A/G (Invitrogen) and appropriate antibodies were mixed and incubated overnight at 4°C with gentle shaking. ChIP-grade anti-H3K9ac (Abcam, ab4441, 1:100), anti-ARID1B (Abcam, ab57461, 1:100) and anti-RNA polymerase II phospho-Ser5 (Abcam, ab5131, 1:100) antibodies were used. Beads were washed and reverse cross-linked according to the Magna ChIP Kit protocol. The DNA captured by the immunoprecipitated protein was subjected to PCR.
BioID pull down
The Histone H3 (H3) cDNA was amplified by PCR and inserted into the MCS-BioID2-HA vector (Addgene) using EcoRI and BamHI sites. Proximity-dependent biotin identification (BioID) pull down was performed as described previously16. The cloned H3 in MCS-BioID2-HA vector was transfected into MGE cells using Lipofectamine LTX (Life Technology), as recommended by the manufacturer. At 6 days in vitro (DIV) MGE cells were incubated with 50 μM biotin for 18 hours. After two PBS washes, cells were lysed in lysis buffer containing 50 mM Tris, pH 7.4, 500 mM NaCl, 0.4% SDS, 1 mM dithiothreitol, and 1 × protease inhibitor (Thermo Fisher Scientific). Cells were collected and treated with Triton X-100 to a 2% final concentration. After two 1 minute rounds of sonication each at 30% duty cycle and an output level of 4 (Sonifier-250; Branson), an equal volume of 50 mM Tris, pH 7.4, was added and cleaned using centrifugation at 16,500 × g for 10 min. The supernatant was collected in a 15-ml conical tube and incubated with 300 μl Dynabeads overnight. Beads were collected using a magnetic stand and washed twice with 2% (wt/vol) SDS, once with wash buffer containing 0.1% deoxycholate, 1% Triton X-100, 500 mM NaCl, 1 mM EDTA, and 50 mM 4-(2-hydroxyethyl)-1-piperazineethanesulfonic acid, pH 7.5, once with wash buffer containing 250 mM LiCl, 0.5% NP-40, 0.5% deoxycholate, 1 mM EDTA, and 10 mM Tris, pH 8, and once with 50 mM Tris.
Golgi staining
Golgi staining was performed using the FD Rapid Golgi Stain kit (FD NeuroTechnologies). Freshly dissected brains were immersed in solutions A and B for 2 weeks at room temperature and then transferred into solution C for 24 h at 4°C in the dark. The brains were sliced using a vibratome (Leica) at a thickness of 80 μm.
Behavioral assays
All behavioral assays were done during light cycle. Health conditions including weights, activity and feeding were checked prior to assays. We used 3–4 month-old male and female mice for most behavioral assays. For social behavior assays, we used only male mice because sexual interactions between males and females may interfere with accurate interpretation of social behavior. All behavioral assays were done blind to genotypes with age-matched littermates of mice.
Morris water maze test
Mice were introduced into the perimeter of a circular water-filled tank 110 cm in diameter and 91 cm in height (San Diego Instruments) with visual cues that were present on the tank walls as spatial references. The tank was divided into four equal quadrants (Q1–4) by lines drawn on the floor. A 10 cm circular plexiglass platform was submerged 1 cm deep in Q2 and as such hidden from the mice. The mice started the task from one of three quadrants Q1, Q3 and Q4, varied by day of testing. Four trials were performed per mouse per day for ten days. Each trial lasted 1 minute and ended when the mouse climbed onto and remained on the hidden platform for ten seconds. The mouse was given 20 seconds to rest on the platform between trials. The time taken by the mouse to reach the platform was recorded as its latency. The time for four trials was averaged and recorded as a result for each mouse. On day 11, the mice were subjected to a single 60-second probe trial without a platform to test memory retention. The mice started the trial from Q4, number of annulus crossings was counted, and the swimming path was recorded and analyzed using the Ethovision XT 7 tracking software (Noldus).
T-Maze test
A mouse was first subjected to food-deprivation to 85% of their free-feeding body weight before starting the appetitively-motivated T-maze test. The T-Maze apparatus contained the start arm (28 wide × 5 long × 10 high cm) and the two identical goal arms (35 × 5 × 10 cm) surrounded by a 10 cm high wall. The test mouse was habituated to the T-maze apparatus and allowed to obtain food from the end of goal arms for 5 mins. Ten training trials per day were then performed for 5 days. One reinforcer (Noyes sucrose pellet, 20 mg) was available in the designated goal arm for each trial. At the beginning of each test session, the mouse was placed in the start box at the bottom of the start arm. When the start box door was opened, the mouse was given a choice between entering either goal arm. If the mouse made the correct choice, it was given time to consume the sugar pellet, and then guided back into the start box for the next trial. Incorrect choices were not rewarded. For each successive trial, the reward was always placed in the same arm.
Novel object recognition test
A test mouse was first habituated to an open field arena (35 × 42 cm) for 5 min. Following habituation, the test mouse was removed from the arena and two identical objects with size (10.5 × 4.5 × 2.5 cm) were placed in the opposite corners of the arena, 7 cm from the side walls. Then the test mouse was reintroduced into the center of the arena and allowed to explore the arena including the two novel objects for 10 min. After 6 h, one object was replaced with another novel object, which was of similar size but different shape and color than the previous object. The same test mouse was placed in the arena to explore the arena and the two objects. The movement of mice was recorded by a camera for 10 min and further analyzed by the video tracking EthoVision XT 7 software (Noldus).
Rotarod test
Using an accelerating Rotamex 4/8 (Columbus Instruments International) the rotarod test was performed by placing mice on rotating drums (3 cm diameter) and measuring retention time on the rod. The speed of the rotarod accelerated from 4 to 40 rpm over a 5-min period. Three trials per day over a 16-day period were conducted. At least 20 min recovery time was allowed between trials.
Three-chamber test for social interaction and novelty behavior
Social behavior was evaluated as described previously40. A rectangular and transparent Plexiglas box divided by walls into three equal-sized compartments (Ugobasile) was used. Rectangular holes in the Plexiglas walls provide access between the chambers. For sociability testing, the test mouse was moved to the center chamber (chamber 2) with the entrances to the two connecting chambers blocked. A stimulus mouse (unfamiliar mouse) designated as “stranger 1” was placed in a wire enclosure in chamber 1. Then, the openings to the flanking two chambers (1 and 3) were opened and the test mouse was allowed to explore the entire apparatus for 10 min. For the social novelty test, the stranger 1 mouse was randomly placed in one of the enclosures in which the test mouse had the choice of whether to investigate the stranger 1 mouse or a novel mouse, designated “stranger 2”. This novel mouse was taken from a different home cage and placed into the remaining empty wire enclosure. Time spent sniffing each partner by the test mouse was recorded for 10 min in both sociability and social novelty behavior tests. All apparatus chambers were cleaned with water and dried with paper towels between trials. At the end of each test day, the apparatus was sprayed with 70% ethanol and wiped clean with paper towels.
Open field social interaction test
Two Arid1b mutant or wild-type mice were placed in opposite corners of the open-field arena and allowed to explore freely for 10 min. Frequency and total duration of the active socio-positive behaviors including general sniffing, anogenital sniffing, following, mounting, and fighting were scored.
Spontaneous self-grooming
A mouse was placed in a clear plastic cage (17 × 32 × 14 cm). The mouse was allowed to freely explore the cage for the entirety of the test. The first 10 min served as a habituation period. The movement of the mouse was recorded by a camera for 30 min. Recorded grooming behaviors included head washing, body grooming, genital/tail grooming and paw and leg licking.
Elevated plus-maze test
The elevated plus-maze test was performed as previously described40. The apparatus (EB Instrument) includes two open arms (35 × 5 cm), two enclosed arms (35 × 5 × 15 cm), and a central platform (5 × 5 cm). The entire apparatus was elevated 45 cm above the floor. A mouse was placed on the central platform, facing the same open arm and allowed to roam freely for 5 minutes. The number of entries into, and the time spent on open and closed arms were recorded. Percent open arm time was calculated as time spent in the open arms divided by the total time. Rearing frequency was also recorded.
Open field test
A mouse was placed near the wall-side of a 35 × 42 cm open-field arena, and the movement of the mouse was recorded by a camera for 5 min. The recorded video file was further analyzed using EthoVision XT 7.0 software (Noldus). The number of entries into, and the overall time spent in, the center of the arena (15 × 15 cm imaginary square) were measured. The open field arena was cleaned with 70% ethanol between each trial.
Forced swimming test
A mouse was placed individually into a glass cylinder (20 cm height, 17 cm diameter) filled with water to a depth of 10 cm at 25°C. After 5 minutes, the animals were removed from the water, dried, and returned to their home cages. They were again placed in the cylinder 24 hr later, and after the initial 1 min acclimatization period, the total duration of immobility was measured for 5 min. Motionless floating was considered immobile behavior.
Tail suspension test
A mouse was suspended from the hook of a tail suspension test box, 60 cm above the surface of a table using adhesive tape placed 1 cm away from the tip of the tail. After 1 min acclimatization, immobility duration was recorded by a camera for 5 minutes. Mice were considered immobile only when they hung passively and were completely motionless.
Statistical analysis
Normal distribution was tested using Kolmogorov-Smirnov test and variance was compared. Unless otherwise stated, statistical significance was determined using two-tailed unpaired Student’s t-tests for two population comparison or one-way ANOVA followed by the Bonferroni’s post hoc test for multiple comparisons. Data were analyzed using the GraphPad Prism and presented as means ± SEM. P values for each comparison were described in the results, legends, or supplementary information section. To determine and confirm sample sizes (N), we performed a power analysis. The values for the power (1-β) and the type I error rate (α) were 0.8 and 0.05 (or 0.01), respectively. Each experiment in this study was performed blind and randomized. Animals were assigned randomly to the various experimental groups, and data were collected and processed randomly. The allocation, treatment, and handling of animals were the same across study groups. Control animals were selected from the same litter as the test group. The individuals conducting the experiments were blinded to group allocation and the allocation sequence. Exclusion criteria for mice were based on abnormal health conditions including weights below 15g at 6 weeks and noticeably reduced activity or feeding. Statistical data and N numbers for all behavioral assays were described in Supplementary Table 4.
Supplementary Material
Acknowledgments
Research reported in this publication was supported by an award from the National Institute of Neurological Disorders and Stroke of the National Institutes of Health under award number R01NS091220 and an Institutional Development Award (IDeA) from the National Institute of General Medical Sciences of the National Institutes of Health under award number P20GM103471 to WYK.
Footnotes
Note: Any Supplementary Information and Source Data files are available in the online version of the paper.
AUTHOR CONTRIBUTIONS
E.J. and W.K. designed, performed and analyzed the experiments, and wrote the paper. J.J.M., C.G. and J.L. performed the experiments. S.D. designed and analyzed the experiments. W.K conceived and supervised the study.
COMPETING FINACIAL INTERESTS
Authors declare no competing financial interests.
Data availability
The data that support the findings of this study are available from the corresponding author upon reasonable request.
References
- 1.Ellison JW, Rosenfeld JA, Shaffer LG. Genetic basis of intellectual disability. Annu Rev Med. 2013;64:441–450. doi: 10.1146/annurev-med-042711-140053. [DOI] [PubMed] [Google Scholar]
- 2.Halgren C, et al. Corpus callosum abnormalities, intellectual disability, speech impairment, and autism in patients with haploinsufficiency of ARID1B. Clin Genet. 2012;82:248–255. doi: 10.1111/j.1399-0004.2011.01755.x. [DOI] [PMC free article] [PubMed] [Google Scholar]
- 3.Santen GW, et al. Mutations in SWI/SNF chromatin remodeling complex gene ARID1B cause Coffin-Siris syndrome. Nat Genet. 2012;44:379–380. doi: 10.1038/ng.2217. [DOI] [PubMed] [Google Scholar]
- 4.Hoyer J, et al. Haploinsufficiency of ARID1B, a member of the SWI/SNF-a chromatin-remodeling complex, is a frequent cause of intellectual disability. Am J Hum Genet. 2012;90:565–572. doi: 10.1016/j.ajhg.2012.02.007. [DOI] [PMC free article] [PubMed] [Google Scholar]
- 5.Ronan JL, Wu W, Crabtree GR. From neural development to cognition: unexpected roles for chromatin. Nat Rev Genet. 2013;14:347–359. doi: 10.1038/nrg3413. [DOI] [PMC free article] [PubMed] [Google Scholar]
- 6.Lopez AJ, Wood MA. Role of nucleosome remodeling in neurodevelopmental and intellectual disability disorders. Front Behav Neurosci. 2015;9:100. doi: 10.3389/fnbeh.2015.00100. [DOI] [PMC free article] [PubMed] [Google Scholar]
- 7.Marin O. Interneuron dysfunction in psychiatric disorders. Nat Rev Neurosci. 2012;13:107–120. doi: 10.1038/nrn3155. [DOI] [PubMed] [Google Scholar]
- 8.Nelson SB, Valakh V. Excitatory/Inhibitory Balance and Circuit Homeostasis in Autism Spectrum Disorders. Neuron. 2015;87:684–698. doi: 10.1016/j.neuron.2015.07.033. [DOI] [PMC free article] [PubMed] [Google Scholar]
- 9.Ben-Ari Y. The GABA excitatory/inhibitory developmental sequence: a personal journey. Neuroscience. 2014;279:187–219. doi: 10.1016/j.neuroscience.2014.08.001. [DOI] [PubMed] [Google Scholar]
- 10.Robertson CE, Ratai EM, Kanwisher N. Reduced GABAergic Action in the Autistic Brain. Curr Biol. 2015;26:80–85. doi: 10.1016/j.cub.2015.11.019. [DOI] [PubMed] [Google Scholar]
- 11.Han S, et al. Autistic-like behaviour in Scn1a+/− mice and rescue by enhanced GABA-mediated neurotransmission. Nature. 2012;489:385–390. doi: 10.1038/nature11356. [DOI] [PMC free article] [PubMed] [Google Scholar]
- 12.Moffat JJ, Ka M, Jung EM, Kim WY. Genes and brain malformations associated with abnormal neuron positioning. Mol Brain. 2015;8:72. doi: 10.1186/s13041-015-0164-4. [DOI] [PMC free article] [PubMed] [Google Scholar]
- 13.Skarnes WC, et al. A conditional knockout resource for the genome-wide study of mouse gene function. Nature. 2011;474:337–342. doi: 10.1038/nature10163. [DOI] [PMC free article] [PubMed] [Google Scholar]
- 14.Stenman J, Toresson H, Campbell K. Identification of two distinct progenitor populations in the lateral ganglionic eminence: implications for striatal and olfactory bulb neurogenesis. The Journal of neuroscience: the official journal of the Society for Neuroscience. 2003;23:167–174. doi: 10.1523/JNEUROSCI.23-01-00167.2003. [DOI] [PMC free article] [PubMed] [Google Scholar]
- 15.Xu Q, Tam M, Anderson SA. Fate mapping Nkx2.1-lineage cells in the mouse telencephalon. The Journal of comparative neurology. 2008;506:16–29. doi: 10.1002/cne.21529. [DOI] [PubMed] [Google Scholar]
- 16.Kim DI, et al. An improved smaller biotin ligase for BioID proximity labeling. Mol Biol Cell. 2016;27:1188–1196. doi: 10.1091/mbc.E15-12-0844. [DOI] [PMC free article] [PubMed] [Google Scholar]
- 17.Sommeijer JP, Levelt CN. Synaptotagmin-2 is a reliable marker for parvalbumin positive inhibitory boutons in the mouse visual cortex. PloS one. 2012;7:e35323. doi: 10.1371/journal.pone.0035323. [DOI] [PMC free article] [PubMed] [Google Scholar]
- 18.Lucas EK, et al. PGC-1alpha provides a transcriptional framework for synchronous neurotransmitter release from parvalbumin-positive interneurons. The Journal of neuroscience: the official journal of the Society for Neuroscience. 2014;34:14375–14387. doi: 10.1523/JNEUROSCI.1222-14.2014. [DOI] [PMC free article] [PubMed] [Google Scholar]
- 19.Cowell RM, Blake KR, Russell JW. Localization of the transcriptional coactivator PGC-1alpha to GABAergic neurons during maturation of the rat brain. The Journal of comparative neurology. 2007;502:1–18. doi: 10.1002/cne.21211. [DOI] [PubMed] [Google Scholar]
- 20.Tsurusaki Y, et al. Mutations affecting components of the SWI/SNF complex cause Coffin-Siris syndrome. Nat Genet. 2012;44:376–378. doi: 10.1038/ng.2219. [DOI] [PubMed] [Google Scholar]
- 21.Wonders CP, Anderson SA. The origin and specification of cortical interneurons. Nat Rev Neurosci. 2006;7:687–696. doi: 10.1038/nrn1954. [DOI] [PubMed] [Google Scholar]
- 22.Ka M, Chopra DA, Dravid SM, Kim WY. Essential Roles for ARID1B in Dendritic Arborization and Spine Morphology of Developing Pyramidal Neurons. The Journal of neuroscience: the official journal of the Society for Neuroscience. 2016;36:2723–2742. doi: 10.1523/JNEUROSCI.2321-15.2016. [DOI] [PMC free article] [PubMed] [Google Scholar]
- 23.Zikopoulos B, Barbas H. Altered neural connectivity in excitatory and inhibitory cortical circuits in autism. Front Hum Neurosci. 2013;7:609. doi: 10.3389/fnhum.2013.00609. [DOI] [PMC free article] [PubMed] [Google Scholar]
- 24.Stoner R, et al. Patches of disorganization in the neocortex of children with autism. N Engl J Med. 2014;370:1209–1219. doi: 10.1056/NEJMoa1307491. [DOI] [PMC free article] [PubMed] [Google Scholar]
- 25.Reynolds GP, Zhang ZJ, Beasley CL. Neurochemical correlates of cortical GABAergic deficits in schizophrenia: selective losses of calcium binding protein immunoreactivity. Brain Res Bull. 2001;55:579–584. doi: 10.1016/s0361-9230(01)00526-3. [DOI] [PubMed] [Google Scholar]
- 26.Lawrence YA, Kemper TL, Bauman ML, Blatt GJ. Parvalbumin-, calbindin-, and calretinin-immunoreactive hippocampal interneuron density in autism. Acta Neurol Scand. 2010;121:99–108. doi: 10.1111/j.1600-0404.2009.01234.x. [DOI] [PubMed] [Google Scholar]
- 27.Mariani J, et al. FOXG1-Dependent Dysregulation of GABA/Glutamate Neuron Differentiation in Autism Spectrum Disorders. Cell. 2015;162:375–390. doi: 10.1016/j.cell.2015.06.034. [DOI] [PMC free article] [PubMed] [Google Scholar]
- 28.Gogolla N, et al. Common circuit defect of excitatory-inhibitory balance in mouse models of autism. J Neurodev Disord. 2009;1:172–181. doi: 10.1007/s11689-009-9023-x. [DOI] [PMC free article] [PubMed] [Google Scholar]
- 29.Cellot G, Cherubini E. GABAergic signaling as therapeutic target for autism spectrum disorders. Front Pediatr. 2014;2:70. doi: 10.3389/fped.2014.00070. [DOI] [PMC free article] [PubMed] [Google Scholar]
- 30.Wohr M, et al. Lack of parvalbumin in mice leads to behavioral deficits relevant to all human autism core symptoms and related neural morphofunctional abnormalities. Transl Psychiatry. 2015;5:e525. doi: 10.1038/tp.2015.19. [DOI] [PMC free article] [PubMed] [Google Scholar]
- 31.Saunders JA, et al. Knockout of NMDA receptors in parvalbumin interneurons recreates autism-like phenotypes. Autism Res. 2013;6:69–77. doi: 10.1002/aur.1264. [DOI] [PMC free article] [PubMed] [Google Scholar]
- 32.Nagl NG, Jr, Wang X, Patsialou A, Van Scoy M, Moran E. Distinct mammalian SWI/SNF chromatin remodeling complexes with opposing roles in cell-cycle control. EMBO J. 2007;26:752–763. doi: 10.1038/sj.emboj.7601541. [DOI] [PMC free article] [PubMed] [Google Scholar]
- 33.Chatterjee N, et al. Histone H3 tail acetylation modulates ATP-dependent remodeling through multiple mechanisms. Nucleic Acids Res. 2011;39:8378–8391. doi: 10.1093/nar/gkr535. [DOI] [PMC free article] [PubMed] [Google Scholar]
- 34.Naidu SR, Love IM, Imbalzano AN, Grossman SR, Androphy EJ. The SWI/SNF chromatin remodeling subunit BRG1 is a critical regulator of p53 necessary for proliferation of malignant cells. Oncogene. 2009;28:2492–2501. doi: 10.1038/onc.2009.121. [DOI] [PMC free article] [PubMed] [Google Scholar]
- 35.Vogel-Ciernia A, et al. The neuron-specific chromatin regulatory subunit BAF53b is necessary for synaptic plasticity and memory. Nat Neurosci. 2013;16:552–561. doi: 10.1038/nn.3359. [DOI] [PMC free article] [PubMed] [Google Scholar]
- 36.Boyd K, Woodbury-Smith M, Szatmari P. Managing anxiety and depressive symptoms in adults with autism-spectrum disorders. J Psychiatry Neurosci. 2011;36:E35–36. doi: 10.1503/jpn.110040. [DOI] [PMC free article] [PubMed] [Google Scholar]
- 37.Reid KA, Smiley E, Cooper SA. Prevalence and associations of anxiety disorders in adults with intellectual disabilities. J Intellect Disabil Res. 2011;55:172–181. doi: 10.1111/j.1365-2788.2010.01360.x. [DOI] [PubMed] [Google Scholar]
- 38.Celen C, et al. Arid1b haploinsufficient mice reveal neuropsychiatric phenotypes and reversible causes of growth impairment. eLife. 2017;6 doi: 10.7554/eLife.25730. [DOI] [PMC free article] [PubMed] [Google Scholar]
- 39.Dahlin MG, Amark PE, Nergardh AR. Reduction of seizures with low-dose clonazepam in children with epilepsy. Pediatr Neurol. 2003;28:48–52. doi: 10.1016/s0887-8994(02)00468-x. [DOI] [PubMed] [Google Scholar]
- 40.Jung EM, Ka M, Kim WY. Loss of GSK-3 Causes Abnormal Astrogenesis and Behavior in Mice. Molecular neurobiology. 2016 doi: 10.1007/s12035-015-9326-8. [DOI] [PMC free article] [PubMed] [Google Scholar]
- 41.Ka M, Kim WY. Microtubule-Actin Crosslinking Factor 1 Is Required for Dendritic Arborization and Axon Outgrowth in the Developing Brain. Molecular neurobiology. 2016;53:6018–6032. doi: 10.1007/s12035-015-9508-4. [DOI] [PMC free article] [PubMed] [Google Scholar]
- 42.Ka M, Kook YH, Liao K, Buch S, Kim WY. Transactivation of TrkB by Sigma-1 receptor mediates cocaine-induced changes in dendritic spine density and morphology in hippocampal and cortical neurons. Cell death & disease. 2016;7:e2414. doi: 10.1038/cddis.2016.319. [DOI] [PMC free article] [PubMed] [Google Scholar]
- 43.Ka M, Smith AL, Kim WY. MTOR controls genesis and autophagy of GABAergic interneurons during brain development. Autophagy. 2017;13:1348–1363. doi: 10.1080/15548627.2017.1327927. [DOI] [PMC free article] [PubMed] [Google Scholar]
- 44.Ka M, Condorelli G, Woodgett JR, Kim WY. mTOR regulates brain morphogenesis by mediating GSK3 signaling. Development. 2014;141:4076–4086. doi: 10.1242/dev.108282. [DOI] [PMC free article] [PubMed] [Google Scholar]
- 45.Jung EM, An BS, Choi KC, Jeung EB. Apoptosis- and endoplasmic reticulum stress-related genes were regulated by estrogen and progesterone in the uteri of calbindin-D(9k) and -D(28k) knockout mice. J Cell Biochem. 2011;113:194–203. doi: 10.1002/jcb.23344. [DOI] [PubMed] [Google Scholar]
- 46.Ka M, Jung EM, Mueller U, Kim WY. MACF1 regulates the migration of pyramidal neurons via microtubule dynamics and GSK-3 signaling. Dev Biol. 2014;395:4–18. doi: 10.1016/j.ydbio.2014.09.009. [DOI] [PMC free article] [PubMed] [Google Scholar]
- 47.Ka M, Moffat JJ, Kim WY. MACF1 Controls Migration and Positioning of Cortical GABAergic Interneurons in Mice. Cerebral cortex. 2016 doi: 10.1093/cercor/bhw319. [DOI] [PMC free article] [PubMed] [Google Scholar]
Associated Data
This section collects any data citations, data availability statements, or supplementary materials included in this article.