

Abstract
Photoimmunotherapy (PIT) is an emerging low side effect cancer therapy based on a monoclonal antibody (mAb) conjugated with a near-infrared (NIR) phthalocyanine dye IRDye 700DX. IR700 is fluorescent, can be used as an imaging agent, and also is phototoxic. It induces rapid cell death after exposure to NIR light. PIT induces highly selective cancer cell death, while leaving most of tumor blood vessels unharmed, leading to an effect called super-enhanced permeability and retention (SUPR). SUPR significantly improves the effectiveness of the anticancer drug. Currently, the therapeutic effects of PIT are monitored using the IR700 fluorescent signal based on macroscopic fluorescence reflectance imagery. This technique, however, lacks the resolution and depth information to reveal the intratumor heterogeneity of mAb-IR700 distribution. We applied a minimally invasive two-channel fluorescence fiber imaging system by combining the traditional fluorescence imaging microscope with two imaging fiber bundles (~0.85 mm). This method monitored mAb-IR700 distribution and therapeutic effects during PIT at different intratumor locations (e.g., tumor surface vs. deep tumor) in situ and in real time simultaneously. This enabled evaluation of the therapeutic effects in vivo and treatment regimens. The average IR700 fluorescence intensity recovery after PIT to the tumor surface is 91.50%, while it is 100.63% in deep tumors. To verify the results, two-photon microscopy combined with a microprism was also used to record the mAb-IR700 distribution and fluorescence intensity of green fluorescent protein (GFP) at different tumor depths during PIT. After PIT treatment, there was significantly higher IR700 fluorescence recovery in deep tumor than in the tumor surface. This phenomenon can be explained by increased vascular permeability immediately after NIR-PIT. Fluorescence intensity of GFP at the tumor surface decreased significantly more compared to that of deep tumor and in controls (no PIT).
Keywords: Two-channel fluorescence imaging fiber bundle, Photoimmunotherapy (PIT), Super-enhanced permeability and retention effect, Intra-tumor heterogeneity, Two-photon microscopy (TPM)
1.Introduction
The efficacy of cancer therapy depends on its ability to deliver drugs to tumors [1]. Targeted cancer therapies offer the promise of more effective tumor control with fewer side effects than conventional cancer therapies. Molecular therapies based on monoclonal antibodies (mAbs) are highly selective for tumors expressing specific antigens. However, patient outcomes have been only modestly improved when naked mAbs are used as monotherapies or in combination with other therapies [2-4]. Combinations of conventional photosensitizers and mAbs have been tested, but the improvement in selectivity is still limited [5-8]. Photoimmunotherapy (PIT) is an emerging low side effect cancer therapy based on a targeted monoclonal antibody-photo absorber conjugate (APC) [mAb conjugated with a near-infrared (NIR) phthalocyanine dye (IR700)] that induces rapid cellular necrosis after exposure to NIR light [9]. IR700 is not only fluorescent, and thus can be used as an imaging agent, but it also is phototoxic, serving as an imaging theranostic. When exposed to intense levels of NIR light, the conjugate becomes lethal, but only to those cells to which it is bound [9]. NIR light exposure can lead to rapid, target-selective necrotic cell death in vitro and effective tumor shrinkage on animal models in vivo [9]. PIT induced highly selective cancer cell death, while leaving most of the tumor blood vessels unharmed, leading to an effect termed super enhanced permeability and retention (SUPR), which significantly improved the effectiveness of anticancer drugs [10]. However, very little is known about how deep tumor cells and vasculature respond while perivascular cancer cells are destroyed via PIT.
Although single administration of the therapy was effective, tumor recurrences were observed in treated animals because of inhomogeneous mAb−IR700 distribution in the targeted tumor. The mAb−IR700 conjugate remains in the circulation system longer than nontargeting small molecule photosensitizers. Thus, the unbound mAb−IR700 can redistribute into the remnant target tumor after initial NIR light irradiation [11]. Fractionated administration of the mAb panitumumab−IR700 conjugate, followed by systematic, repeated NIR light irradiation to the tumor, was shown to be a highly effective tumor treatment because of the redistribution of antibody over time into the remnant tumor under the guidance of the IR700 fluorescence signal [11]. Real-time monitoring of theranostic agent distribution and its therapeutic effects, including cellular necrosis within the tumor microenvironment, will be critical for further understanding the PIT/SUPR mechanism and optimizing the effectiveness of treatment.
The current approach for monitoring APCs fluorescence, macroscopic fluorescence reflectance imaging, lacks the resolution and depth information to show mAb-IR700 distribution in situ [10]. Histological analysis reveals intratumor APC distribution is inhomogeneous. However, it is invasive and terminal. Real-time change of the microdistribution of APCs in different locations within the tumor after PIT has not been studied in vivo. Here, we investigated the microdistribution of APCs at different locations (e.g., tumor surface vs. deep tumor) during and after in situ and in vivo PIT using a minimally invasive two-channel fluorescence fiber imaging system and a high resolution two-photon microscope (TPM) with a 1 mm microprism.
2. Materials and methods
2.1. Reagents
Water soluble, silica-phthalocyanine derivative, IRDye 700DX NHS ester was obtained from LI-COR Biosciences (Lincoln, NE, USA). Panitumumab, a fully humanized IgG2 mAb directed against epidermal growth factor receptor (EGFR) was purchased from Amgen (Thousand Oaks, CA, USA). All other chemicals used were reagent grade.
2.2. Synthesis of IR700-conjugates
Conjugation of dyes with mAbs was performed according to previously used methods [9]. In brief, panitumumab (1.0 mg, 6.8 nmol) was incubated with IRDye 700DX NHS ester (66.8 μg, 34.2 nmol) in 0.1 M Na2HPO4 (pH 8.6) at room temperature for 1 h. The mixture was purified with a Sephadex G25 column (PD-10; GE Healthcare Life Sciences, Pittsburgh, PA, USA). The protein concentration was determined with the Coomassie Plus protein assay kit (Thermo Fisher Scientific, Waltham, MA, USA) by measuring the absorption at 595 nm with UV-Vis (8453 Value System; Agilent Technologies, Santa Clara, CA, USA). The concentration of IR700 was measured by absorption at 689 nm to confirm the number of fluorophore molecules per mAb. The synthesis was controlled so that an average of two IR700 molecules was bound to a single antibody. We abbreviate IR700 conjugated to panitumumab as pan-IR700. As a quality control for the conjugate, we performed sodium dodecyl sulfate-polyacrylamide gel electrophoresis (SDS-PAGE). Conjugate was separated by SDS-PAGE with a 4–20% gradient polyacrylamide gel (Life Technologies, Gaithersburg, MD, USA). A standard marker (Crystalgen Inc., Commack, NY, USA) was used as a protein molecular weight marker. After electrophoresis at 80 V for 2.5 h, the gel was imaged with a Pearl Imager (LI-COR Biosciences, Lincoln, Nebraska, USA) using a 700 nm fluorescence channel. We used diluted panitumumab as a control. The gel was stained with Colloidal Blue staining to determine the molecular weight of conjugate.
2.3. Cell culture
EGFR-expressing A431(epidermoid carcinoma cells)-green fluorescent protein (GFP) cells stably expressing GFP were established by Dr Kobayashi’s laboratory. Cells were grown in RPMI 1640 medium (Life Technologies, Gaithersburg, MD, USA) supplemented with 10% fetal bovine serum and 1% penicillin/streptomycin (Life Technologies) in tissue culture flasks in a humidified incubator at 37 °C at an atmosphere of 95% air and 5% carbon dioxide [1].
2.4. Animal and tumor models
All in vivo procedures were conducted in compliance with the Guide for the Care and Use of Laboratory Animal Resources (1996), US National Research Council, approved by the Institutional Animal Care and Use Committees (IACUCs) at the University of Maryland and NIH. Six-to-eight-week-old female homozygous athymic nude mice were purchased from Charles River (NCI-Frederick, Frederick, Maryland). Two million A431-GFP cells were subcutaneously injected in the right and left dorsum of each of the mice. Tumor volumes were based on caliper measurements and were calculated using the following formula: tumor volume = length × width2 × 0.5. Mice were monitored daily for their general health and tumor sizes. Tumors reaching approximately 100 mm3 in volume were selected for study [1, 12].
2.5. Treatment regimens
We used pan-IR700 as the imaging and toxic agent for A431-GFP tumor bearing mice. Tumor bearing mice were randomized into 2 groups of at least 5 animals per group for each imaging experiment (e.g., two-channel fluorescence needle imaging, two-photon micro-prism imaging, and two-photon tumor surface imaging experiments are treated as three imaging experiments). 24 hours after i.v. injection of 100 μg of pan-IR700 via the tail vein, 50 J/cm2 NIR light was administered at group 1 while group 2 (without NIR light) was used as a control.
2.6. Imaging
All mice were anesthetized with 2% isoflurane mixed in O2 and were then immobilized using a customized stereotaxic frame. Body temperature was maintained at 37 °C with a heating blanket. A small incision was performed to remove the skin covering the tumor to allow for imaging. After imaging, the mice were euthanized and tumors were extracted. The tumors were fixed using formalin in place. Ex vivo fluorescence imaging and histology were performed for A431-GFP tumors and control tumors.
2.6.1. Two-channel fluorescence needle system
Fig. 1A illustrates the schematic of the two-channel fluorescence imaging system. The system is equipped with a two-channel fiber bundle (FIGH-30-850N, Myriad Fiber Imaging Tech., Inc., Dudley, MA, USA). It provides two imaging fields of view (FOVs) of ~0.8 mm with 30,000 pixels each and relays the images from the tumor surface and deep tumor at the distal end of the fiber bundle back to the focal plane of the objective. The system utilizes a 637 nm laser diode as its light source, which is coupled with a single-mode fiber to shape its light beam. A diffuser is used to make the light more uniform. The light is collimated by an objective and goes through a dichroic mirror (650 nm, single-edge dichroic beamsplitter; DMLP650R; Thorlabs, Inc., Newton, NJ, USA). The light is then coupled to the two-channel fiber bundle system by an objective. A custom-built motorized 3D microstage facilitates accurate light coupling between the objective and the two-channel fiber bundle. The emitted fluorescent light is collected back through the fiber bundle, objective, dichroic mirror, a 665 nm longpass emission filter, and finally imaged on a charge coupled device (CCD) camera (PIXIS1024, Princeton Instruments, Trenton, NJ, USA). For tumor imaging, after aligning the two-channel fiber bundle to the objective, one channel of the fiber bundle probe was gently inserted into the tumor of the anesthetized mouse by slowly moving the animal stage up and using stereotaxic coordinates [13]. Special attention was paid to avoid damaging large blood vessels during this procedure, and minor bleeding was cleared by flushing with saline solution [14]. The other channel of the imaging fiber bundle was placed at the surface of the tumor.
Fig.1.
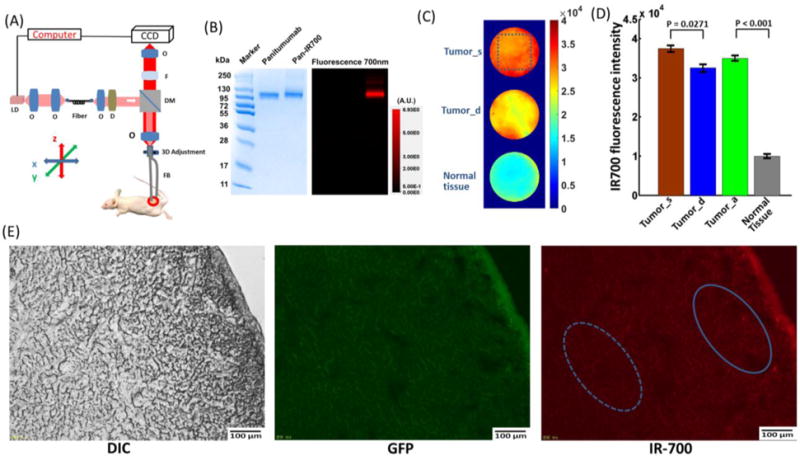
(A) Schematic of the two-channel needle system. O: objective lens; D: diffuser; F: filter; DM: dichroic mirror; FB: fiber bundle; LD: laser diode. (B) SDS-PAGE data of the pan-IR700 and non-conjugated control panitumumab. (C) Fiber bundle image of the tumor surface (Tumor_s), deep tumor (Tumor_d), and normal tissue before PIT. (D) IR700 fluorescence intensity value for the tumor surface, deep tumor, tumor average (Tumor_a), and normal tissue. The tumors’ surface had a significantly higher fluorescence intensity value than that of the deep tumor (p=0.0271, n=5). Tumors showed significantly higher fluorescence intensity values than those of normal tissue (p<0.001, n=5). (E) Fluorescence microscopy of A431-GFP tumor. DIC image (left), GFP fluorescence (middle) and IR-700 fluorescence microscopic images (right) of A431-GFP tumors. The GFP fluorescence signal is relatively homogeneous, while the IR700 fluorescence intensity is higher in the tumor surface.
The NIR LED used for the PIT treatment in the experiments has a wavelength spectrum of 680–700 nm (Tech-LED, Marubeni America Corp., Santa Clara, CA, USA) and irradiates for ~20 minutes to deliver a dose of ~50 J/cm2 light to the tumor [11, 15]. The LED spectrum overlaps the detection filter spectral range. To record the IR700 fluorescence signal change during and after PIT, the data acquisition protocol is as follows: one image was taken before turning on the LED, then, in the first 20 minutes, each image was taken after every 2 minutes of tumor LED exposure. After 20 minutes of LED exposure, the PIT treatment was completed and, in the next 70 minutes, one image was taken every 2 minutes to record the tumor’s post-treatment changes. The control group received no LED exposure, but during 90 minutes (the same time that the exposed group was treated and observed) one image was taken every 2 minutes. The driver current was set at 100 mA for the laser diode and the exposure time was set at 1 s for the CCD camera during data acquisition.
2.6.2. The TPM system with a microprism
TPM, which allows the simultaneous absorption by each fluorophore molecule of two photons in a single quantum event, offers many advantages over conventional imaging techniques. It has become a powerful tool for studying biological function in living tissues [16-20]. Microprisms have been used with the TPM for in vivo multilayer cortical imaging in mice [21]. The lab-customized two-photon system utilized a Ti:sapphire laser (Mira 900-F, Coherent Inc., Santa Clara, CA, USA) operating at 790 nm wavelength and 120 fs pulse width. A 20× water immersion objective (Olympus Corporation of the Americas, Center Valley, PA, USA) was employed for focusing the excitation beam into tissue samples and to collect the two-photon excited fluorescence signals. A dichroic mirror (760 nm, single edge dichroic beamsplitter; T760LPXXR-UF3; Chroma Technology Corp, Bellows Falls, VT, USA) was applied to separate the excitation laser and fluorescence signals. The fluorescence signals were further separated into two channels by another 550 nm dichroic beamsplitter, followed by an emission filter (525±39 nm and 716±42 nm for the GFP signal in the green channel and the IR700 signal in the red channel, respectively) and a photomultiplier tube (PMT) (H7422P-40 for the green channel and H7422P-50 for the red channel, Hamamatsu Corporation, Bridgewater, NJ, USA).
For in vivo imaging of the tumor surface, the skin covering the tumor was removed and the tumor was exposed under the TPM objective lens. For in vivo imaging of deep tumor, a 1×1 mm2 right-angled microprism (OptoSigma Corporation, Santa Ana, CA, USA) coated with anti-reflection coatings to minimize surface reflections was fully inserted into the mouse tumor. The prism surface was then cleaned with a hemostatic sponge and flushed with saline solution. A customized glass chamber window was placed on the prism to reduce artifacts from the animals’ heartbeats and respirations, and to hold the water used to immerse the 20× objective lens (Fig. 4A). The FOV per frame is ~1×1 mm2, which projected the images across different depths of the tumor’s regions, from the tumor surface to deep tumor. We defined the area within 500 μm depth from the tumor surface as “tumor surface” (tumor_s) and the area beyond 500 μm depth from the tumor surface as “deep tumor” (tumor_d). The 20× objective lens was finely tuned to focus at the plane based on GFP-expressing tumor cells adjacent to the vertical surface of the prism. The data acquisition protocol is the same as described in Section 2.6.1., except that GFP signal was also recorded.
Fig. 4.
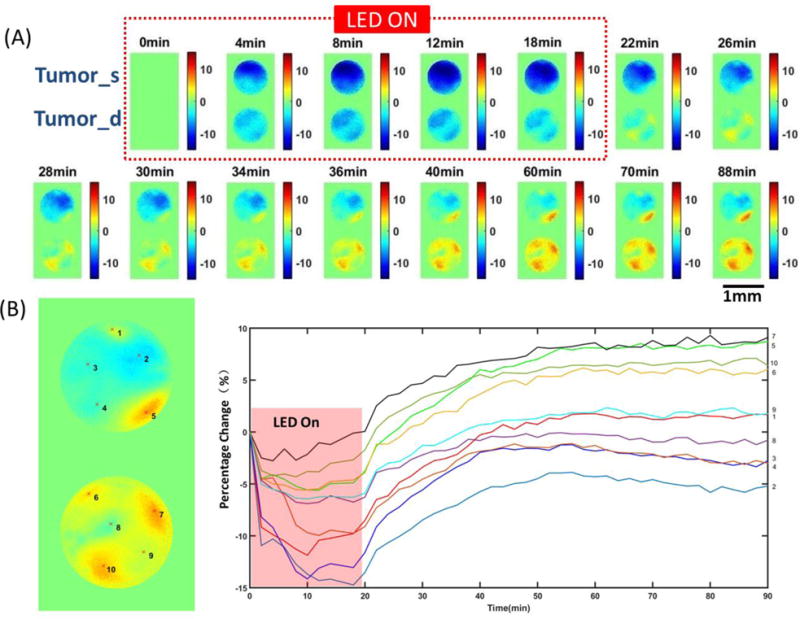
(A) Microprism placement in tumor for TPM imaging. (B) Tumor surface and deep tumor during and after PIT treatment imaged by TPM system.(C) Changes in fluorescence [ΔF/F (%), ordinate] of the tumor surface and deep tumor during and after PIT treatment. The fluorescence signal was calculated from the positions (centered by the white marks in the left images with 10 × 10 pixels size) numbered accordingly.
2.6.3. Ex vivo fluorescence microscopy
To detect antigen-specific microdistribution in the tumor, fluorescence microscopy was performed. Tumor xenografts were excised from mice 24 h after injection of APC. Extracted tumors were frozen with optimal cutting temperature (OCT) compound (Sakura Finetek Japan Co., Ltd, Tokyo, Japan) and frozen sections (10 μm thick) were prepared. Fluorescence microscopy was performed using an Olympus BX61 (Olympus Corporation) with the following filters: excitation wavelength 460–490 nm and 590–650 nm, emission wavelength 510–550 nm and 665–740 nm for GFP and IR700 signal, respectively. Transmitted light differential interference contrast (DIC) images were also acquired.
2.6.4. Histopathologic evaluation
Tumor xenografts were excised from mice after experiments. Light microscopy with an Olympus BX61 (Olympus Corporation) was used to evaluate histological changes. Extracted tumors were placed in 10% formalin and serial 10 μm slice sections were fixed on glass slides with hematoxylin and eosin (H&E) staining.
2.7. Statistical analysis
No missing data are observed in this study. Descriptive statistics, such as mean and standard deviation, were calculated. A Student’s t-test was used and statistical analyses were carried out using MATLAB (The MathWorks Inc., Natick, MA, USA). Statistical significance is considered at P = 0.05.
3. Results
3.1. Characterization of antibody conjugated dye
As defined by SDS-PAGE, pan-IR700 and non-conjugated control panitumumab showed an identical molecular weight, and fluorescence intensity was confirmed in the band of pan-IR700 (Fig. 1B).
3.2. Calibration of the two-channel fluorescence needle system
The two-channel fluorescence needle system was initially used to image the 5 ug/mL IR700 PBS solution, which would be expected to have a homogeneous fluorescence distribution. The IR700 PBS solution’s intensity profile can serve as a weight matrix to compensate for inhomogeneity from the fiber bundle and the imaging system (Supplementary Fig. 1A). After compensation with the weight matrix, obtained above, fluorescence signals were plotted as a function of IR700 PBS concentration, and showed a good linear response with R2=0.9393 (Supplementary Fig. 1B). Fluorescence signals from the CCD were further plotted as a function of different IR700 concentrations in mouse blood, showing an excellent linear response with R2=0.9959 (Supplementary Fig. 1C and D). Before PIT, the two-channel fluorescence needle system was also used to measure the fluorescence intensity from the tumor surface, deep tumor, and normal tissues in the anesthetized mice (Fig. 1C). The tumors’ surface showed a significantly higher IR700 fluorescence intensity value than that of the deep tumor (Fig. 1D). Tumors (average of tumor surface and deep tumor) showed a significantly higher IR700 fluorescence intensity value than that of normal tissue (Fig. 1D). Fig. 1E illustrates ex vivo GFP and IR700 fluorescence intensity. Ex vivo fluorescence microscopy confirmed a relatively homogeneous GFP fluorescence signal across the tumor surface and deep tumor, while IR700 fluorescence intensity is higher in the tumor surface (Fig. 1E).
3.3. In vivo fluorescence imaging using the two-channel fluorescence needle system
At 0 min, NIR irradiation was turned on and the IR700 fluorescence intensity dropped quickly both at the tumor surface and in deep tumor regions, with larger decreases at the tumor surface. After 20 min, the NIR light was turned off and the IR700 fluorescence intensity recovered quickly to initial (0 min) levels. Some regions even increased to values higher than the initial levels, especially in the deep tumor (Fig. 2A). Different small regions (5 × 5 pixels) from both tumor surface and deep tumor were selected to show the changes in fluorescence during and after PIT, which can indicate the heterogeneity of the recovery in IR700 fluorescence intensity (Fig. 2B). Control experiments were performed on mice that did not receive NIR light exposure. There was only a small IR700 fluorescence intensity decrease throughout the measurement period, which may result from dye photobleaching without any fluorescence recovery (Supplementary Fig. 2A).
Fig.2.
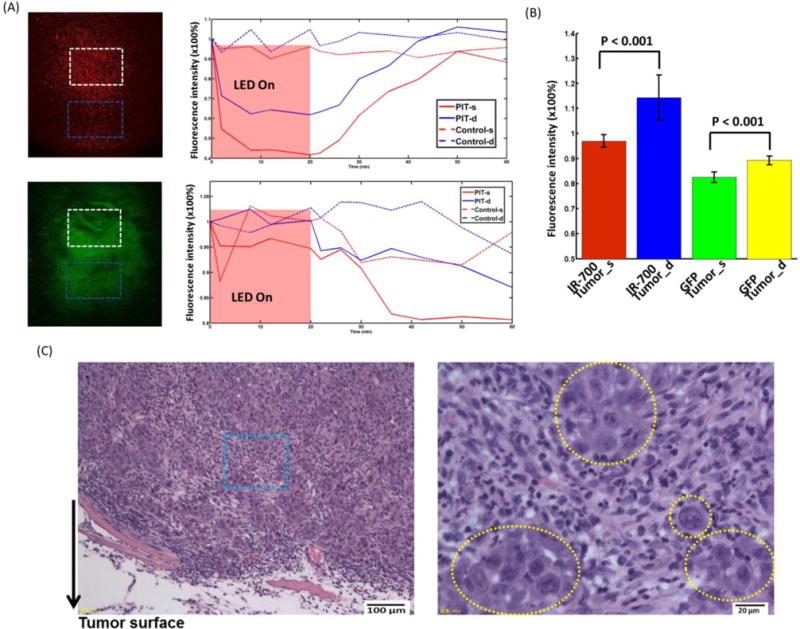
(A) Changes in fluorescence [ΔF/F (%), ordinate] of the tumor surface and deep tumor during and after PIT treatment imaged by the two-channel needle system. (B) Changes in fluorescence (ΔF/F (%), ordinate) of tumor surface and deep tumor during and after PIT treatment. The fluorescence signal was calculated from the positions (centered by the red marks in the left images with 5 × 5 pixels size) numbered accordingly.
The IR700 fluorescence intensity was further averaged and normalized to the initial level (0 min) in the entire region of interest (ROI) from the tumor surface and deep tumor. The normalized IR700 fluorescence intensity clearly showed a greater drop in the tumor surface and a higher recovery in deep tumor, while there was only a gradual decrease in controls (Fig. 3A). Recovery of IR700 fluorescence intensity in the deep tumors was significantly higher than that of the tumor surface and higher than the initial values for deep tumors (Fig. 3B). We also plotted histograms of the recovery values of tumor surface and deep tumor after PIT at 90 min. Deep tumors showed a multimodal shape and significantly greater standard deviations (SD) of the means (Fig. 3C and D).
Fig. 3.
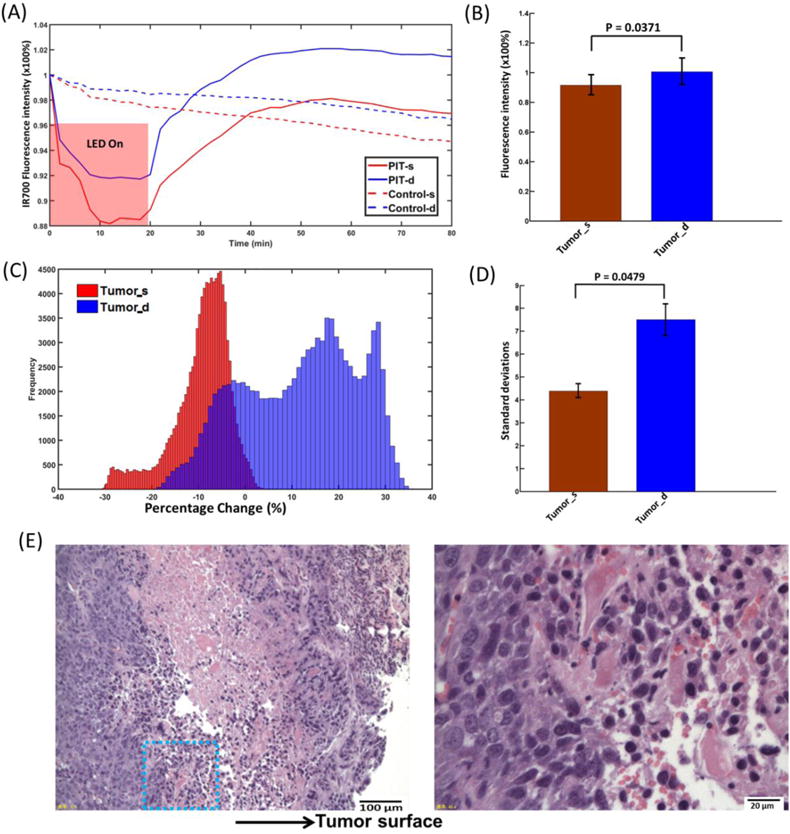
(A) Representative normalized average fluorescence intensity of tumor surface and deep tumor during and after PIT treatment compared with control. (B) IR700 fluorescence recovery value of the tumor surface and deep tumor. Deep tumors showed a significantly higher fluorescence recovery intensity value than that of the tumor surface (p=0.0371, n=10). (C) Histograms of the recovery value of the tumor surface and deep tumor. (D) Standard deviations (SDs) of the recovery value of tumor surface and deep tumor. Deep tumor shows a significant larger SD than that of tumor surface (p=0.0479, n=6). (E) Histological specimens of A431 tumors from the PIT-treated group. There is more cell necrosis in the tumor surface compared to the deep tumor. The image on the right side is the zoomed-in image from the blue square in the left image.
With H&E staining, the imaging fiber bundle track from the two-channel system showed an ~1.6 mm deep insertion into the deep tumor (Supplementary Fig. 2A). There is more cell necrosis in the tumor surface compared to the deep tumor (Fig. 3E). In the control tumor, there is no obvious cell necrosis observed in either the tumor surface or the deep tumor (Supplementary Fig. 2A).
3.4. In vivo fluorescence imaging using the TPM with microprism
To verify the results obtained from the two-channel fluorescence needle system, a microprism was gently placed inside the tumor to record the images across different depths of tumor regions from the tumor surface to the deep tumor (Fig. 4A). In the first 20 min with NIR irradiation, IR700 fluorescence intensity showed a significant drop in both tumor surface and deep tumor. Similar to the phenomenon observed before, after the NIR light was turned off, the IR700 fluorescence intensity began to recover (Fig. 4B). GFP fluorescence intensity only decreased with no recovery observed. Changes in IR700 fluorescence from randomly selected areas showed a greater drop in the tumor surface compared to deep tumor and higher recovery in deep tumor (Fig. 4C). There were no significant changes in IR700 fluorescence and GFP fluorescence in the control mice (Supplementary Fig. 3A).
In Fig. 5A, the normalized IR700 fluorescence intensity averaged from the white and blue squares showed a greater drop in the tumor surface and greater recovery in deep tumor, while there is no obvious change in controls. The recovery of IR700 fluorescence intensity in deep tumor is significantly higher than that of the tumor surface and more than 10% higher than the initial value of deep tumor (Fig. 5B). The normalized GFP fluorescence intensity showed a larger drop in the tumor region (both tumor surface and deep tumor) treated with PIT compared to the decrease in controls (lower image and chart in Fig. 5A). The decrease of GFP fluorescence intensity in the tumor surface is significantly greater than that of the deep tumor (Fig. 5B).
Fig. 5.
(A) Representative normalized average IR700 fluorescence intensity (upper) and GFP intensity (lower) of tumor surface and deep tumor during and after PIT treatment compared with control mouse. (B) Left: IR700 fluorescence recovery value of tumor surface and deep tumor. Deep tumor showed significantly higher fluorescence recovery intensity value than that of the tumor surface (n=5). Right: GFP intensity of tumor surface and deep tumor. The tumor surface showed a significantly larger GFP fluorescence decrease than that of the deep tumor (n=5). (C) Histological specimens of A431 tumors from the PIT-treated group. The image on the right side is the zoomed-in image from the blue square in the left image. The yellow dashed circles indicate undamaged cells. Overall, there was less damage compared to the two-channel fiber bundle results.
In H&E stained sections, more necrotic cells were seen in the tumor surface than in the deep tumor (Fig. 5C) and there are cells remaining undamaged (yellow dashed area in Fig. 5C). There is overall less damage compared to the two-channel fiber bundle results. In the control tumor, no obvious cell necrosis was observed in either tumor surface or the deep tumor. The micro-prism track can be clearly seen ~1.4–1.7 mm below the surface (Supplementary Fig. 3B).
3.5. In vivo fluorescence imaging of the tumor surface using TPM
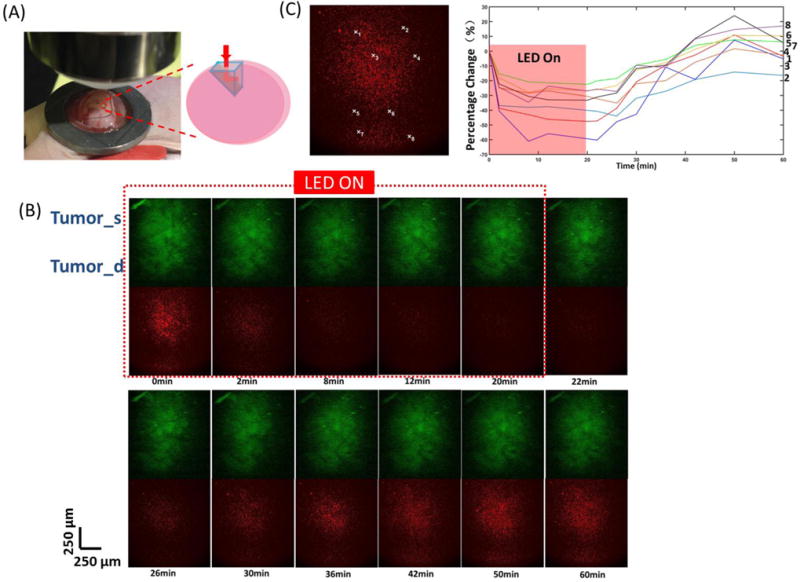
After removing the skin covering the tumor, the nearly intact tumor was placed under the two-photon objective lens for imaging. The ROIs were chosen based on both GFP and IR700 fluorescence signals. Blood vessels and capillaries were included. Before NIR LED irradiation, most of the IR700 clusters were well separated and surrounded the blood vessels (Fig. 6A). Within minutes of turning on the LED, the IR700 fluorescence showed an obvious decrease, with the blood vessels indistinct at 12 min (Fig. 6A). The GFP images also became darker, although the blood vessels can still be clearly distinguished (Fig. 6A). After 20 min of NIR irradiation, the IR700 fluorescence showed quick recovery surrounding the blood vessels with much higher fluorescence intensity and density (Fig. 6A). There were no significant changes in IR700 and GFP fluorescence in the control mice (Supplementary Fig. 4A).
Fig. 6.
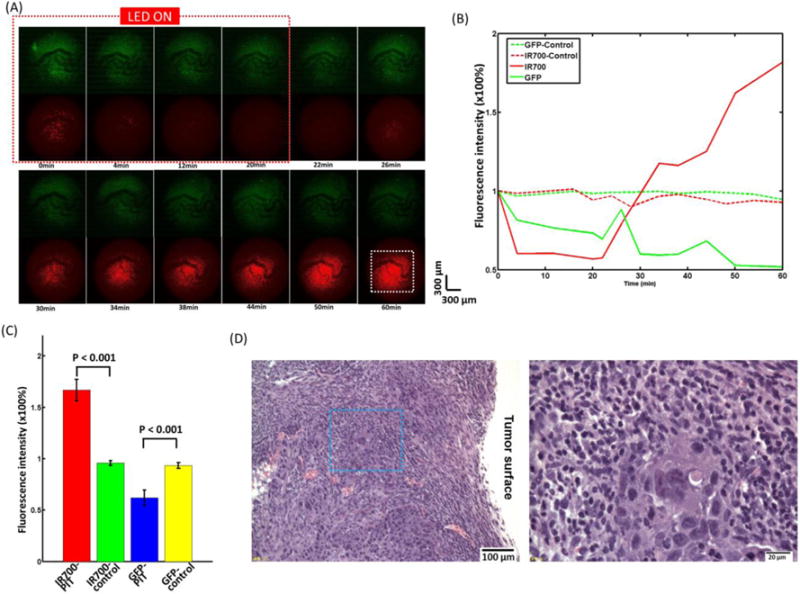
(A) The tumor surface during and after PIT treatment imaged by the TPM system. (B) The average normalized tumor surface IR700 and GFP fluorescence intensity during and after PIT treatment compared with control mice without PIT treatment. The fluorescence signal was calculated from the dashed white square in Fig. 6(A) at 60 min. (C) IR700 fluorescence recovery value of PIT-treated tumors and control tumors without PIT. Tumors with PIT showed a significantly higher IR700 fluorescence intensity value and a lower GFP fluorescence intensity value than in the control tumor (n=5). (D) Histological specimens of A431 tumors from the PIT-treated group. The image on the right side is the zoomed-in image from the blue square in the left image. There is overall less cell damage compared to the two-channel fiber bundle results.
The normalized IR700 fluorescence intensity averaged from the white square in Fig. 6A showed a large drop (~40%) in the tumor surface and high recovery (~160%) after PIT, while there was no clear trend in the controls (Fig. 6B). The recovery of IR700 fluorescence intensity in the tumor surface was significantly higher than that of control tumors and ~1.6-fold greater than initial values (Fig. 6C). The decrease of GFP fluorescence intensity in the tumor surface was significantly greater than that of the control tumors (Fig. 6C) and also greater than that of the tumor surface viewed using microprism (Fig. 5B).
In sections stained with H&E, there are more necrotic cells seen in the tumor surface than in the deep tumor (Fig. 6D) and there is also overall less cell damage compared to the two-channel fiber bundle results. In the control tumor, no obvious cell necrosis was observed in either tumor surface or the deep tumor (Supplementary Fig. 4B).
4. Discussion
One major goal of intravenous cancer therapies is delivery of the therapeutic material in sufficient concentration to all parts of the tumor [1]. Targeted cancer therapies offer the promise of more-effective tumor control with fewer side effects than conventional cancer therapies. PIT is a cell-specific cancer therapy with minimal side effects, which is based on an armed antibody conjugate that induces rapid cellular necrosis after exposure to NIR light [12]. From the pharmacokinetic point of view, antibody conjugation with photosensitizer, IR700, minimally alters the pharmacokinetics of the antibody due to the small size and hydrophilic nature of the IR700 dye. As a result, these APCs show highly targeted accumulation in the tumor and specific binding to target cells with minimal distribution in normal tissue and minimal binding to non-target expressing cells [9, 22-25]. PIT has been reported to induce highly selective cancer cell death, while leaving most of the tumor blood vessels, the means of delivery of the drug to the tumor, unharmed, leading to an effect termed super enhanced permeability and retention (SUPR), which significantly improves the efficacy of the anticancer drug [10]. Although targeted cell death can be examined in vitro, it is challenging to observe immediate changes in vivo since changes in tumor size take 3–4 days to become visible [15, 26]. Real-time monitoring of PIT effects could be important, as it can ascertain whether a PIT session has been effective or whether additional cycles of therapy are needed [9, 15]. Optical coherence tomography has been used to monitor hemodynamic changes in tumor vessels during PIT in real time [12], and fluorescence lifetime imaging has been used to monitor in vivo acute necrotic cancer cell death after NIR PIT [15]. In this paper, we directly investigated the microdistribution of APCs at different locations (e.g., tumor surface vs. deep tumor) during and after PIT in situ and in vivo using a minimally invasive two-channel fluorescence fiber imaging system and high resolution TPM with a microprism.
This study employed GFP fluorescence as a surrogate for cell death and IR700 fluorescence as a surrogate for APCs accumulation. In all experiments using the two-channel fluorescence needle system or TPM (with or without a microprism), there is a greater decrease in IR700 fluorescence in the tumor surface than in the deep tumor. This is likely due to both the limited penetration of the initial APCs injection and the decreased penetration of NIR as tumor depth increases. Thus, only limited damage to deeper parts of the tumor was observed in comparison to the damage seen in the tumor surface. GFP fluorescence decreased more in the tumor surface than it did in the deep tumor, as was observed in the TPM experiment. This indicates that there is less cell necrosis in the deeper parts of the tumor. The histological results after PIT confirm that there are more necrotic cells in the tumor surface induced by PIT. An interesting observation is that after 20 min of PIT treatment, the IR700 fluorescence recovers very quickly and the relative recovery in the deep tumor regions is greater than that of the tumor surface, and even reaches beyond the initial value in the deep tumor. As reported previously, compared to non-targeting small molecule photosensitizers, mAb−IR700 conjugate stays in the blood circulation longer, which allows unbound mAb−IR700 to redistribute into the remnant target tumor after NIR light irradiation [11]. The increased IR700 fluorescence in the deep tumor in our experiment can be explained by improved intratumoral distribution of circulating APCs due to enhanced permeability and retention [10]. While we also noticed that the initial IR700 fluorescence in the deep tumor was lower than that of the tumor surface due to limited APCs penetration, fewer APCs were needed to recover or exceed the initial fluorescence value for the deep tumor. Lower recovery in the tumor surface probably also result from cell death in the tumor surface regions. In the control groups, IR700 fluorescence also decreased 5% due to photobleaching from the laser diode or two-photon laser during the long data acquisition period, which can serve as the real reference for fluorescence recovery. The limited quantity of mAb−IR700 conjugate in the circulatory system and limited time of monitoring post-PIT may all contribute the APCs recovery results. However, the increase of APCs in deep tumors provides some clues about the SUPR effect. We suspect that the IR700 fluorescence recovery heterogeneity can reveal the structural heterogeneity of different regions of the tumor, but this will require further study. Histograms of the recovery value of the tumor surface and deep tumor after PIT were plotted, and the deep tumor showed a multimodal shape and a significantly larger separation (SD) [27], which may indicate the deep tumor has a more heterogeneous structure than the surface tumor.
Although the fiber bundle and microprism are minimally invasive to tissue [14, 21, 28], there is still the possibility that their insertion could damage the blood vessels and affect circulation in the tumor. We further investigated the intact tumor under the two-photon objective lens. The recovery of IR700 fluorescence intensity in the tumor surface is significantly higher than that of control tumors and ~1.6-fold higher than its initial values. The decrease of GFP fluorescence intensity in the tumor surface is also significantly greater than that of the control tumors and of the tumor surface viewed with a with microprism. The 1.6-fold recovery may be clear evidence that after NIR irradiation, SUPR enables a significant increase in the quantity of APCs within the tumor. We can expect higher recovery using a fiber bundle and microprism if no damage has been introduced. Although we tried to administer 50 J/cm2 NIR light to the tumor for each experiment, because of space limitations, the LED could not be arranged close enough to the tumor, especially for the TPM, which uses a bulky objective with a short working distance (2 mm). This blocked much of the NIR light, which can explain why there is overall less cell damage in the TPM experiments compared to the two-channel fiber bundle results, as seen in H&E stained samples. In future, with cell-cycle responsible fluorescent protein labelled tumor cells [29-31], it may be possible to simultaneously monitor cell death and APCs microdistribution in real time in living mice.
5. Conclusions
We investigated the microdistribution of APCs at different locations (e.g., tumor surface vs. deep tumor) during and after PIT in situ and in vivo using a minimally invasive two-channel fluorescence fiber imaging system and a high resolution TPM with and without a microprism. The distribution of APCs was improved after PIT treatment with greater increase and greater heterogeneous recovery in the deep tumor regions. These novel imaging methods are critical for further understanding of the PIT/SUPR mechanism and optimizing the effectiveness of treatment by monitoring theranostic agent distribution and its therapeutic effects, including cellular necrosis, within the tumor microenvironment in vivo and in real time.
Supplementary Material
Acknowledgments
This research was supported by NIH grant R03 CA176027 and the UMD-NCI Partnership for Integrative Cancer Research. We thank Hannah Horng from the University of Maryland for data analysis and discussion.
Footnotes
Disclosure of Potential Conflicts of Interest: No potential conflicts of interest were disclosed.
References
- 1.Nagaya T, Nakamura Y, Sato K, Harada T, Choyke PL, Kobayashi H. Improved micro-distribution of antibody-photon absorber conjugates after initial near infrared photoimmunotherapy (NIR-PIT) Journal of Controlled Release. 2016;232:1–8. doi: 10.1016/j.jconrel.2016.04.003. [DOI] [PMC free article] [PubMed] [Google Scholar]
- 2.Weiner LM, Surana R, Wang SZ. Monoclonal antibodies: versatile platforms for cancer immunotherapy. Nat Rev Immunol. 2010;10:317–327. doi: 10.1038/nri2744. [DOI] [PMC free article] [PubMed] [Google Scholar]
- 3.Parish CR. Cancer immunotherapy: The past, the present and the future. Immunol Cell Biol. 2003;81:106–113. doi: 10.1046/j.0818-9641.2003.01151.x. [DOI] [PubMed] [Google Scholar]
- 4.Reichert JM, Rosensweig CJ, Faden LB, Dewitz MC. Monoclonal antibody successes in the clinic. Nature biotechnology. 2005;23:1073–1078. doi: 10.1038/nbt0905-1073. [DOI] [PubMed] [Google Scholar]
- 5.Mew D, Wat CK, Towers GH, Levy JG. Photoimmunotherapy: treatment of animal tumors with tumor-specific monoclonal antibody-hematoporphyrin conjugates. Journal of immunology. 1983;130:1473–1477. [PubMed] [Google Scholar]
- 6.Rosenkranz AA, Jans DA, Sobolev AS. Targeted intracellular delivery of photosensitizers to enhance photodynamic efficiency. Immunol Cell Biol. 2000;78:452–464. doi: 10.1046/j.1440-1711.2000.00925.x. [DOI] [PubMed] [Google Scholar]
- 7.Carcenac M, Dorvillius M, Garambois V, Glaussel F, Larroque C, Langlois R, Hynes NE, van Lier JE, Pelegrin A. Internalisation enhances photo-induced cytotoxicity of monoclonal antibody-phthalocyanine conjugates. Brit J Cancer. 2001;85:1787–1793. doi: 10.1054/bjoc.2001.2170. [DOI] [PMC free article] [PubMed] [Google Scholar]
- 8.Vrouenraets MB, Visser GWM, Stewart FA, Stigter M, Oppelaar H, Postmus PE, Snow GB, van Dongen GAMS. Development of meta-tetrahydroxyphenylchlorin-monoclonal antibody conjugates for photoimmunotherapy. Cancer Res. 1999;59:1505–1513. [PubMed] [Google Scholar]
- 9.Mitsunaga M, Ogawa M, Kosaka N, Rosenblum LT, Choyke PL, Kobayashi H. Cancer cell-selective in vivo near infrared photoimmunotherapy targeting specific membrane molecules. Nat Med. 2011;17:1685–1691. doi: 10.1038/nm.2554. [DOI] [PMC free article] [PubMed] [Google Scholar]
- 10.Sano K, Nakajima T, Choyke PL, Kobayashi H. Markedly enhanced permeability and retention effects induced by photo-immunotherapy of tumors. ACS nano. 2013;7:717–724. doi: 10.1021/nn305011p. [DOI] [PMC free article] [PubMed] [Google Scholar]
- 11.Mitsunaga M, Nakajima T, Sano K, Choyke PL, Kobayashi H. Near-infrared Theranostic Photoimmunotherapy (PIT): Repeated Exposure of Light Enhances the Effect of Immunoconjugate. Bioconjugate Chem. 2012;23:604–609. doi: 10.1021/bc200648m. [DOI] [PMC free article] [PubMed] [Google Scholar]
- 12.Liang C-P, Nakajima T, Watanabe R, Sato K, Choyke PL, Chen Y, Kobayashi H. Real-time monitoring of hemodynamic changes in tumor vessels during photoimmunotherapy using optical coherence tomography. Journal of biomedical optics. 2014;19:098004–098004. doi: 10.1117/1.JBO.19.9.098004. [DOI] [PMC free article] [PubMed] [Google Scholar]
- 13.Tang Q, Tsytsarev V, Liang CP, Akkentli F, Erzurumlu RS, Chen Y. In Vivo Voltage-Sensitive Dye Imaging of Subcortical Brain Function. Scientific reports. 2015;5:17325. doi: 10.1038/srep17325. [DOI] [PMC free article] [PubMed] [Google Scholar]
- 14.Luo Z, Volkow ND, Heintz N, Pan Y, Du C. Acute cocaine induces fast activation of D1 receptor and progressive deactivation of D2 receptor striatal neurons: in vivo optical microprobe [Ca2+]i imaging. The Journal of neuroscience : the official journal of the Society for Neuroscience. 2011;31:13180–13190. doi: 10.1523/JNEUROSCI.2369-11.2011. [DOI] [PMC free article] [PubMed] [Google Scholar]
- 15.Nakajima T, Sano K, Mitsunaga M, Choyke PL, Kobayashi H. Real-time monitoring of in vivo acute necrotic cancer cell death induced by near infrared photoimmunotherapy using fluorescence lifetime imaging. Cancer Res. 2012;72:4622–4628. doi: 10.1158/0008-5472.CAN-12-1298. [DOI] [PMC free article] [PubMed] [Google Scholar]
- 16.Denk W, Strickler JH, Webb WW. Two-photon laser scanning fluorescence microscopy. Science. 1990;248:73–76. doi: 10.1126/science.2321027. [DOI] [PubMed] [Google Scholar]
- 17.Zhou YP, Bifano T, Lin C. Adaptive optics two photon scanning laser fluorescence microscopy. Mems Adaptive Optics V. 2011;7931 [Google Scholar]
- 18.Helmchen F, Denk W. Deep tissue two-photon microscopy. Nature methods. 2005;2:932–940. doi: 10.1038/nmeth818. [DOI] [PubMed] [Google Scholar]
- 19.Horton NG, Wang K, Kobat D, Clark CG, Wise FW, Schaffer CB, Xu C. In vivo three-photon microscopy of subcortical structures within an intact mouse brain. Nat Photonics. 2013;7:205–209. doi: 10.1038/nphoton.2012.336. [DOI] [PMC free article] [PubMed] [Google Scholar]
- 20.Kobat D, Horton NG, Xu C. In vivo two-photon microscopy to 1.6-mm depth in mouse cortex. Journal of biomedical optics. 2011;16:106014. doi: 10.1117/1.3646209. [DOI] [PubMed] [Google Scholar]
- 21.Chia TH, Levene MJ. Microprisms for In Vivo Multilayer Cortical Imaging. Journal of neurophysiology. 2009;102:1310–1314. doi: 10.1152/jn.91208.2008. [DOI] [PubMed] [Google Scholar]
- 22.Hanaoka H, Nakajima T, Sato K, Watanabe R, Phung Y, Gao W, Harada T, Kim I, Paik CH, Choyke PL. Photoimmunotherapy of hepatocellular carcinoma-targeting Glypican-3 combined with nanosized albumin-bound paclitaxel. Nanomedicine : nanotechnology, biology, and medicine. 2015;10:1139–1147. doi: 10.2217/nnm.14.194. [DOI] [PMC free article] [PubMed] [Google Scholar]
- 23.Nagaya T, Nakamura Y, Sato K, Harada T, Choyke PL, Hodge JW, Schlom J, Kobayashi H. Near infrared photoimmunotherapy with avelumab, an anti-programmed death-ligand 1 (PD-L1) antibody. Oncotarget. 2017;8:8807. doi: 10.18632/oncotarget.12410. [DOI] [PMC free article] [PubMed] [Google Scholar]
- 24.Nagaya T, Sato K, Harada T, Nakamura Y, Choyke PL, Kobayashi H. Near infrared photoimmunotherapy targeting EGFR positive triple negative breast cancer: optimizing the conjugate-light regimen. PloS one. 2015;10:e0136829. doi: 10.1371/journal.pone.0136829. [DOI] [PMC free article] [PubMed] [Google Scholar]
- 25.Nagaya T, Nakamura Y, Sato K, Harada T, Choyke PL, Kobayashi H. Near infrared photoimmunotherapy of B-cell lymphoma. Molecular Oncology. 2016;10:1404–1414. doi: 10.1016/j.molonc.2016.07.010. [DOI] [PMC free article] [PubMed] [Google Scholar]
- 26.Mitsunaga M, Nakajima T, Sano K, Kramer-Marek G, Choyke PL, Kobayashi H. Immediate in vivo target-specific cancer cell death after near infrared photoimmunotherapy. BMC cancer. 2012;12:1. doi: 10.1186/1471-2407-12-345. [DOI] [PMC free article] [PubMed] [Google Scholar]
- 27.Xu HN, Li LZ. Quantitative redox imaging biomarkers for studying tissue metabolic state and its heterogeneity. J Innov Opt Heal Sci. 2014;7:1430002. doi: 10.1142/S179354581430002X. [DOI] [PMC free article] [PubMed] [Google Scholar]
- 28.Paukert M, Agarwal A, Cha J, Doze VA, Kang JU, Bergles DE. Norepinephrine controls astroglial responsiveness to local circuit activity. Neuron. 2014;82:1263–1270. doi: 10.1016/j.neuron.2014.04.038. [DOI] [PMC free article] [PubMed] [Google Scholar]
- 29.Yano S, Li S, Han Q, Tan Y, Bouvet M, Fujiwara T, Hoffman RM. Selective methioninase-induced trap of cancer cells in S/G2 phase visualized by FUCCI imaging confers chemosensitivity. Oncotarget. 2014;5:8729. doi: 10.18632/oncotarget.2369. [DOI] [PMC free article] [PubMed] [Google Scholar]
- 30.Yano S, Miwa S, Mii S, Hiroshima Y, Uehara F, Kishimoto H, Tazawa H, Zhao M, Bouvet M, Fujiwara T. Cancer cells mimic in vivo spatial-temporal cell-cycle phase distribution and chemosensitivity in 3-dimensional Gelfoam histoculture but not 2-dimensional culture as visualized with real-time FUCCI imaging. Cell Cycle. 2015;14:808–819. doi: 10.1080/15384101.2014.1000685. [DOI] [PMC free article] [PubMed] [Google Scholar]
- 31.Yano S, Zhang Y, Zhao M, Hiroshima Y, Miwa S, Uehara F, Kishimoto H, Tazawa H, Bouvet M, Fujiwara T. Tumor-targeting Salmonella typhimurium A1-R decoys quiescent cancer cells to cycle as visualized by FUCCI imaging and become sensitive to chemotherapy. Cell Cycle. 2014;13:3958–3963. doi: 10.4161/15384101.2014.964115. [DOI] [PMC free article] [PubMed] [Google Scholar]
Associated Data
This section collects any data citations, data availability statements, or supplementary materials included in this article.