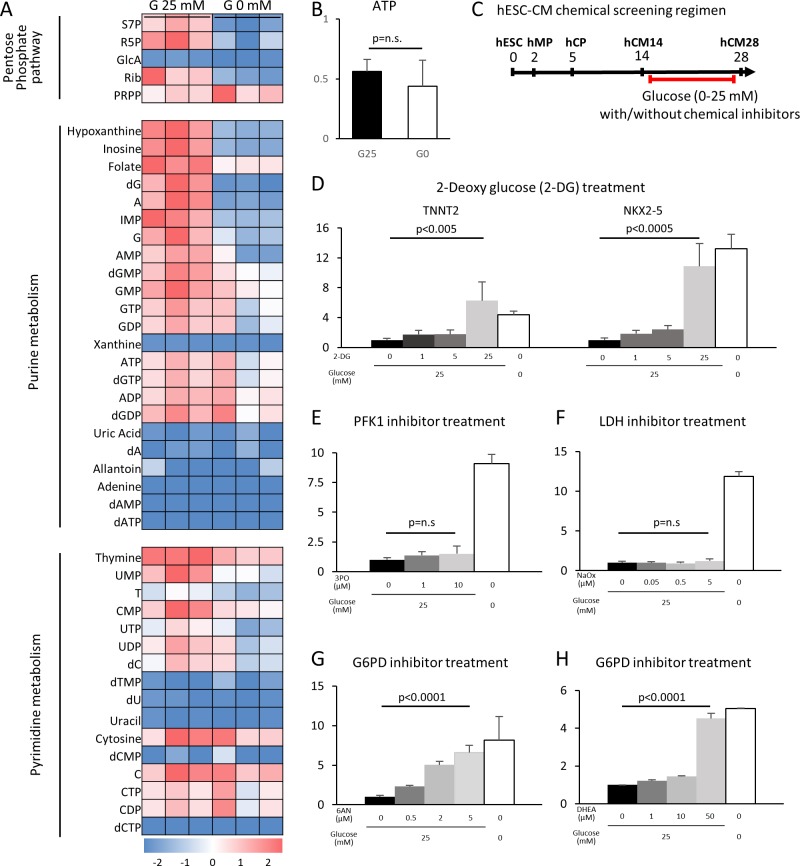
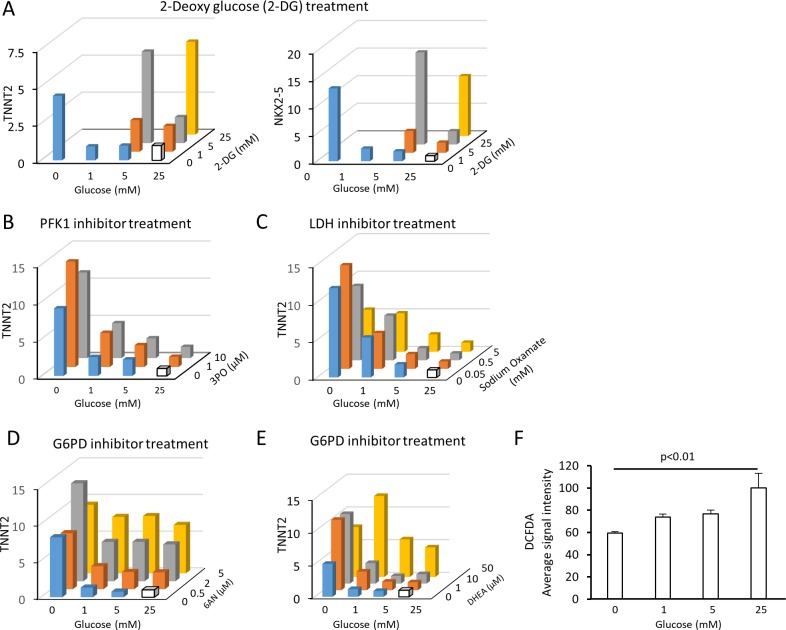
Figure 4. The pentose phosphate pathway inhibits cardiac maturation.
(A) Heatmap presentation of the metabolomics analysis of hESC-CMs cultured in the presence or absence of glucose. Note the decrease in the metabolites in purine metabolism, pyrimidine metabolism and the pentose phosphate pathway (PPP) in glucose-deprived conditions (n = 3, each). GlcA, glucuronic acid; R5P, ribose 5-phosphate; Rib, ribose; PRPP, phosphoribosyl pyrophosphate; S7P, sedoheptulose-7-phosphate. See also Figure 4—figure supplement 2. (B) ATP levels of hESC-CMs in 25 mM glucose medium (G25) and glucose-depleted medium (G0) (n = 3, mean ± SD, p = n .s. by t-test.) (C) Experimental regimen for chemical inhibition of glucose metabolic pathways. hESC-CMs are cultured in the medium containing four different glucose levels and different chemical inhibitors. See also Figure 4—figure supplement 3. (D) Relative mRNA expression of TNNT2 and NKX2-5 in different concentrations of glucose and 2-DG, a competitive inhibitor of glucose. 2-DG restored cardiac maturation in the presence of glucose. (E–H) Relative mRNA expression of TNNT2 in 0–25 mM glucose and with different chemical inhibitors of the glucose metabolic pathways: 0–10 μM 3PO (3-(3-pyridinyl)−1-(4-pyridinyl)−2-propen-1-one, a phosphofructokinase [PFK] inhibitor) (E); 0–5 mM sodium oxamate (NaOX; a lactate dehydrogenase [LDH] inhibitor) (F); 0–5 μM 6AN (6-aminonicotinamide, a glucose 6-phosphate dehydrogenase [G6PD] inhibitor) (G); and 0–50 μM DHEA (dehydroepiandrosterone, a G6PD inhibitor) (H). (n = 3, each. mean ± SD; p-value by one-way ANOVA.) See also Figure 4—figure supplement 4.
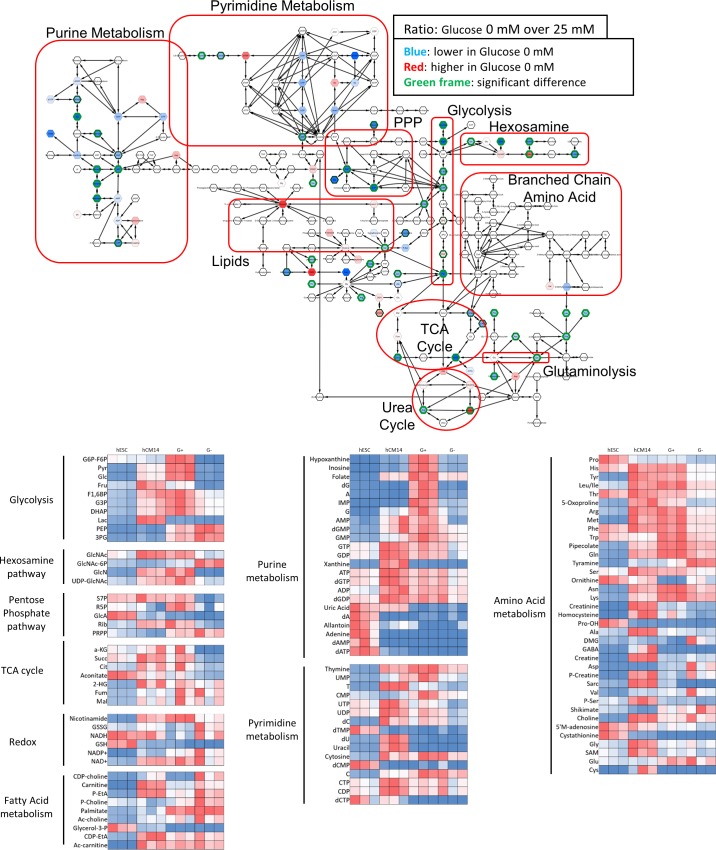
Figure 4—figure supplement 1. Metabolomics analyses by mass spectrometry.
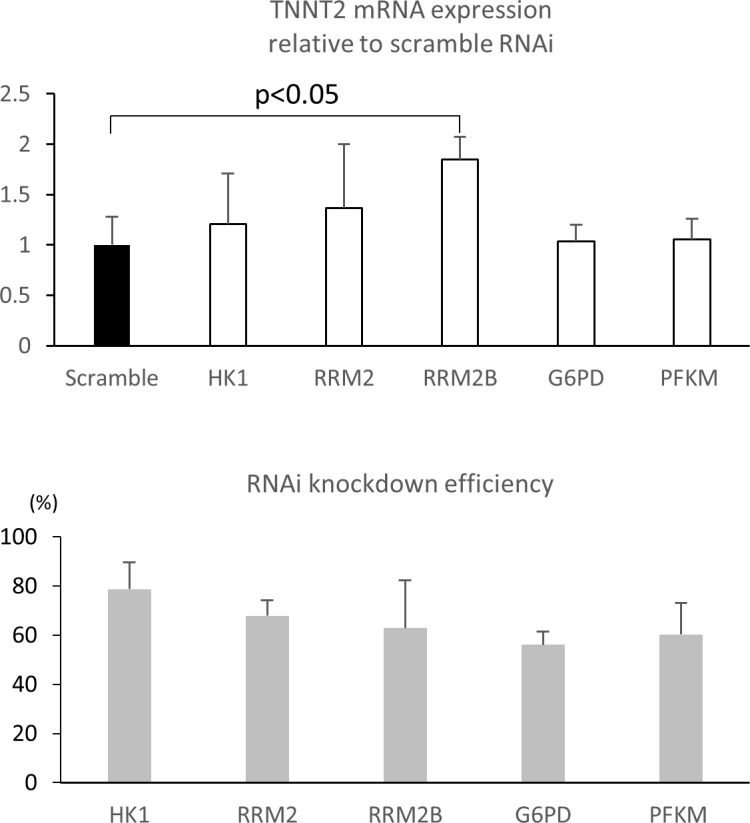
Figure 4—figure supplement 2. RNAi knockdown of glucose metabolic enzymes.
