Summary
Aim
Continuous technological innovation has provided the clinicians to access to a computerized device that can analyse the different characteristics of occlusal contacts. The purpose of this research was to use this device to study the occlusal forces comparing healthy subjects and TMD patients.
Materials and methods
The study was conducted by following specific criteria to select participants; the sample was divided into two homogeneous groups: control group (CG) comprising healthy subjects, and dysfunctional group (DG) comprising TMD patients. The occlusal force analysis was performed using the computerized system T-Scan III V 5.20 T. The data were analysed with statistical methods.
Results
The most significant differences emerged between the groups in the average occlusal load distribution and in the location of the centre of occlusal forces (COF). In particular, compared with the CG and the functional standard, reductions in the molar field forces on the second and first molars of 27% and 6.9%, respectively, were observed in the DG. The COF was located in the most forward position in TMD patients compared with healthy subjects.
Conclusions
Although the differences in the distribution of the occlusal forces and the location of the occlusal centre of gravity were significant, the relationship between occlusal contacts and TMD remains to be fully clarified. Further research is needed to investigate whether studying occlusal force distributions in both healthy subjects and TMD patients.
Keywords: T-Scan III, occlusogram, occlusal forces, TMD, occlusal contacts
Introduction
Years of scientific research investigating the pathogenetic factors of temporomandibular disorders (TMDs) have typically been focused on different aspects, such as the occlusion, which is one of the most controversial and debated aspects (1, 2).
The current reference patterns for functionally evaluating the occlusion refer to simple and generic schemes proposed over 50 years ago. One presented by Beyron has been recently quoted because it is regarded as the most reliable basis for a therapeutic occlusal scheme design in prosthetics, both for natural teeth and dental implants. This scheme provides the opportunity for the dental contact to be evenly distributed in a centric occlusion with a greater load in the posterior lateral areas, the absence of interference, and a stable occlusal relationship in a relaxed closure such that the occlusal model is convenient and does not disturb stomatognathic functions (3, 4). Many researchers have studied occlusal contacts and their possible relationship with TMDs (5, 6).
Some Authors (7–9) have significantly associated an asymmetric occlusal contact distribution with TMDs. No study has been able to clarify whether changes in the distribution of occlusal contacts occurred before or after the onset of TMD or their role.
The continuous development of biomedical technologies has provided researchers with tools to quantitatively and qualitatively analyse occlusal contact forces. With the advent of digitalization, Maness et al. (10) developed a high-precision, easy-to-use computerized system called T-Scan (produced by Tek-Scan, Boston USA). T-scan has been constantly improved in both its sensitivity and software (6); the latest evolution, the T-Scan III, is now available in its ninth version (T-Scan Novus). The system uses a sensor that is interposed between the arches to transform the data from the occlusal contact into a numeric value expressed as a percentage (1, 11, 12). In this way, each tooth can be assigned its own percentage of strength, reconstructing a model of the distribution and intensity of the occlusal contact loads (13–15). The model of distribution of the occlusal forces proposed by Maness, expected a greater load on the first upper molars which thus represented the “center of thrust” of occlusion (20).
After Maness, one of the first Authors to use this digitalized occlusal contacts analysis method to reconstruct a distribution pattern of the occlusal forces was Garcia Cartagena et al., in 1997 (13). His study used the T-Scan II and showed that the maximum load was located on the second lower molars, decreasing towards the incisors, and that the average occlusal load was greater on the left side. More recently, two initial studies of the pattern of occlusal forces in healthy subjects and TMD patients were conducted by the Authors of this work in 2010 and 2011 (15, 16). The results showed that the maximum load fell in the area of the first upper molars at the mesial-palatal cusp, and these data were partially confirmed by Ma et al. in 2013 (17). In 2012, Qadeer et al. stated that the digital T-Scan III technology could effectively aid (18) the analysis of occlusal contacts as an alternative to the use of conventional, non-digital indicators (19).
The aim of this study was to use the T-Scan III to analyse and compare the distribution patterns of occlusal forces in healthy and TMD patients.
Materials and methods
The study included two groups of subjects: the dysfunctional group (DG), comprising patients diagnosed with TMD according to the Diagnostic Criteria for TMD, and the control group (CG), comprising healthy subjects. A questionnaire regarding privacy laws allowing the use of sensitive data for research purposes and an informed consent form to participate in clinical research were given to each participant. The study also statistically examined the data obtained from the two groups. In all stage of the study, the ethical guidelines of the 1975 Helsinki Declaration were followed, the research was approved by the Department and Ethics Committee: Department of Oral and Maxillofacial Sciences, Sapienza University of Rome.
Selection of the two groups
Members of the DG: were selected between September 2014 and February 2015 from among those who spontaneously came for a first specialist visit at the Gnathology Service Clinic Head and Neck Department of the Policlinico Umberto I “Sapienza” University of Rome. The number of patients admitted during this period was 152; subjects were selected from this group according to specific inclusion and exclusion criteria listed in Table 1. In all, 35 patients (28 females and 7 males) with an average age of 39.8 years were included.
Table 1.
Inclusion and exclusion criteria adopted for the selection of the two groups.
| Inclusion Criteria | Exclusion Criteria | ||
|---|---|---|---|
| DG | CG | DG | CG |
|
|
|
|
Members of the CG: were selected from among students of the Degree Course in Dentistry of the “Sapienza” University of Rome according to the same inclusion/exclusion criteria (Tab. 1). The CG comprised 28 subjects (16 females and 12 males) with an average age of 26.3 years.
Instrument and method used to analyse the occlusal forces in the two groups
The digital occlusion analysis was performed using the T-Scan III v. 5.20 T. All examinations were performed by the same dentist, who specialised in the use of the system. The resulting data were evaluated by a second person with the same characteristics who knew neither the patients nor the subjects of the CG. The computerized occlusion T-Scan III analysis was performed in maximum intercuspation in accordance with the following protocol:
Patient remains in the sitting position without support head gear but with the support of the sensor parallel to the floor.
Filling in the patient’s medical records as required by the software, including data concerning sex, age, upper central incisor size, lack of dental elements, and the presence of prosthetic crowns.
Choosing a small or large sensor for a proper fit in relation to arch size.
Setting the size of the central incisor support, allowing the software to calculate the size of the arch to report the dental contacts of individual teeth.
Informing the patient of the nature of the test and performing preliminary motions.
Carrying out the examination first without activating the recording but with the sensor inserted in the mouth.
Checking whether the sensitivity setting is set correctly; if on maximum strength, 4 or 5 columns appear at maximum intensity.
Asking the patient to bite the sensor firmly after recording activation and to keep teeth clenched in the intercuspal position for a few seconds.
Visually assessing the video and processing the data.
Of the three tests performed, the occlusal recordings in both the CG and DG contained the most information was considered.
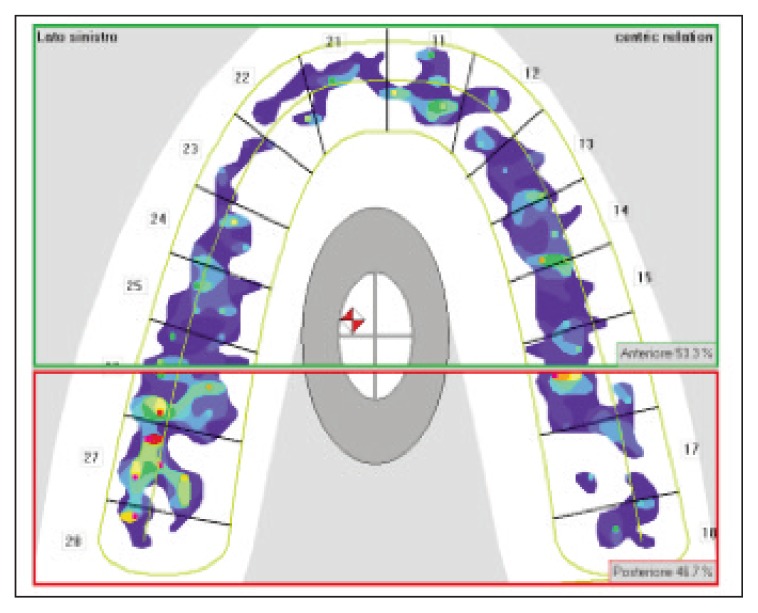
The analysis of the occlusal forces was performed by evaluating the data for each dental element and for each side (left and right) and sector (back and front), following the same procedure for each examined subject. The right side was distinct from the left, as indicated by the interincisive line drawn on the occlusal axis. The front area was distinct from the back, considering the maximum occlusal load (MOL) line as the demarcation limit. This line is defined by the straight line joining the two mesiopalatal cusps of the first upper molars that represent the major occlusal loading area (Fig. 1). In the event that asymmetry prevented to joining of these cusps with a single line, by convention it was decided to refer to that passing through the mesiopalatal cusp of the first superior molar on the right.
Figure 1.
Graphical representation of the MOL.
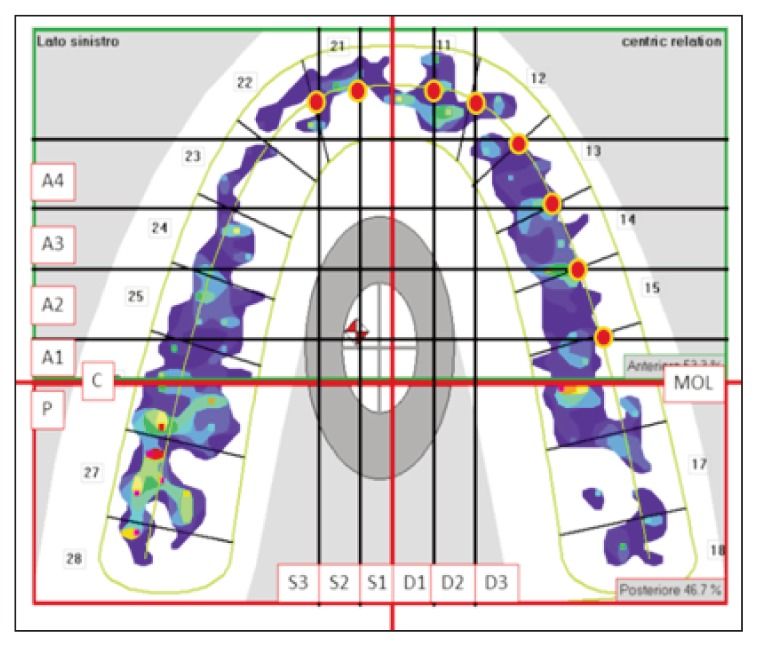
Another evaluation parameter examined was the centre of occlusal forces (COF). According to the producer of the T-Scan, the COF represents the centre of gravity of the occlusion, i.e., the balance point of the occlusal forces obtained by summing the moments of the forces pressing on individual occlusal contacts. This assessment is only graphical-positional, is processed directly by the software within a predefined area, and was not considered sufficiently reliable by the Authors; therefore, to obtain a more accurate assessment of the COF, a different methodology was developed. The graphical representation of the occlusal provided by the software was divided into sectors by building a grid with eight straight lines, four each parallel to the MOL and to the interincisive line. These straight lines are perpendicular to each other and are traced by considering some easily detectable points on the chart provided by the programme. The straight lines parallel to the MOL are determined by the union of the emerging central points from the meeting point of the midline of the occlusal forces and the line segments bordering the occlusal surfaces of premolars and canines. The straight lines parallel to the interincisive line are traced in the following manner: first, the two straight lines passing through the points of contact between the median line of the occlusal forces and the line segments delimiting the distal surfaces of the two upper central incisors are drawn; then, the other two straight lines passing them to the identified point are drawn, always on the median line, by calculating half the distance between the first two lines and the interincisive line.
Compared with the interincisive line, the COF can be located on the right (D) or left (S). Each side was further divided into three encoded areas: the first area, as indicated by D1 or S1; the second area, as indicated by D2 or S2 and corresponding to the second half of the incisor in question; and the third area, as indicated by D3 or S3 on the outer remaining portion after the first two (Fig. 2).
Figure 2.
Graphical representation of the subdivision of the occlusal plane for the graphical-positional evaluation of COF.
Three possible variables were obtained with this method compared with the MOL: 1. Coincident (C); 2. Rear (P); 3. Front (A). In turn, variable A is divided into 4 sectors, numerically coded and indicated by A1, A2, A3 and A4. The distance of the COF from the MOL and the interincisive line was used as a parameter for assessing its location in both the CG and the DG.
The descriptive analysis of the occlusal forces was conducted considering the absolute values, averages and the respective standard deviations.
Statistical analysis
The basic descriptive statistical evaluation was performed in two stages: 1. Analysis of the occlusal load percentage of any single tooth; 2. Analysis of the arithmetic average of the occlusal load. This last point has been evaluated both for side (left and right) and for sector (anterior and posterior). All evaluations were performed in the same process for the two groups of patients also considering the standard deviation.
All data were sent for statistical processing to a specialist for determining the significance of the data obtained using a significance level of P<0.05 and the student t-test, which is a parametric test, to verify that significant differences between the two groups were not due to chance but instead to an actual difference between the averages of the two populations from which the samples were derived.
Results
As stated above, the analysis of the forces was conducted for individual dental elements, per side and per sector. A separate analysis was performed for evaluating the COF.
Analysis of the occlusal forces for single dental elements
Force values expressed as a percentage for individual teeth in members of the CG and DG were considered for this assessment. The arithmetic averages and the respective standard deviations were determined. Table 2 shows the average values detected for single dental elements in the two groups expressed as percentages.
Table 2.
Average measured force per tooth element in the two groups.
| Average occlusal loading detected on dental elements in the two groups | ||||||||||||||||
|---|---|---|---|---|---|---|---|---|---|---|---|---|---|---|---|---|
| Dental element | 18 | 17 | 16 | 15 | 14 | 13 | 12 | 11 | 21 | 22 | 23 | 24 | 25 | 26 | 27 | 28 |
| Control Group | - | 14,5 | 14,7 | 7,6 | 6,8 | 2,2 | 1,0 | 1,5 | 2,2 | 0,9 | 3,2 | 5,4 | 6,3 | 14,0 | 12,7 | - |
| Dysfunctional Group | - | 9,2 | 12,7 | 6,3 | 6,3 | 4,5 | 1,8 | 4,0 | 4,1 | 2,0 | 4,1 | 5,7 | 6,1 | 14,0 | 10,5 | - |
The values are given as mean occlusal force expressed as a percentage
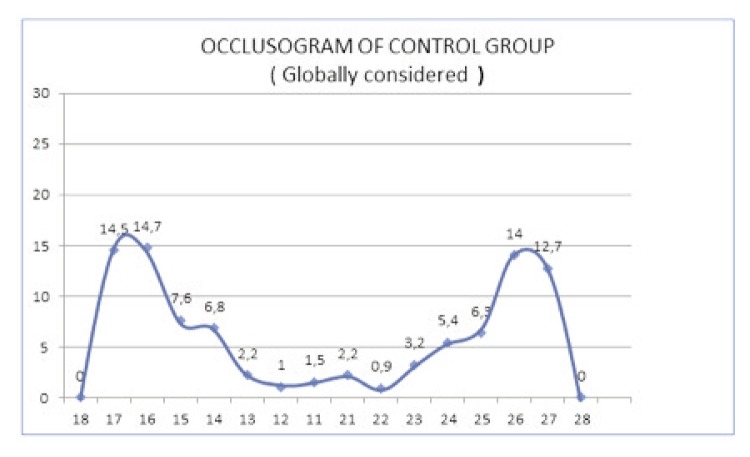
In the CG, the greatest occlusal loading was detected in the area of the first upper molar with an average percentage of 14.35% strength. On the second molar, the percentage of detected force was 13.6%. On the other elements, proceeding in the posterior-anterior direction (premolars, canines, incisors), progressively inferior values were registered until the incisal area.
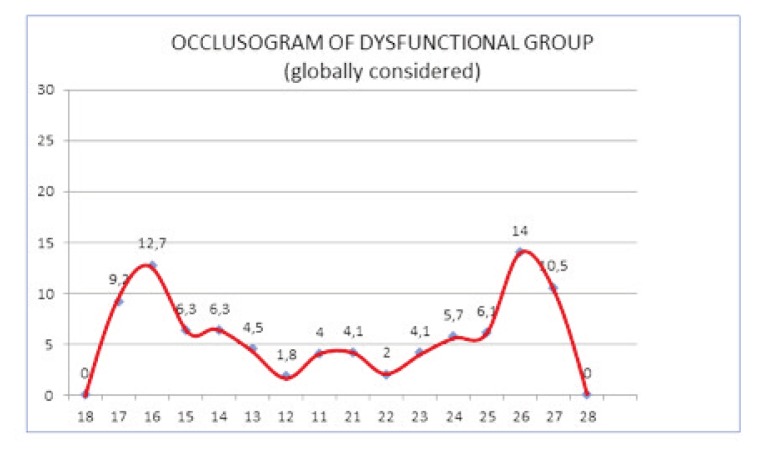
There were some differences in the occlusal loads detected in the DG compared with the CG. In particular, in the area of the first and second molars, these differences were 13.35 and 9.85%, respectively, corresponding to percentage decreases of 6.97 and 27% in the DG. The percentages of force detected on the second and first premolars were 6.2 and 6.0%, respectively, with reductions of 10.8 and 1.64%.
In the area of the front group, an average load of 4.3% was detected on the canines. On the lateral and central incisors, average loads of 1.9 and 4.05% were detected, with increases of 59.25, 192.30 and 143.24%, respectively, compared with the CG.
To obtain a full view of the occlusal force distribution pattern, the Authors added the recorded average data for single teeth to a Cartesian axis system, producing a graph defined as an occlusogram for each group (Charts 1, 2).
Chart 1.
Occlusogram in the CG.
Chart 2.
Occlusogram in the DG.
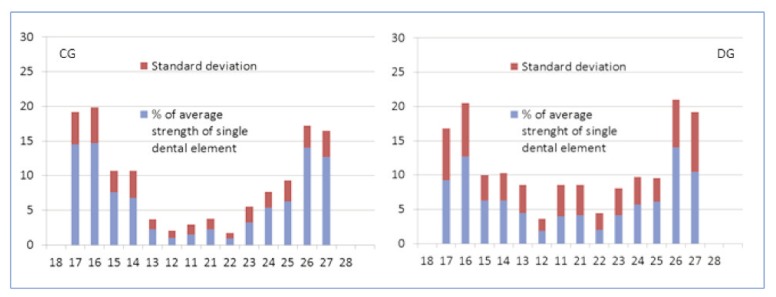
Standard deviation was assessed by analysing the deviations of single teeth in the two groups (Tab. 3). Evaluated in the two groups showed significant differences. These differences are expressed as percentages and reached a maximum of 193.54% on the upper central incisors. This finding is represented in the Table referring to all the teeth analysed.
Table 3.
Standard deviation values in the two groups.
| Average occlusal loadings and relative standard dev. detected on dental elements in the Control Group | ||||||||||||||||
|---|---|---|---|---|---|---|---|---|---|---|---|---|---|---|---|---|
|
| ||||||||||||||||
| Dental element | 18 | 17 | 16 | 15 | 14 | 13 | 12 | 11 | 21 | 22 | 23 | 24 | 25 | 26 | 27 | 28 |
| Occlusal force | - | 14,5 | 14,7 | 7,6 | 6,8 | 2,2 | 1,0 | 1,5 | 2,2 | 0,9 | 3,2 | 5,4 | 6,3 | 14,0 | 12,7 | - |
|
|
||||||||||||||||
| Standard dev. | - | 4,7 | 5,2 | 3,1 | 3,9 | 1,5 | 1,1 | 1,5 | 1,6 | 0,8 | 2,3 | 2,3 | 3,0 | 3,2 | 3,8 | - |
The values are given as mean occlusal force expressed as a percent age
| Average occlusal loadings and relative standard dev. detected on dental elements in the Dysfunctional Group | ||||||||||||||||
|---|---|---|---|---|---|---|---|---|---|---|---|---|---|---|---|---|
|
| ||||||||||||||||
| Dental element | 18 | 17 | 16 | 15 | 14 | 13 | 12 | 11 | 21 | 22 | 23 | 24 | 25 | 26 | 27 | 28 |
| Occlusal force | - | 9,2 | 12,7 | 6,3 | 6,3 | 4,5 | 1,8 | 4,0 | 4,1 | 2,0 | 4,1 | 5,7 | 6,1 | 14,0 | 10,5 | - |
|
|
||||||||||||||||
| Standard dev. | - | 7,6 | 7,8 | 3,7 | 4,0 | 4,1 | 1,8 | 4,6 | 4,5 | 2,5 | 4,0 | 4,0 | 3,5 | 7,0 | 8,7 | - |
The values are given as mean occlusal force expressed as a percentage
In the following Charts (Charts 3), the average occlusal force in the two groups is represented by vertical column histograms that represent individual teeth show the respective standard deviations.
Chart 3.
Comparison of standard deviations occlusal forces between CG and DG.
The detected data were analysed using the student t-test and are presented in Table 4. This Table shows the average forces recorded for each dental element as percentages with the relative levels of P-values significance.
Table 4.
Average measured force for each dental element in the two groups with the relative levels of significance, with a threshold of P<0.05.
| Average occlusal loadings detected on dental elements in both Groups with the relative P-value | ||||||||||||||||
|---|---|---|---|---|---|---|---|---|---|---|---|---|---|---|---|---|
|
| ||||||||||||||||
| Dental element | 18 | 17 | 16 | 15 | 14 | 13 | 12 | 11 | 21 | 22 | 23 | 24 | 25 | 26 | 27 | 28 |
| Control Group | - | 14,5 | 14,7 | 7,6 | 6,8 | 2,2 | 1,0 | 1,5 | 2,2 | 0,9 | 3,2 | 5,4 | 6,3 | 14,0 | 12,7 | - |
|
|
||||||||||||||||
| Dysfunctional Group | - | 9,2 | 12,7 | 6,3 | 6,3 | 4,5 | 1,8 | 4,0 | 4,1 | 2,0 | 4,1 | 5,7 | 6,1 | 14,0 | 10,5 | - |
|
| ||||||||||||||||
| P-value | - | 0,018 | 0,393 | 0,242 | 0,686 | 0,050 | 0,123 | 0,050 | 0,142 | 0,112 | 0,428 | 0,768 | 0,863 | 0,971 | 0,379 | - |
The values are given as mean occlusal force expressed as a percentage
The statistical analysis revealed significant results for elements 17, 13 and 11, which show greater variation between the two groups.
Analysis of the occlusal forces per side
The assessment of the occlusal forces on the right and left sides was performed considering the average values and respective standard deviations detected in the two groups.
Even these data were analysed using the student t-test to verify whether the differences between the averages of the two samples were significant; the obtained values are shown in Table 5.
Table 5.
Average measured force per side and sector in the two groups with the respective standard deviations, mean differences and level significance.
| Average occlusal forces detected by side and sector of both groups, relative standard dev. and level significance of P-value | ||||
|---|---|---|---|---|
| SIDE | DX | SX | Main difference | Standard dev. |
| Control group | 50,2 | 49,7 | 0,5 | 7,7 |
| Dysfunctional group | 47,1 | 52,8 | 5,7 | 10,5 |
| P-value | 0,3238 | 0,3256 | ||
| SECTOR | POSTERIOR | ANTERIOR | Main difference | Standard dev. |
| Control group | 52,3 | 47,0 | 4,7 | 7,6 |
| Dysfunctional group | 44,1 | 55,9 | 11,8 | 21,8 |
| P-value | 0,1777 | 0,1725 | ||
The values are given as mean occlusal force expressed as a percentage
There were no significant differences between the two groups. However, an increase in the main difference in the DG was noted compared with the CG (from 0.5 to 5.7), as well as an increase in standard deviation from 7.7 in the CG to 10.5% in the DG.
The analysis of the side forces also highlighted that in these groups, on average, the left side has a greater load percentage than the right side.
Analysis of the occlusal forces per sector
As mentioned above, the anterior region is bordered from the rear by the MOL. In fact, it is in correspondence to this zone that the MOL is usually located and referred to more generically as the first upper molar. In Table 5 lists the average values per sector (front and back) in the two groups. The standard deviations and the average differences observed between the two corresponding sectors are also given.
These data were also analysed using the student t-test to verify whether the differences between the averages of the two samples were statistically significant; the values obtained are reported in Table 5.
The P-values obtained were not significant. However, the differences between the two groups seemed to indicate a recurring tendency, i.e., an increase in the percentage of strength in the anterior region in the DG compared with the CG.
Analysis of COF position in the posterior-anterior direction
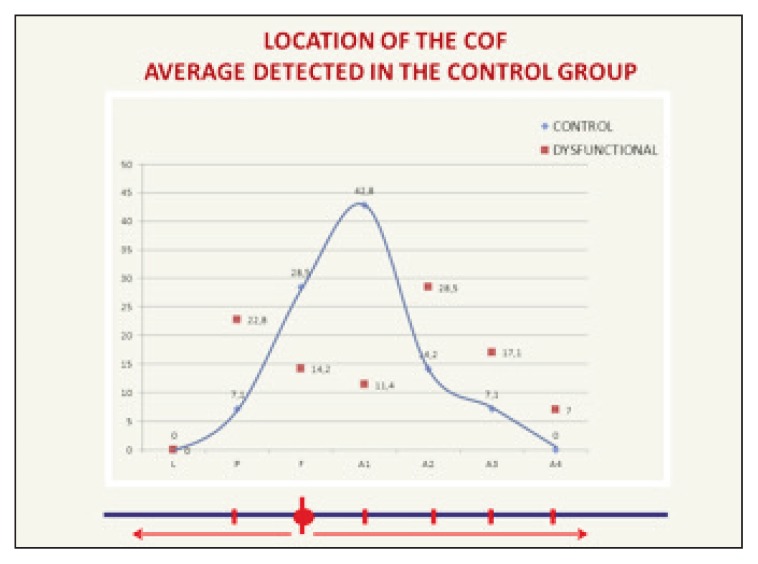
As described above, the assessment of the COF location in the anteroposterior direction is considered a function of its distance from the MOL. The Authors identified and marked with numerical code 3 specific areas for the evaluation of the COF position with respect to the MOL: 1. coincident (C); 2. posterior (P); and 3. anterior (A). As area A was larger, it was further divided into 4 numerically encoded sectors: A1, the remaining portion of the first molar; A2, at the second premolar; and A3 and A4, corresponding to the first bicuspid and canine areas, respectively. Table 6 shows the rates (expressed as percentages) at which the centre of gravity was located in different areas in the two groups. These data are also represented graphically.
Table 6.
Localization of COF detected in the two groups.
| Average COF location in the posteroanterior direction | ||||||
|---|---|---|---|---|---|---|
|
| ||||||
| SECTOR | P | C | A1 | A2 | A3 | A4 |
| CONTROL GROUP | 7,1 | 28,5 | 42,8 | 14,2 | 7,1 | 0 |
|
|
||||||
| TMD GROUP | 22,8 | 14,2 | 11,4 | 28,5 | 17,1 | 7 |
The values are given as mean expressed as a percentage.
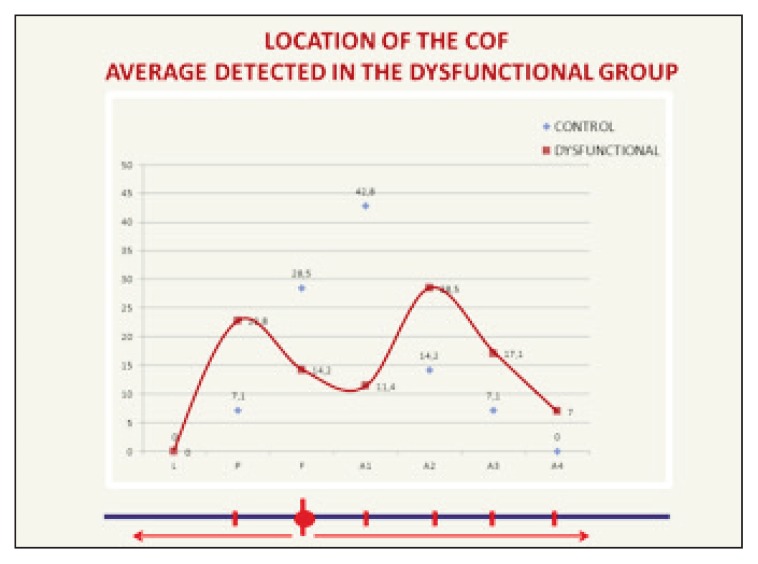
The analysis of the COF position highlighted that in the CG, on average, the COF coincided with the MOL (or remains in A1), while in the DG, the COF tended be positioned more towards the rear (P) or the front areas (A2, A3, A4) (Charts 4, 5).
Chart 4.
Graphical representation of the COF position in the CG.
Chart 5.
Graphical representation of the COF position in the DG.
Analysis of COF position in the latero-lateral direction
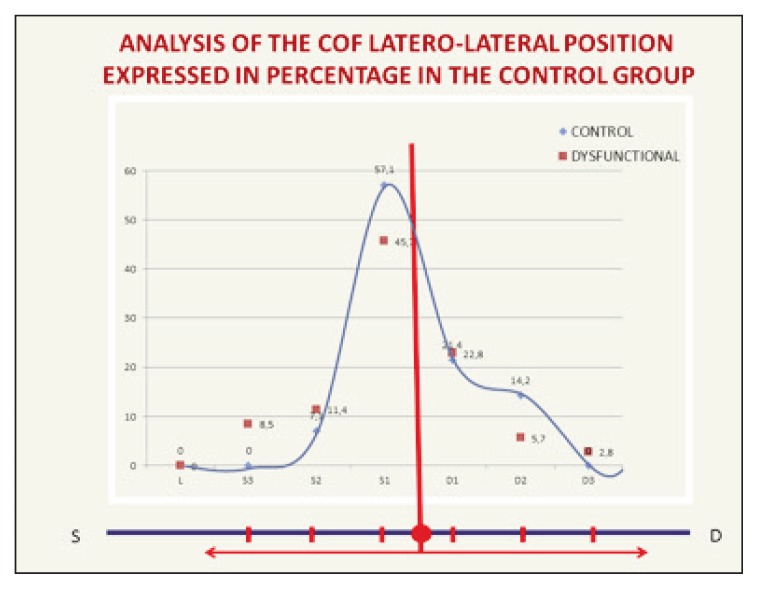
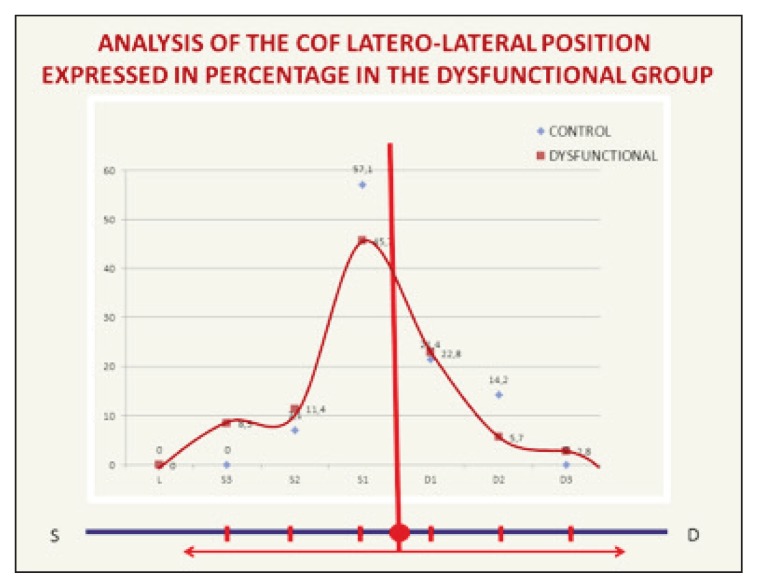
To evaluate the COF position in the latero-lateral direction, its distance from the interincisive line was considered, thus identifying three areas (1–3) for both the right (D) and the left (S) parts. Table 7 shows the frequencies (expressed as percentages) with which the COF was localized in the different areas in the two groups. These data are also represented graphically.
Table 7.
Localization of COF detected in the two groups.
| Average COF location in laterolateral direction | ||||||
|---|---|---|---|---|---|---|
|
| ||||||
| SECTOR | S3 | S2 | S1 | D1 | D2 | D3 |
| CONTROL GROUP | 0 | 7,1 | 57,1 | 21,9 | 14,2 | 0 |
|
|
||||||
| TMD GROUP | 8,5 | 11,4 | 45,7 | 22,8 | 5,7 | 2,8 |
The values are given as mean expressed as a percentage.
The analysis of the COF position showed that it was more frequently located on the left side in both groups. In the DG, the COF tended to be located in the S2 and S3 areas more often, showing a greater range of localization (Charts 6, 7).
Chart 6.
Graphical representation of the COF position in the CG.
Chart 7.
Graphical representation of the COF position in the DG.
Discussion
The data recorded on the individual teeth of healthy subjects indicate that there is a recurring pattern in the distribution of the occlusal forces, which in the limits of the examined sample, could be referred to as “normal” or a reference (9, 16–19). This model has been defined as an occlusogram, which showed that the area with the highest load, i.e., the MOL, was located at the mesiopalatal cusp of the first upper molars. Within this area, the occlusal loads tended to steadily decrease in the rear direction, towards the second and third molars, but more so in the anterior direction, towards the incisors.
The identification of the maximum load at the level of the first upper molars, apart from being in accordance with the classical gnathology concepts now widely reported in texts by Authors such as Maness and Pedoloff (20), Okeson (21), Dawson and Arcan (22), and Ciancaglini (9), is also in agreement with the work of others; in 1996 and 2002, the previously mentioned Ciancaglini performed a study with occlusal waxes and obtained similar results (23). When analysing occlusal forces with a T-Scan II in 1996, Garcia Cartagena et al. (13) had proposed a slightly different model by singling out the major load on the second inferior molar. However, in 2013, Ma et al. (17) used a T-Scan III on 53 healthy subjects with normal occlusion (29 males and 24 females) and claimed to have found data supporting a model in which the MOL was located in an area between the first premolar to the second molar.
In spite of an incomplete accordance of data in the literature, the Authors consider the presented model to be valid. This conclusion is supported by other factors of the clinical examination conducted, such as repeatability, sensitivity and simplicity. If carried out properly, the digitalized occlusion examination is simple, repeatable, and largely operator independent. Moreover, the occlusogram is very sensitive to any acute modification of the occlusion. The simplicity of the scheme is in line with the most recent statements regarding occlusal models proposed for prosthetics that reflect the concepts expressed by Beyron (3, 4) in the fifties and quoted in a work by Manfredini (24).
Additionally, regarding the COF evaluation, the results revealed a recurring and statistically prevailing pattern. On average, it is located in a frontal area immediately adjacent to the MOL, and the statistical analysis of the frequencies of its location in healthy subjects showed a Gaussian behaviour, with a maximum frequency in the A1 area, which decreases in the front and rear directions. The study of the frequency with which the COF is located in a given area was made possible by the specific graphical-positional evaluation grid conceived and developed by the Authors.
The use of the map designed by the Authors makes it difficult to compare other data from the literature obtained using different systems or processed by the software supplied with the device.
Regarding the comparison of data from the two groups, both the occlusogram and COF analyses showed statistically significant differences.
Specifically, the occlusogram in the DG showed a reduced occlusal load in the posterior region and an increased load in the frontal area (Charts 1, 2). This result, which seems far from those of other Authors, could be a physiological pattern and is repeated even with wide individual variations in the DG.
In the DG, the COF was located with a maximum frequency in front of or behind the A1 zone, the more balanced area, and this change has been translated graphically, showing a loss of the Gaussian characteristic, which represents the distribution of normal variations; the appearance of a bipolar curve is shown in Charts 5. Additionally, compared with the CG, the standard deviation analysis of the DG showed a substantial increase in all the evaluations performed, per single dental element, per side and per sector. A high standard deviation value is indicative of an abnormal and non-repetitive distribution of occlusal forces, a behaviour that appears in the DG and not in the CG.
Studying these variables was enabled by carefully mapping the occlusal surface and paying scrupulous attention during the tests. The results revealed several trends and significant differences in the distribution of occlusal forces and the centre of gravity between healthy subjects and TMD patients.
Conclusions
The research has highlighted two limits the sample size and that the values considered are obtained by the software.
Despite these limitations, the findings of the study are suggestive to a new possibility of using this digital system both for clinical and research applications. In particular, the recurring statistically significant data achieved from healthy and dysfunctional subjects, could become a reference in the study of occlusal forces and in the evaluation of the functionality of the stomatognathic system. The method used has proved good repeatability and low operator dependence. It is necessary to remember that the examinations must be conducted by carefully following the correct indication and the data must be interpreted in a way that is coherent to what is being measured. The exam, in fact, analyses, before, during and after a specific therapy, the occlusal force distribution per dental element, side and sector and assesses the position of the COF. It ‘should finally point out that the T-Scan III system does not yet permit any pathogenic interpretation of the causes of such a behaviour as well as any diagnostic evaluation of temporomandibular joint dysfunction.
Further investigation is still needed to confirm the preliminary hypotheses proposed and to better understand future potential applications.
Footnotes
Report on the review
The Authors have carried out the required revision. The English translation was made at the American Journal Expert (AJE) that has released its editorial certification.
References
- 1.Ciancaglini R, Gherlone EF, Redaelli S, Radaelli G. The distribution of occlusal contacts in the intercuspal position and temporomandibular disorder. J Oral Rehabil. 2002;29:1082–1090. doi: 10.1046/j.1365-2842.2002.00941.x. [DOI] [PubMed] [Google Scholar]
- 2.Watanabe EK, Yatani H, Kuboki T, Matsuka Y, Terada S, Orsini MG, et al. The relationship between signs and symptoms of temporomandibular disorders and bilateral occlusal contact patterns during lateral excursions. J Oral Rehabil. 1998;25:409–415. doi: 10.1046/j.1365-2842.1998.00262.x. [DOI] [PubMed] [Google Scholar]
- 3.Beyron H. Occlusal relationship. Int Dent J. 1952;2:467. [Google Scholar]
- 4.Beyron HL. Characteristics of functionally optimal occlusion and principles of occlusal rehabilitation. J Am Dent Assoc. 1954;48:648–656. doi: 10.14219/jada.archive.1954.0111. [DOI] [PubMed] [Google Scholar]
- 5.Manfredini D, Stellini E, Marchese-Ragona R, Guarda-Nardini L. Are occlusal features associated with different temporomandibular disorder diagnoses in bruxers? Cranio. 2014;32:283–288. doi: 10.1179/2151090314Y.0000000008. [DOI] [PubMed] [Google Scholar]
- 6.Haralur SB. Digital evaluation of functional occlusion parameters and their association with temporomandibular disorders. J Clin Diagn Res. 2013;7:1772–1775. doi: 10.7860/JCDR/2013/5602.3307. [DOI] [PMC free article] [PubMed] [Google Scholar]
- 7.Ciancaglini R, Gherlone EF, Radaelli G. Unilateral temporomandibular disorder and asymmetry of occlusal contacts. J Prosthet Dent. 2003;89:180–185. doi: 10.1067/mpr.2003.9. [DOI] [PubMed] [Google Scholar]
- 8.Liu ZJ, Yamagata K, Kasahara Y, Ito G. Electromyographic examination of jaw muscles in relation to symptoms and occlusion of patients with temporomandibular joint disorders. J Oral Rehabil. 1999;26:33–47. doi: 10.1046/j.1365-2842.1999.00356.x. [DOI] [PubMed] [Google Scholar]
- 9.Ciancaglini R. Proceedings of the Research Forum. Milan: International Meeting in Clinical Gnatology; 1997. Posture, occlusion and general health; p. 224. [Google Scholar]
- 10.Maness WL, Benjamin M, Podoloff R, Robick A, Golden RF. Computerized occlusal analysis: a new technology. Quintessence Int. 1987;18:287–292. [PubMed] [Google Scholar]
- 11.Koos B, Godt A, Schille C, Göz G. Precision of an instrumentation-based method of analyzing occlusion and its resulting distribution of forces in the dental arch. J Orofac Orthop. 2010;71:403–410. doi: 10.1007/s00056-010-1023-7. [DOI] [PubMed] [Google Scholar]
- 12.Throckmorton GS, Rasmussen J, Caloss R. Calibration of T-Scan sensors for recording bite forces in denture patients. J Oral Rehabil. 2009;36:636–643. doi: 10.1111/j.1365-2842.2009.01978.x. [DOI] [PubMed] [Google Scholar]
- 13.Garcia Cartagena A, Gonzalez Sequeros O, Garrido Garcia VC. Analysis of two methods for occlusal contact registration with the T-Scan system. J Oral Rehabil. 1997;24:426–432. doi: 10.1046/j.1365-2842.1997.00507.x. [DOI] [PubMed] [Google Scholar]
- 14.Garrido García VC, García Cartagena A, González Sequeros O. Evaluation of occlusal contacts in maximum intercuspation using the T-scan system. J Oral Rehabil. 1997;24:899–903. doi: 10.1046/j.1365-2842.1997.00586.x. [DOI] [PubMed] [Google Scholar]
- 15.Ferrato G, Boccassini A, Panti F, Di Paolo C. Poster Dental contacts and TMD: a comparison between clinical data and T-scan data. Collegio Docenti di Odontoiatria; Chieti: 2010. Aprile. pp. 21–23. [Google Scholar]
- 16.Ferrato G, Boccassini A, Panti F, Di Paolo C. Poster Analysis of occlusal forces in TMD with T-Scan III. Collegio Docenti di Odontoiatria; Siena: 2011. Aprile. pp. 14–16. [Google Scholar]
- 17.Ma FF, Hu XL, Li JH, Lin Y. Normal occlusion study: using T-Scan III occlusal system. Zhonghua Kou Qiang Yi Xue Za Zhi. 2013;48:363–367. [PubMed] [Google Scholar]
- 18.Qadeer S, Kerstein R, Kim RJ, Huh JB, Shin SW. Relationship between articulation paper mark size and percentage of force measured with computerized occlusal analysis. J Adv Prosthodont. 2012;4:7–12. doi: 10.4047/jap.2012.4.1.7. [DOI] [PMC free article] [PubMed] [Google Scholar]
- 19.Afrashtehfar Kl, Qadeer S. Computerized occlusal analysys as an alternative occlusal indicator. Cranio. 2016;34:52–57. doi: 10.1179/2151090314Y.0000000024. [DOI] [PubMed] [Google Scholar]
- 20.Maness WL, Pedoloff R. Distribution of occlusal contacts in maximum intercuspation. J Prosthet Dent. 1989;62:238–242. doi: 10.1016/0022-3913(89)90321-1. [DOI] [PubMed] [Google Scholar]
- 21.Okeson JP. Management of Temporomandibular Disorders and Occlusion. Bologna: Elsevier Edizioni Martina s.r.l.; 2014. [Google Scholar]
- 22.Dawson PE, Arcan M. Attaining harmonic occlusion through visualized strain analysis. J Prosthet Dent. 1981;46:615–622. doi: 10.1016/0022-3913(81)90067-6. [DOI] [PubMed] [Google Scholar]
- 23.Ciancaglini R. Gnatologia e dolori oro-facciali: libro di testo. Milano: Elsevier Masson; 2007. [Google Scholar]
- 24.Manfredini D. Il dentista moderno. 2010. Dic. Occlusione in implantoprotesi: elementi biofisiologici e gnatologici; p. 9. [Google Scholar]


