Abstract
Mammalian zygomatic arch shape is remarkably variable, ranging from nearly cylindrical to blade-like in cross section. Based on geometry, the arch can be hypothesized to be a sub-structural beam whose ability to resist deformation is related to cross sectional shape. We expect zygomatic arches with different cross sectional shapes to vary in the degree to which they resist local bending and torsion due to the contraction of the masseter muscle. A stiffer arch may lead to an increase in the relative proportion of applied muscle load being transmitted through the arch to other cranial regions, resulting in elevated cranial stress (and thus, strain). Here, we examine the mechanics of the zygomatic arch using a series of finite element modeling experiments in which the cross section of the arch of Pan troglodytes has been modified to conform to idealized shapes (cylindrical, elliptical, blade-like). We find that the shape of the zygomatic arch has local effects on stain that do not conform to beam theory. One exception is that possessing a blade-like arch leads to elevated strains at the postorbital zygomatic junction and just below the orbits. Furthermore, although modeling the arch as solid cortical bone did not have the effect of elevating strains in other parts of the face, as had been expected, it does have a small effect on stress associated with masseter contraction. These results are counterintuitive. Even though the arch has simple beam-like geometry, we fail to find a simple mechanical explanation for the diversity of arch shape.
Keywords: zygomatic arch, Pan troglodytes, shape, force, stress, strain, FEA
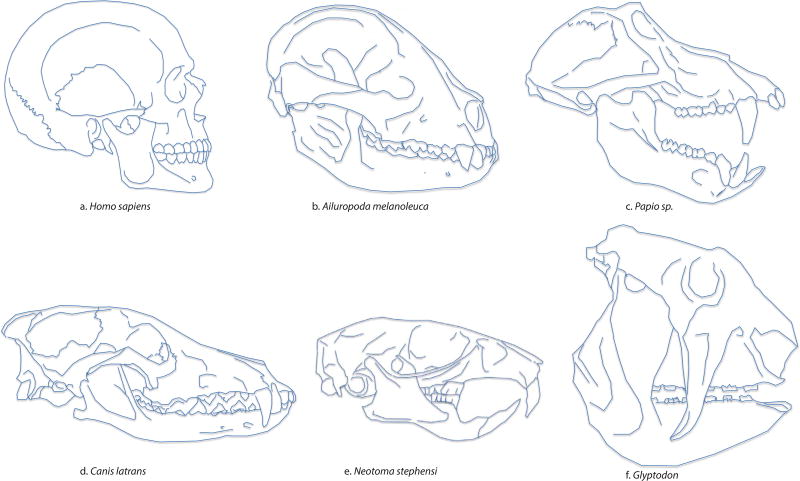
The zygomatic arch plays a critical role in the mammalian masticatory system. Formed by the union of the zygomatic process of the temporal bone and the temporal process of the zygomatic bone, it is from this beam-like structure that the masseter muscle, a major jaw adductor, originates. The shape of the zygomatic arch in mammals is remarkably variable, ranging from almost cylindrical (rounded in cross section) in macaques, some rodents and humans to elliptical in baboons to deep and blade-like in pandas (Figueirido et al., 2012, 2013, 2014), gorillas (Wroe et al., 2010), felids (Christiansen, 2008), canids (Milenkovic et al., 2010; La Croix et al., 2011), thylacinidae (Attard et al., 2014), pigs (Rafferty et al., 2000; Herring and Mucci, 1991; Herring et al., 1996; Teng et al., 1997; Freeman et al., 1997) and chimpanzees, to inferiorly flanged as in the Pleistocene armadillo subfamily Glyptodontinae (Figure 1). Although the importance of the zygomatic arch for masticatory function is not disputed, the precise mechanical consequences of these apparent shape differences remain unclear.
Figure 1.
Variation in zygomatic arch shape across mammalian taxa. a: Modern human, b: Giant Panda, c: Baboon, d: Coyote, e: Wood Rat, f: Glyptodon. Skulls are scaled for viewing and do not reflect actual size of species.
Steep strain gradients have been shown to span the length of the zygomatic arch in macaques, pigs and cats (Hylander and Johnson, 1997; Herring et al., 1996; Herring, 2001; Buckland-Wright, 1978; Rafferty et al., 2000; Strait et al., 2005, 2007) with parasagittal bending and shearing forces concentrated in the anterior arch. Hylander and Johnson (1997) have shown that during feeding the zygomatic arch in macaques bends in parasagittal and transverse planes and twists around its axis. Many studies using FEA to study feeding biomechanics have noted exceptionally high strains in the zygomatic arch (Strait et al., 2005, 2007, 2009, 2010; Kupczik et al., 2007; Smith et al., 2015a, b; Cox et al., 2013; Dumont et al., 2005; Santana et al., 2010; Tseng, 2009; Wang et al., 2010). Curtis et al., (2011) suggests that these studies may be compromised by a failure to consider the functional role of the temporalis fascia, but the solution proposed by them (modeling the temporalis fascia as a series of applied forces acting along the superior margin of the arch) is not obviously realistic.
Variation in zygomatic arch shape could affect cranial strains in two key ways. First, arch shape could affect local strain patterns within the arch itself. It is reasonable to hypothesize that the precise manner in which morphological variation influences local strains could be predicted by beam theory, insofar as the zygomatic arch is, from a geometrical perspective, arguably the most beam-like structure in the entire cranium. Second, arch shape could affect global strain patterns in the cranium beyond the arch by altering load paths. In other words, shapes that structurally stiffen the arch may increase the fraction of applied anterior temporalis and medial pterygoid loads transmitted thru the arch relative to more structurally compliant shapes, thereby increasing stress (and, consequently, strain) in adjacent non-arch regions.
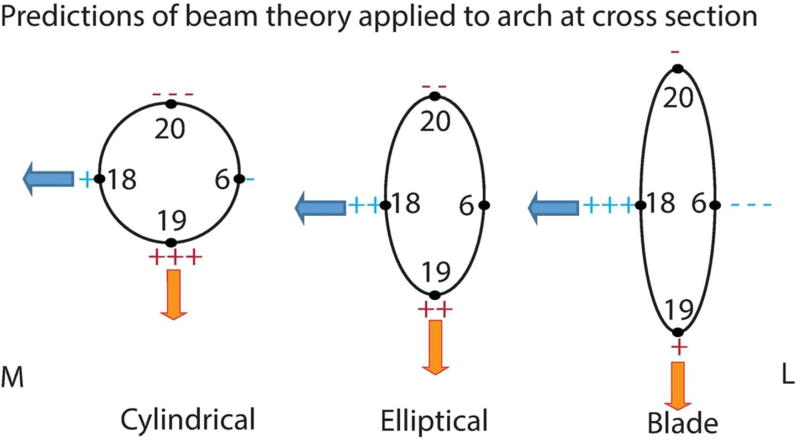
With respect to local strains within the arch, the predictions of beam theory are straightforward. In vivo bone strain data (Hylander and Johnson, 1997; Herring et al., 1996) suggest that the zygomatic arch experiences inferiorly directed bending in the parasagittal plane, as well as torsion in which the inferior margin of the arch is rotated medially. The medially directed component of the masseter muscle force further suggests that the arch might experience mediolateral bending. An arch that is circular in cross section is equally strong under bending in all directions, whereas a blade-like arch (i.e., one that is much taller than it is wide) would be much stronger in parasagittal bending than in mediolateral bending (Witzel et al., 2004). Moreover, if arch cross sectional area was equivalent in the circular and blade-like arches, then additional very specific predictions can be made (Figure 2). At the superior aspect of the arch, minimum principal strain in the circular arch should exhibit greater (negative) magnitude during parasagittal bending than in the blade-like arch. Similarly, under the same bending regime, maximum principal strain at the inferior aspect of the arch should exhibit greater (positive) magnitude in the circular than in the blade-like arch. However, during mediolateral bending (in which the center of the arch is “pulled” medially), an arch with a circular cross section should exhibit lower magnitude maximum principal strain on its medial surface, and higher magnitude minimum principal strain on its lateral surface, than would a blade-like arch.
Figure 2.
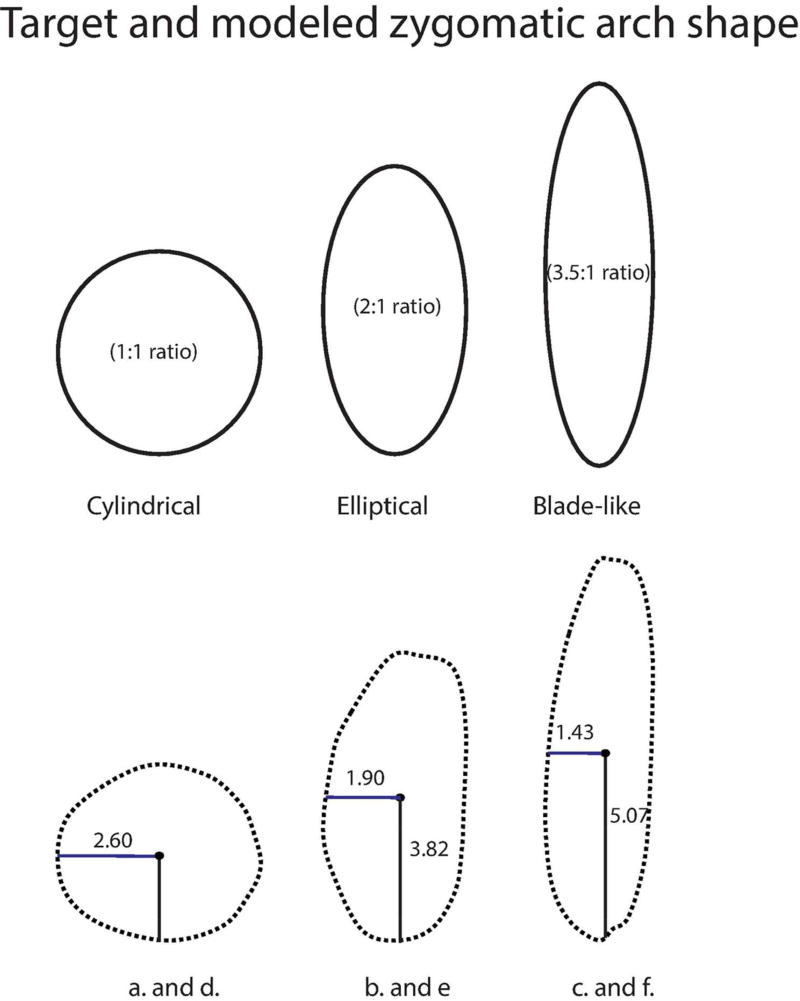
Schematic of theoretical zygomatic arch shape in cross-section. Top shapes represent target shapes and bottom shapes depict outline of achieved shape. Please note target height and width ratios and achieved maximum height and width at mid-arch. Height and width of each model in millimeters. Cylindrical arch refers to models a. and d., Elliptical arch refers to models b. and e, Blade-like arch refers to models c. and f.
These predictions regarding bending can be demonstrated easily using a simple thought experiment. Consider a plank-shaped beam twice as wide as it is tall that is oriented horizontally, fixed at each end, and subjected to an inferiorly directed force pulling on its inferior surface. Compare that scenario to one in which the plank is rotated 90 degrees such that it is “on edge” yet subjected to the same force. Although the cross-sectional area of the beam has remained constant, the distribution of material about the longitudinal axis has changed and the beam has been stiffened against the load by increasing the maximum distance of the loaded surface to the centroid. For example, if the plank has a width that is double its thickness, when horizontally oriented, stresses and strains will be double when compared to the same plank that is vertically oriented. In general, if width w = α t, where t is thickness and α >1, then stresses and strains for a beam that is horizontally oriented will be α times greater than stresses and strains for the same plank when vertically oriented. Deflection of the horizontally oriented plank will be α2 larger than deflection of the vertically oriented plank. Given a constant cross sectional area and identical muscle loading conditions, the beam that deflects the least is structurally the stiffest and most efficient. Therefore, if the zygomatic arch functions as a simple fixed beam that is loaded primarily by inferiorly directed muscle forces, then the blade-like arch should be the most efficient cross sectional shape to resist parasagittal bending. We would expect that an arch with a tall, narrow cross section would experience reduced bending in the sagittal plane but be more susceptible to bending in the transverse plane.
Under torsion, the arch with the greatest polar moment of area should exhibit lower maximum shear strain around the perimeter of its cross section (although this is a coarse prediction). Of course, the predictions listed above pertain to deformation regimes of pure parasagittal bending, pure mediolateral bending, and pure torsion, whereas the arch likely experiences a combination of these (Hylander and Johnson, 1997; Herring et al., 1996; Rafferty et al., 2000). Nonetheless, these predictions provide a general framework for interpreting arch function.
With respect to how arch morphology may affect global strain across the cranium, stiffening the arch may have counter intuitive effects. For example, during static feeding (and biting) the cranium may be viewed as statically determinate structure - minimally constrained to prevent rigid body motion as the food item resists fracture. For a statically determinant structure, reaction forces are determined entirely by system equilibrium principles; the overall stiffness of the structure and the relative stiffnesses of portions of the structure have no effect on the values of reaction forces at the system supports necessary to maintain system equilibrium (assuming deformations are small, i.e. insignificant relative to geometry dimensions (Meriam and Kraige 2012). Thus, the shape of the arch has no effect on how the load generated by the masseter muscle is transmitted to the rest of the cranium. However, portions of the 3D structure might be viewed somewhat simplistically as statically indeterminate ‘subsystems, i.e. consisting of redundant load paths.’ In this view the relative proportion of applied muscle loads carried by portions of the structures will depend on the relative stiffnesses of. these load paths, with stiffer parallel load paths carrying larger fractions of the applied load (Juvinall and Marshek 2012). This explains, for example, why columns carry more of the load of a building than do any walls running between the columns. Thus, if the arch carries any of the load generated by the temporalis and medial pterygoid muscles, and insofar as inferiorly directed muscle forces produce bending or shear in the sagittal plane, then stiffening the arch against parasagittal bending by making it taller could have the effect of increasing these transverse loads carried by the arch due to the applied muscle forces. It turns out that this increase in load will have less of an effect than the increase in the ability of the taller arch to withstand these increased loads, resulting in reduced stresses and strains within the arch itself due to parasagittal bending. However, we might expect elevated strains at the zygomatic roots, because the structurally stiffer arch is transmitting more applied inferiorly-directed muscle load to these adjacent regions which have been unaltered (e.g., Strait et al., 2007). This in turn could influence strains in the rest of the cranium, although not necessarily in a way that is simple to predict (See Supplemental Information for further explanation of the effect of stiffness on redundant load paths
This study explores the biomechanics of zygomatic arch shape using a series of finite element modeling experiments designed to simulate idealized zygomatic arch morphologies. By manipulating the cross sectional shape of a baseline specimen with known strain patterns, it is possible to examine the shape-related mechanical variation mirroring that observed between mammalian species that approximate these theoretical forms. It is important to stress that the arch shapes we examine here are theoretical. It is not our aim to recreate the specific arch morphology of any one species (except in our baseline model of P. troglodytes). Rather, this modeling approach allows us to tightly control for all other variables of craniofacial shape while isolating and modifying zygomatic arch shape at cross section. Thus, if only the arch geometry is modified, we can say that changes between models are due solely to zygomatic arch shape. In other words, is the tall arch actually mechanically advantageous, or rather, does a suite of craniofacial characteristics that is observed to be structurally strong happen to include a tall, narrow arch? Specific predictions of the beam and load path hypotheses are described above, and the corresponding null hypothesis tested here is that zygomatic arch shape has no patterned effect on stress or strain either within the arch or across the facial skeleton.
As described above, shape is expected to have an effect on the apparent structural stiffness of the zygomatic arch, and in turn, an influence on craniofacial strains during feeding. Apparent stiffness (or compliance) of a structure is also affected by material composition. The zygomatic arch is a composite structure made of cortical and trabecular bone, and the relative proportion of each material has been shown to vary along its length. Hylander and Johnson (1997) observed denser bone in the zygomatic root than in the middle of the arch (see also Smith et al., 2015a; Pryor-Smith, 2011). Thus, the apparent stiffness of the arch should be affected by its ratio of cortical to trabecular bone. As a generalization, the arch should be stiffened as the proportion of trabecular bone in its cross-section decreases and the proportion of cortical bone increases (Currey, 2002; Ashman, 1989). An arch with less cortical bone (and more trabecular bone) should be relatively compliant, thereby experiencing higher strains due to masseter muscle contraction, but may transmit less of the applied force from the temporalis and medial pterygoid muscles, thereby reducing stresses in other parts of the face. Alternatively, thick cortical bone would be expected to minimize strains in the arch itself yet perhaps elevate strains in other regions (e.g., Strait et al., 2007). The biomechanical consequences of arch composition were tested by comparing models with arches composed of solid cortical bone to those with composite arches (i.e., the arch contains a deep core of trabecular bone tissue surrounded by cortical bone superficially). This study design allows an assessment of the effect, if any, of the inclusion of trabecular bone on local and global strains.
Here we use finite element analysis to examine the mechanical consequences of variation in zygomatic arch shape and composition while tightly controlling for all other variables of shape and load. Finite element analysis is an engineering technique used to examine how objects of complex geometry and material properties respond to complex loads (Zeinkiewicz et al., 2005). Briefly, finite element models are created from computed tomography (CT) scans of skeletal material using imaging software in which grayscale slices are used to construct volumetric objects. The continuum of an object’s shape is discretized into thousands to millions of finite brick and tetrahedral elements that are connected at nodes. Elements are assigned material properties and forces and constraints are applied to the nodes. A series of simultaneous algebraic differential equations are solved, yielding displacement at the nodes. Nodal displacements are interpolated over element volumes using interpolating polynomial functions to obtain displacement fields. Displacement fields are then differentiated to obtain strains. The resulting strain patterns can then be assessed qualitatively using strain color maps and quantitatively by sampling strain magnitudes and directions at specific locations on the models. The geometry or material properties of the model can then be modified, resulting in controlled modeling experiments in which only one variable is altered at a time.
MATERIALS AND METHODS
Modeling Approach
A pre-existing finite element model of Pan troglodytes served as a baseline for the present study. Smith et al., (2015a) built six finite element models of chimpanzee crania that represented the extremes of morphological variation in the species. These specimens do not represent a random sampling of chimpanzee individuals, but they exhibit notable variation in zygomatic arch shape. Specimen PC2+ (meaning the specimen that loaded most heavily on the positive pole of the second principal component of chimpanzee shape variation) was not chosen for the present study because of PCA results, but rather, because this particular specimen exhibited an intermediate arch morphology among the six specimens sampled in the previous study (chimpanzee arches range from narrowly elliptical to blade-like). PC2+ approximately fit the theoretical blade-like shape (3.5:1 height to breadth ratio). This model was subsequently modified to create new models that were geometrically identical except that one had a more broadly elliptical cross-sectional shape (2:1 height to breadth ratio), while another had a nearly cylindrical shape (1:1 height to breadth ratio). The modifications were created while keeping the cross-sectional area of the arch approximately constant. In order to establish size and shape parameters for the baseline model, zygomatic arch dimensions were measured in surface editing software (i.e., Geomagic) by creating a cut through the arch using a plane perpendicular to its long axis. Measurements were taken mid-arch (approximately at the position of the zygomaticotemporal suture) for all models.
The approximate cross-sectional area of the zygomatic arch in chimpanzee PC2+ is best calculated as an ellipse (albeit a narrow one). The area of an ellipse can be calculated as A = πab, where a corresponds to radius of the height and b corresponding to radius of the breadth of the arch. For PC2+, a = 5.07mm and b = 1.43mm (the arch diameter was measured as 10.14mm and 2.86mm respectively in a Geomagic cross sectional slice). Thus, the cross sectional area of the unmodified chimpanzee (PC2+) zygomatic arch is 22.8mm2. This was used as a target area for all of the modified models. The area of a circle is A= πr2 and a target radius of 2.69mm was calculated for the cylindrical arch. An elliptical arch was constructed using a height to breadth ratio of 2:1, which is similar to that observed in Paranthropus boisei specimen OH5 (Smith et al., 2015). In comparison, the height: breadth ratio in chimpanzee specimen PC2+ is 3.5:1.
Finite Element Model Creation
As described above, the baseline model was selected from a sample of previously published finite element models of Pan troglodytes crania (Smith et al., 2015a). Five modifications of this model were constructed, meaning that a total of six models were examined. These models have cylindrical, elliptical, or blade-like zygomatic arches, and those arches were modeled either as solid cortical bone or as a composite of cortical and trabecular bone mass (Figure 3). Polar moments of inertia for each arch cross section were calculated from formulas assuming idealized elliptical or circular shapes. As a rough estimate of the effect of external geometry on bending resistance in the sagittal and transverse planes, area moment of inertia at cross section is reported for the solid models. These six models are:
Cylindrical, composite zygomatic arch (1:1 height: breadth ratio) with trabecular bone mass included in the arch. Modifications to the arch were made in a stepwise process using 3D editing software (Geomagic Studio) in order to approximate a cylindrical arch cross-section at mid-arch. First, the medial and lateral polygons along the length of the arch were offset by 2.4mm – 3mm. Superficial polygons were then removed by cleaning and sanding the superior and inferior aspects of the arch to render it more beam-like. This resulted in a roughly square arch cross section. A thin line of polygons was further offset (by 1mm) medially and laterally, which had the effect of adding material to these aspects. This process of adding and sanding material was repeated, using the clip plane to monitor cross section until an approximate cylindrical cross section was attained. The arch was then constricted to approximate the target area by negatively offsetting all polygons of the arch. Transitions between the anterior and posterior zygomatic roots and the zygomatic arches were sanded to smooth the transition between elliptical roots and cylindrical arch. Target diameter was 5.38 mm and target area was 22.8mm2. Trabecular diameter, polar moment of inertia at mid-arch were found to be 3.5mm, 67.52 mm4 respectively.
Elliptical composite zygomatic arch (2:1 height: breadth) with trabecular bone mass. Trabecular bone was offset by 0.4mm superiorly and inferiorly, and then sanded. Superior and inferior aspects of the arch were offset by 0.8mm with no influence (i.e., polygons surrounding the selected polygons were not allowed to move with the selection). Medial and lateral elements were offset by −0.2mm, again with no influence. Target height was 7.64mm; target width was 3.8mm. Target area was 22.8mm2. Trabecular bone mass measures 5.44mm and 2.04mm for height and breadth respectively and polar moment of area was calculated, as 85.30 mm4
Blade-like, composite (baseline) zygomatic arch (PC2+; 3.5:1 height: breadth ratio) with trabecular bone mass included in the arch. This model represents an actual chimpanzee specimen examined by Smith et al., (2015a). At mid-arch, the height of the trabecular bone mass is 6.89mm and the breadth is 1.38mm. Polar moment of area is 134.75 mm4
Cylindrical zygomatic arch (1:1 height: breadth ratio), solid (no trabecular bone). External geometry is the same as in Model a. Trabecular bone was assigned material properties of cortical bone. Polar moment of area and area moment of inertia were found to be 82.25. mm4 and 41.13 mm4 respectively.
Elliptical zygomatic arch (2:1 height: breadth), solid (no trabecular bone). Geometry is the same as in Model b, but with trabecular bone assigned the material properties of cortical bone. Polar moment of area = 103.71 mm4. Area moment of inertia is calculated as 55.74 mm4 sagitally and 19.65 mm4 transversely.
Blade-like, solid zygomatic arch PC2+; 3.5:1 height: breadth ratio). Volumes representing trabecular bone in Model c were assigned the material properties of cortical bone. Polar moment of area = 157.91 mm4 Area moment of inertia is calculated as 139.78 mm4 sagittally and 11.10 mm4 transversely.
Figure 3.
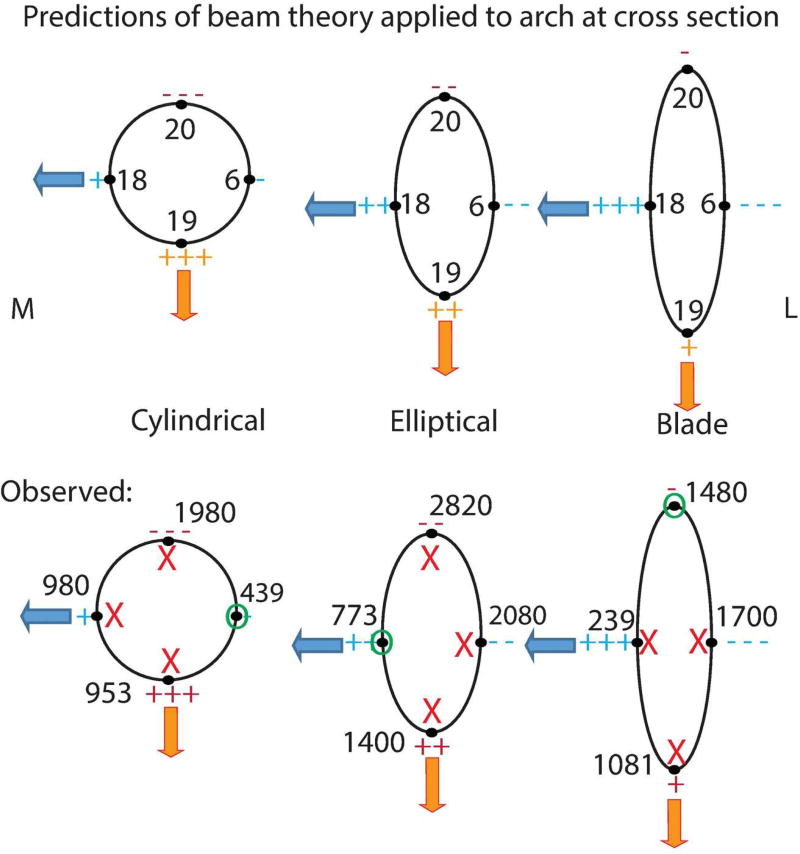
Predictions of beam theory applied to different cross sectional shapes. Numbers correspond to sampling locations. “M” is medial and “L” is lateral. Orange arrows represent parasaggital bending and blue arrows represent mediolateral bending. Tension is represented by “+” and compression is represented by “−“ with +, ++ and +++ (−, −−, and −−−) representing least, intermediate and most tension respectively.
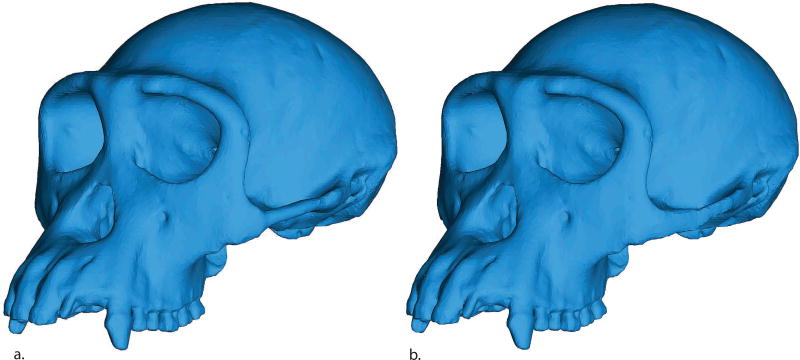
For all modifications, cortical and trabecular bone were offset separately and in steps to control for target shape and size and ensure that deep materials (e.g., trabecular bone) remained embedded. Figure 4 shows the three different zygomatic arch shapes in Models I, II and V.
Figure 4.
Material Properties
All of the models were assigned spatially heterogeneous isotropic material properties of cortical cranial bone using the thermal diffusion method. Using this technique, seed points are assigned from which elastic moduli are smoothly diffused through the cortical bone of the model as heat diffuses through an object (Davis et. al., 2011). Seed point values and locations were based on an average of African ape values (Smith et al., 2015a; Schwartz-Dabney and Dechow, 2002, 2003). Trabecular bone was modeled as a volume and assigned bulk material properties accordingly (E = 0.64 GPa, v = 0.;28; Ashman et al., 1989). In the models (II, IV, VI) in which trabecular bone in the zygomatic arch was treated as cortical bone, the elastic modulus of those volumes was determined by thermal diffusion, as described above.
Muscle Modeling
Bilaterally symmetric muscle forces were modeled using BoneLoad, a program developed to simulate the wrapping of muscles around bony structures. The forces applied to each FEM correspond to the muscles primarily responsible for closing the jaw during a bite and include the anterior temporalis, superficial and deep masseters and the medial pterygoid. When these forces are applied, the effect is to simulate a maximal, static bite (Grosse et al., 2007). Force magnitudes were derived from physiological cross sectional area (PCSA) data, which were obtained from the dissection of a female chimpanzee (Strait et al., 2009). Normally, when comparing models of different morphologies, these data are scaled by 2/3 bone volume to estimate muscle force (Dumont et al., 2009; Strait et al., 2010). This step ensures that size is eliminated as a variable affecting strains. For these experiments however, manipulation of the zygomatic arch had a negligible effect on model volume, so identical muscle forces were applied to each of the FEM’s.
Constraints
All models were constrained to limit movement at the articular eminences of the temporomandibular joints (TMJ) and at a P3 bite point. The left (working side) TMJ was constrained in all directions and the right (balancing side) TMJ was constrained in the vertical and anteroposterior directions. Each model was constrained at a premolar by fixing one node at the center of the occlusal surface of the P3 in the direction of the bite (inferosuperiorly). Constraining the models in this minimal way has the effect of simulating occlusal and mandibular contacts while preventing rigid body motion of the model and allowing reaction forces (bite forces) to be generated at each constraint (Dumont et.al, 2005, 2009; Strait et.al., 2005).
Strain metrics
In order to assess model performance, several types of strain data were collected. Each type of data provides different information regarding the deformation present in the model. Strains are tabulated rather than stresses to facilitate comparisons with experimental bone strain studies, although stresses are used to evaluate our load path hypothesis. All of these strains occur at each material point of the models simultaneously. There are two types of strains—normal strains that stretch or compress the material in a given direction and shear strains that reflect distortion of the material in a given plane. Maximum principal strain is the maximum value of normal strain at a given material point and is tensile (i.e., positive), unless the material is in a state of tri-axial compression. Minimum principal strain is the minimum value of normal strain at the same material point and is compressive (i.e., negative), unless the material is in a state of tri-axial tension. Maximum and minimum principal strains are oriented along principal axes that are orthogonal to each other. Strain mode is simply the absolute value of the ratio of maximum to minimum principal strain (Hylander and Johnson 1997), which describes the degree to which a given material point is primarily in tension, primarily in compression or primarily in shear (when the principal compressive and tensile strains are equal or nearly so). Maximum shear strain is, as the name implies, the maximum value of shear experienced at a given material point and is calculated as maximum minus minimum principal strain. Von Mises strain is a measure of distortional strain, meaning non-isometric deformation (i.e., a solid rubber ball submerged in the ocean experiences uniform compression on its surface as it sinks and remains perfectly spherical; thus, it does not experience any von Mises strain). Von Mises strain corresponds to von Mises stress, which is the metric governing the yielding of ductile materials such as bone (Keyak and Rossi, 2000). Thus, it is the strain metric that is arguably most relevant to bone strength. Strain Energy (SE) is the integral (i.e., volumetric sum) of strain energy density over the volume of the model and is inversely proportional to the overall structural rigidity of the model. Performance decreases as SE increases (i.e., an object is considered to perform better if it deforms less in response to a given load for the same volume of material). Skulls exhibiting lower SE are structurally more rigid than skulls with higher SE. Thus, SE can be used as an indicator or global mechanical performance. Strain energy density (SED) is the area under the stress-strain curve at any given material point and represents the strain energy per unit volume at a material point. Therefore, SED provides information about where strain energy is stored locally in an object (Crandall et al., 2008). Maximum principal strain, minimum principal strain, strain mode, maximum shear strain and von Mises strain can be directly calculated from strain measurements (using strain gages or full-field strain measurement techniques) and thus form the basis of in vivo and ex vivo bone strain studies. Therefore, the use of these strain metrics in the evaluation of FE models allows for the comparison of virtual models.
RESULTS
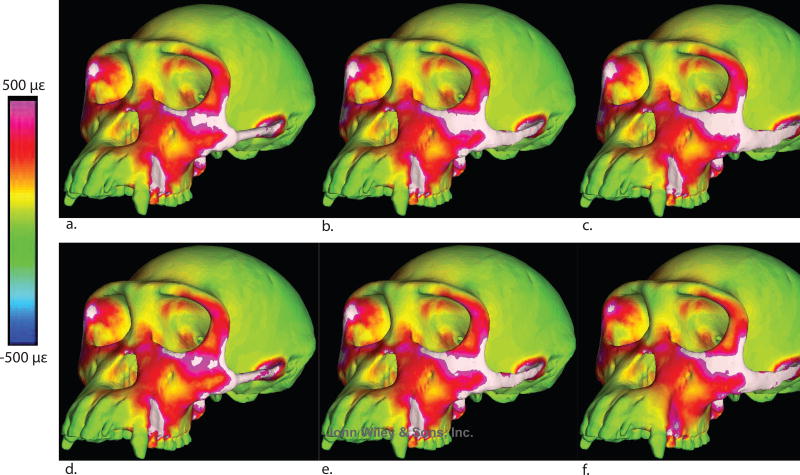
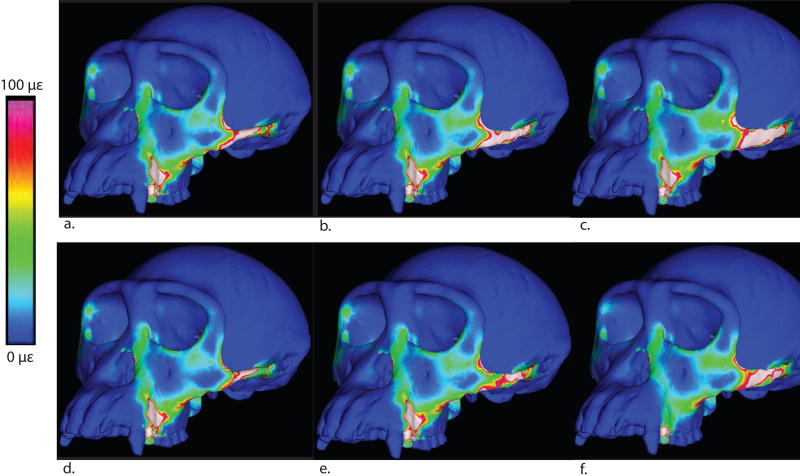
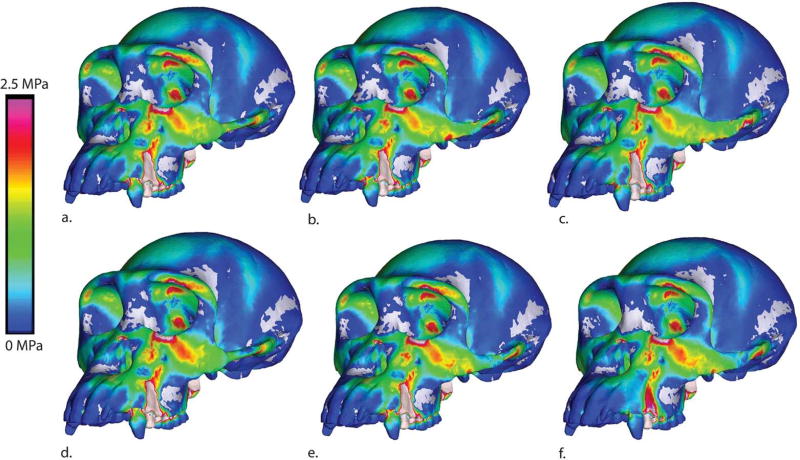
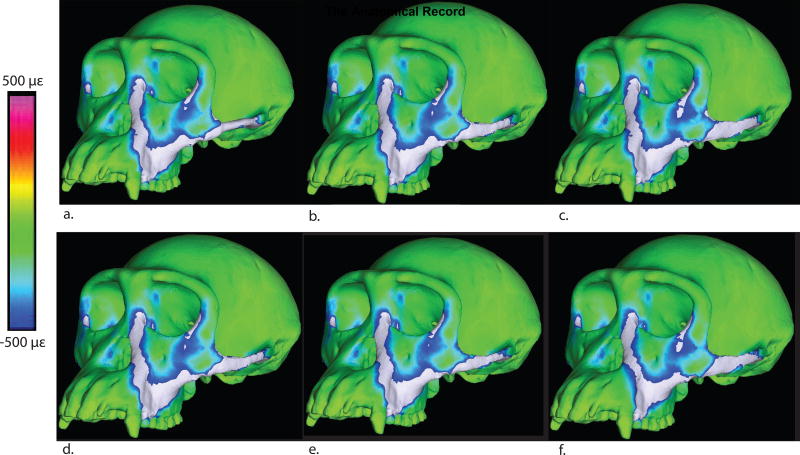
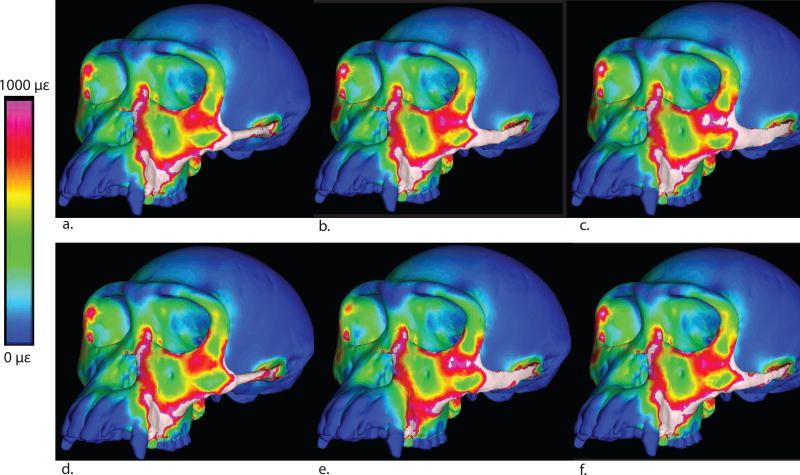
Strain results were compared between the baseline model and the modified forms (with solid vs. composite zygomatic arches) by qualitatively examining the strain patterns using color maps (Figures 5–8) and quantitatively examining global strain energy (Table 1), local strain magnitude (Tables 2, 3, Figure 9) and principal strain directions (Figure 10) at homologous finite elements across models.
Figure 5.
Maximum principal strain color maps for all models. a: Cylindrical trabecular. b: Elliptical trabecular, c: Blade-like trabecular, d: Solid cylindrical, e: Solid elliptical, f: Solid blade-like.
Figure 8.
SED colormaps for all models. a: Cylindrical trabecular. b: Elliptical trabecular, c: Blade-like trabecular, d: Solid cylindrical, e: Solid elliptical, f: Solid blade-like.
Table 1.
Total model Strain Energy (SE)
| Specimen | SE (J) |
|---|---|
| Cylindrical (trabecular) | 8.06×10⁻² |
| Cylindrical (solid) | 7.62×10⁻² |
| Elliptical (trabecular) | 9.65×10⁻² |
| Elliptical (solid) | 9.00×10⁻² |
| Blade-like (trabecular) | 8.99×10⁻² |
| Blade-like (solid) | 7.82×10⁻² |
Table 2.
Strain and strain energy density results sampled from across the skull
| Locationa | Brick number |
Specimen | Max Prin (με) |
Min Prin (με) | Mode | Max shear (με) |
von Mises (με) |
SED (J/mm3) |
|---|---|---|---|---|---|---|---|---|
| 1. Dorsal interorbital | 493611 | Cylindrical (trabecular) | 124 | −40 | −3.08 | 164 | 159 | 0.11 |
|
|
||||||||
| 693957 | Cylindrical (solid) | 135 | −47 | −2.85 | 182 | 172 | 0.13 | |
|
|
||||||||
| 504406 | Elliptical (trabecular) | 135 | −68 | −1.98 | 203 | 183 | 0.13 | |
|
|
||||||||
| 152373 | Elliptical (solid) | 139 | −39 | −3.58 | 178 | 176 | 0.14 | |
|
|
||||||||
| 596515 | Blade (trabecular) | 124 | −48 | −2.60 | 172 | 163 | 0. 11 | |
|
|
||||||||
| 393954 | Blade (solid) | 162 | −78 | −2.07 | 240 | 202 | 0. 20 | |
| 2. Working dorsal orbital | 696240 | Cylindrical (trabecular) | 39 | −50 | −0.78 | 89 | 77 | 0.02 |
|
|
||||||||
| 176063 | Cylindrical (solid) | 23 | −41 | −0.58 | 64 | 56 | 0.01 | |
|
|
||||||||
| 409451 | Elliptical (trabecular) | 43 | −53 | −0.81 | 96 | 83 | 0.03 | |
|
|
||||||||
| 409451 | Elliptical (solid) | 43 | −53 | −0.81 | 96 | 83 | 0.03 | |
|
|
||||||||
| 258064 | Blade (trabecular) | 83 | −88 | −0.95 | 170 | 148 | 0. 08 | |
|
|
||||||||
| 788401 | Blade (solid) | 13 | −44 | −0.52 | 57 | 49 | 0. 02 | |
|
| ||||||||
| 3. Balancing dorsal orbital | 420128 | Cylindrical (trabecular) | 161 | −120 | −1.34 | 281 | 247 | 0.22 |
|
|
||||||||
| 644014 | Cylindrical (solid) | 128 | −111 | −1.15 | 239 | 208 | 0.15 | |
|
|
||||||||
| 346810 | Elliptical (trabecular) | 142 | −118 | −1.20 | 260 | 226 | 0.18 | |
|
|
||||||||
| 424297 | Elliptical (solid) | 183 | −129 | −1.42 | 312 | 276 | 0.27 | |
|
|
||||||||
| 243813 | Blade (trabecular) | 187 | −95 | −1.97 | 282 | 261 | 0. 25 | |
|
|
||||||||
| 560868 | Blade (solid) | 126 | −77 | −1.64 | 203 | 183 | 0. 12 | |
| 4. Working postorbital bar | 669023 | Cylindrical (trabecular) | 279 | −431 | −0.65 | 710 | 626 | 1.46 |
|
|
||||||||
| 738453 | Cylindrical (solid) | 287 | −356 | −0.80 | 646 | 562 | 1.13 | |
|
|
||||||||
| 447272 | Elliptical (trabecular) | 304 | −439 | −0.69 | 743 | 652 | 1.57 | |
|
|
||||||||
| 447272 | Elliptical (solid) | 304 | −439 | −0.69 | 743 | 652 | 1.57 | |
|
|
||||||||
| 606890 | Blade (trabecular) | 346 | −382 | −0.91 | 728 | 631 | 1.41 | |
|
|
||||||||
| 250394 | Blade (solid) | 177 | −302 | −0.59 | 479 | 423 | 0.70 | |
|
| ||||||||
| 5. Balancing postorbital bar | 196259 | Cylindrical (trabecular) | 476 | −337 | −1.41 | 813 | 717 | 1.85 |
|
|
||||||||
| 569094 | Cylindrical (solid) | 651 | −400 | −1.63 | 1051 | 932 | 3.27 | |
|
|
||||||||
| 37178 | Elliptical (trabecular) | 609 | −399 | −1.53 | 1008 | 900 | 2.92 | |
|
|
||||||||
| 510221 | Elliptical (solid) | 537 | −333 | −1.61 | 870 | 768 | 2.25 | |
|
|
||||||||
| 690565 | Blade (trabecular) | 665 | −376 | −1.77 | 1021 | 947 | 3.30 | |
|
|
||||||||
| 139345 | Blade (solid) | 461 | −390 | −1.28 | 821 | 726 | 1.86 | |
| 6. Working mid-zygo arch | 335070 | Cylindrical (trabecular) | 1250 | −1670 | −0.75 | 2920 | 2560 | 23.50 |
|
|
||||||||
| 337157 | Cylindrical (solid) | 238 | −439 | −0.54 | 677 | 651 | 1.50 | |
|
|
||||||||
| 295709 | Elliptical (trabecular) | 1490 | −1070 | −1.39 | 2560 | 2280 | 18.40 | |
|
|
||||||||
| 274459 | Elliptical (solid) | 709 | −2080 | −0.34 | 2789 | 2700 | 30.40 | |
|
|
||||||||
| 612277 | Blade (trabecular) | 1710 | −1049 | −1.63 | 2759 | 2495 | 22.49 | |
|
|
||||||||
| 368829 | Blade (solid) | 1042 | −1700 | −0.61 | 2742 | 2457 | 22.02 | |
|
| ||||||||
| 7. Balancing mid-zygo arch | 646697 | Cylindrical (trabecular) | 383 | −1080 | −0.35 | 1463 | 1320 | 9.03 |
|
|
||||||||
| 646697 | Cylindrical (solid) | 271 | −853 | −0.32 | 1124 | 1020 | 5.76 | |
|
|
||||||||
| 69285 | Elliptical (trabecular) | 757 | −2050 | −0.37 | 2807 | 2640 | 30.00 | |
|
|
||||||||
| 640775 | Elliptical (solid) | 1160 | −1950 | −0.59 | 3110 | 2810 | 28.28 | |
|
|
||||||||
| 816090 | Blade (trabecular) | 1912 | −1227 | −1.56 | 3139 | 2793 | 28.54 | |
|
|
||||||||
| 294839 | Blade (solid) | 328 | −703 | −0.47 | 1031 | 943 | 3.57 | |
| 8. Working zygo root | 633588 | Cylindrical (trabecular) | 313 | −804 | −0.39 | 1117 | 1050 | 4.58 |
|
|
||||||||
| 509869 | Cylindrical (solid) | 313 | −845 | −0.37 | 1158 | 1090 | 5.07 | |
|
|
||||||||
| 513977 | Elliptical (trabecular) | 342 | −785 | −0.44 | 1127 | 1040 | 4.45 | |
|
|
||||||||
| 195447 | Elliptical (solid) | 313 | −971 | −0.32 | 1284 | 1240 | 6.68 | |
|
|
||||||||
| 554378 | Blade (trabecular) | 316 | −835 | −0.38 | 1152 | 1137 | 4.92 | |
|
|
||||||||
| 736149 | Blade (solid) | 397 | −962 | −0.41 | 1359 | 1261 | 6.62 | |
|
| ||||||||
| 9. Balancing zygo root | 366888 | Cylindrical (trabecular) | 105 | −169 | −0.62 | 274 | 242 | 0.22 |
|
|
||||||||
| 187881 | Cylindrical (solid) | 94 | −201 | −0.47 | 295 | 277 | 0.29 | |
|
|
||||||||
| 438465 | Elliptical (trabecular) | 111 | −168 | −0.66 | 279 | 245 | 0.23 | |
|
|
||||||||
| 141386 | Elliptical (solid) | 102 | −167 | −0.61 | 269 | 247 | 0.22 | |
|
|
||||||||
| 186272 | Blade (trabecular) | 232 | −275 | −0.84 | 506 | 440 | 0. 69 | |
|
|
||||||||
| 725131 | Blade (solid) | 174 | −164 | −1.06 | 338 | 292 | 0. 30 | |
| 10. Working infraorbital | 256599 | Cylindrical (trabecular) | 329 | −174 | −1.89 | 503 | 443 | 0.84 |
|
|
||||||||
| 503257 | Cylindrical (solid) | 346 | −179 | −1.93 | 525 | 446 | 0.91 | |
|
|
||||||||
| 596563 | Elliptical (trabecular) | 411 | −170 | −2.42 | 581 | 535 | 1.22 | |
|
|
||||||||
| 338576 | Elliptical (solid) | 310 | −135 | −2.30 | 445 | 409 | 0.69 | |
|
|
||||||||
| 234992 | Blade (trabecular) | 572 | −423 | −1.35 | 994 | 877 | 2.74 | |
|
|
||||||||
| 434782 | Blade (solid) | 258 | −151 | −1.71 | 409 | 365 | 0. 51 | |
|
| ||||||||
| 11. Balancing infraorbital | 152573 | Cylindrical (trabecular) | 242 | −128 | −1.89 | 370 | 335 | 0.43 |
|
|
||||||||
| 517654 | Cylindrical (solid) | 318 | −221 | −1.44 | 539 | 477 | 0.82 | |
|
|
||||||||
| 262823 | Elliptical (trabecular) | 363 | −133 | −2.73 | 496 | 482 | 0.92 | |
|
|
||||||||
| 327865 | Elliptical (solid) | 341 | −155 | −2.20 | 469 | 458 | 0.84 | |
|
|
||||||||
| 786274 | Blade (trabecular) | 361 | −242 | −1.38 | 623 | 553 | 1.09 | |
|
|
||||||||
| 402678 | Blade (solid) | 236 | −161 | −1.47 | 397 | 356 | 0.45 | |
| 12. Working nasal margin | 330308 | Cylindrical (trabecular) | 303 | −809 | −0.037 | 1112 | 1050 | 4.63 |
|
|
||||||||
| 577053 | Cylindrical (solid) | 236 | −683 | −0.35 | 918 | 902 | 3.26 | |
|
|
||||||||
| 310136 | Elliptical (trabecular) | 268 | −773 | −0.35 | 1041 | 1010 | 4.19 | |
|
|
||||||||
| 458735 | Elliptical (solid) | 259 | −700 | −0.37 | 959 | 909 | 3.47 | |
|
|
||||||||
| 333269 | Blade (trabecular) | 207 | −484 | −0.43 | 691 | 639 | 1.68 | |
|
|
||||||||
| 833421 | Blade (solid) | 218 | −698 | −0.31 | 916 | 903 | 3.42 | |
|
| ||||||||
| 13. Working zygo body | 614326 | Cylindrical (trabecular) | 604 | −428 | −1.41 | 1032 | 920 | 3.00 |
|
|
||||||||
| 164876 | Cylindrical (solid) | 553 | −433 | −1.28 | 986 | 877 | 2.72 | |
|
|
||||||||
| 382159 | Elliptical (trabecular) | 697 | −456 | −1.53 | 1153 | 1020 | 3.83 | |
|
|
||||||||
| 641689 | Elliptical (solid) | 682 | −548 | −1.24 | 1230 | 1070 | 4.11 | |
|
|
||||||||
| 700397 | Blade (trabecular) | 751 | −593 | 1.27 | 1344 | 1174 | 4.91 | |
|
|
||||||||
| 224165 | Blade (solid) | 719 | −483 | −1.49 | 1202 | 1070 | 4.12 | |
| 14. Balancing zygo body | 732637 | Cylindrical (trabecular) | 560 | −214 | −2.62 | 774 | 734 | 2.21 |
|
|
||||||||
| 732637 | Cylindrical (solid) | 519 | −204 | −2.54 | 724 | 686 | 1.90 | |
|
|
||||||||
| 327116 | Elliptical (trabecular) | 740 | −333 | −2.22 | 1073 | 1040 | 3.97 | |
|
|
||||||||
| 70364 | Elliptical (solid) | 635 | −354 | −1.79 | 989 | 915 | 3.03 | |
|
|
||||||||
| 491454 | Blade (trabecular) | 570 | −413 | 1.38 | 983 | 856 | 2.71 | |
|
|
||||||||
| 432400 | Blade (solid) | 600 | −236 | −2.54 | 836 | 810 | 2.53 | |
Locations numbered as in Fig. 9.
Table 3.
Strain and strain energy density results sampled from the zygomatic arch
| Locationa | Brick number |
Specimen | Max Prin (µε) |
Min Prin (µε) | Mode | Max shear (µε) |
von Mises (µε) |
SED (J/mm3) |
|---|---|---|---|---|---|---|---|---|
| 16. Working posterior arch | 244482 | Cylindrical (trabecular) | 767 | −828 | −0.93 | 1595 | 1380 | 6.77 |
|
|
||||||||
| 304668 | Cylindrical (solid) | 741 | −914 | −0.81 | 1655 | 1440 | 7.41 | |
|
|
||||||||
| 241163 | Elliptical (trabecular) | 1070 | −862 | −1.24 | 1932 | 1690 | 10.2 | |
|
|
||||||||
| 64687 | Elliptical (solid) | 594 | −505 | −1.18 | 1099 | 953 | 3.25 | |
|
|
||||||||
| 767240 | Blade (trabecular) | 953 | −720 | −1.32 | 1673 | 1461 | 7.72 | |
|
|
||||||||
| 513587 | Blade (solid) | 832 | −620 | −1.34 | 1452 | 1287 | 5.86 | |
| 17. Balancing posterior arch | 636454 | Cylindrical(trabecular) | 955 | −737 | −1.30 | 1692 | 1480 | 7.85 |
|
|
||||||||
| 631571 | Cylindrical (solid) | 457 | −295 | −1.55 | 752 | 668 | 1.64 | |
|
|
||||||||
| 63862 | Elliptical (trabecular) | 791 | −335 | −2.36 | 1126 | 1070 | 4.43 | |
|
|
||||||||
| 524469 | Elliptical (solid) | 612 | −535 | −1.14 | 1147 | 999 | 3.53 | |
|
|
||||||||
| 408277 | Blade (trabecular) | 150 | −180 | −0.83 | 330 | 287 | 0.31 | |
|
|
||||||||
| 366883 | Blade (solid) | 301 | −500 | −0.60 | 801 | 713 | 1.89 | |
|
| ||||||||
| 18. Working mid-arch, medial | 482243 | Cylindrical (trabecular) | 1060 | −1080 | −0.98 | 2140 | 1860 | 12.50 |
|
|
||||||||
| 693988 | Cylindrical (solid) | 980 | −530 | −1.85 | 1511 | 1320 | 7.92 | |
|
|
||||||||
| 584296 | Elliptical (trabecular) | 467 | −330 | −1.42 | 797 | 691 | 1.97 | |
|
|
||||||||
| 208449 | Elliptical (solid) | 773 | −325 | −2.38 | 1098 | 1020 | 4.29 | |
|
|
||||||||
| 548898 | Blade (trabecular) | 816 | −1010 | −0.81 | 1826 | 1659 | 10.00 | |
|
|
||||||||
| 806303 | Blade (solid) | 239 | −270 | −0.89 | 509 | 438 | 0.68 | |
| 19. Working mid-arch, inferior | 611011 | Cylindrical (trabecular) | 1030 | −1250 | −0.82 | 2280 | 1990 | 14.10 |
|
|
||||||||
| 348369 | Cylindrical (solid) | 953 | −433 | −2.20 | 1386 | 1230 | 7.06 | |
|
|
||||||||
| 503585 | Elliptical (trabecular) | 1300 | −611 | −2.13 | 1911 | 1750 | 12.30 | |
|
|
||||||||
| 477838 | Elliptical (solid) | 1400 | −669 | −2.09 | 2069 | 1990 | 14.30 | |
|
|
||||||||
| 149608 | Blade (trabecular) | 762 | −430 | −1.77 | 1192 | 1062 | 4.38 | |
|
|
||||||||
| 320172 | Blade (solid) | 1081 | −440 | −2.46 | 1521 | 1508 | 8.37 | |
|
| ||||||||
| 20. Working mid-arch, superior | 770806 | Cylindrical (trabecular) | 826 | −2200 | −0.38 | 3026 | 2790 | 35.20 |
|
|
||||||||
| 205441 | Cylindrical (solid) | 634 | −1980 | −0.32 | 2614 | 2490 | 28.30 | |
|
|
||||||||
| 259088 | Elliptical (trabecular) | 3280 | −3850 | −0.85 | 7130 | 6320 | 94.00 | |
|
|
||||||||
| 187431 | Elliptical (solid) | 898 | −2820 | −0.32 | 3718 | 3620 | 56.10 | |
|
|
||||||||
| 742928 | Blade (trabecular) | 1027 | −3530 | −0.29 | 4557 | 4444 | 88.30 | |
|
|
||||||||
| 459283 | Blade (solid) | 532 | −1480 | −0.36 | 2012 | 1983 | 15.30 | |
| 21. Working zygomatic/postorbital jct | 283868 | Cylindrical (trabecular) | 677 | −223 | −3.04 | 900 | 818 | 3.57 |
|
|
||||||||
| 665116 | Cylindrical (solid) | 623 | −283 | −2.20 | 906 | 838 | 2.78 | |
|
|
||||||||
| 413649 | Elliptical (trabecular) | 914 | −392 | −2.33 | 1306 | 1210 | 5.98 | |
|
|
||||||||
| 48966 | Elliptical (solid) | 901 | −354 | −2.55 | 1255 | 1210 | 5.71 | |
|
|
||||||||
| 666940 | Blade (trabecular) | 1115 | −500 | −2.23 | 1615 | 1536 | 8.88 | |
|
|
||||||||
| 784448 | Blade (solid) | 882 | −380 | −2.32 | 1262 | 1170 | 5.56 | |
|
| ||||||||
| 22. Balancing zygomatic/postorbital jct | 712484 | Cylindrical (trabecular) | 1220 | −584 | −2.09 | 1804 | 1640 | 10.90 |
|
|
||||||||
| 712484 | Cylindrical (solid) | 874 | −386 | −2.26 | 1260 | 1180 | 5.45 | |
|
|
||||||||
| 266335 | Elliptical (trabecular) | 1990 | −726 | −2.74 | 2716 | 2580 | 28.20 | |
|
|
||||||||
| 266335 | Elliptical (solid) | 1670 | −610 | −2.74 | 2280 | 2160 | 19.90 | |
|
|
||||||||
| 418433 | Blade (trabecular) | 1238 | −470 | −2.63 | 1708 | 1579 | 11.10 | |
|
|
||||||||
| 507612 | Blade (solid) | 699 | −303 | −2.31 | 1003 | 910 | 3.60 | |
Locations numbered as in Fig. 9.
Figure 9.
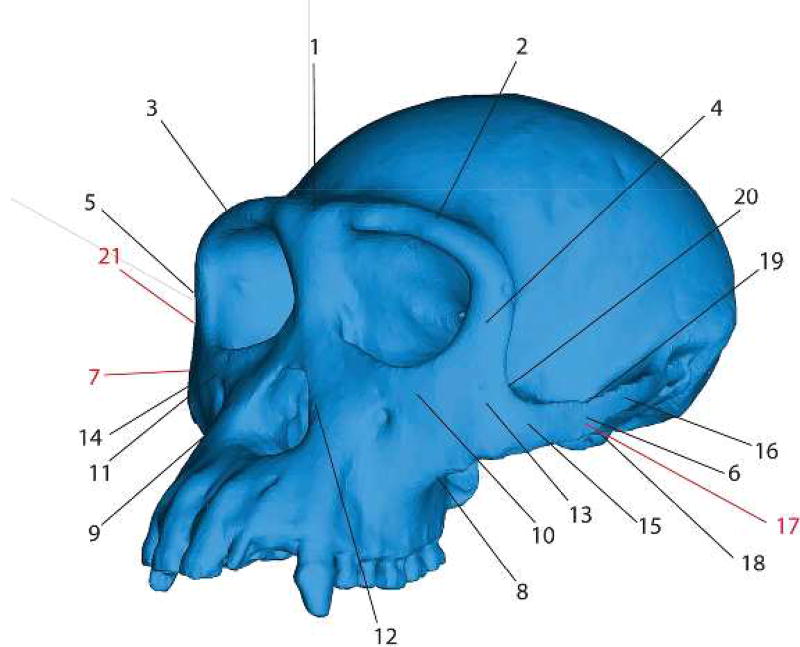
Key to regions where strains were sampled in finite element models. 1 = Dorsal interorbital. 2 = Working side dorsal orbital. 3 = Balancing side dorsal orbital. 4 = Working side postorbital bar. 5 = Balancing side postorbital bar. 6 = Working side zygomatic arch. 7 = Balancing side zygomatic arch. 8 = Working side zygomatic root. 9 = Balancing size zygomatic root. 10 = Working side infraorbital. 11 = Balancing side infraorbital. 12 = Working side nasal margin. 13= Working zygomatic body. 14= Balancing zygomatic body. 15= Working side anterior zygomatic arch. 16= Working side posterior zygomatic arch. 17= Working side zygomatic arch (mid-arch, medial aspect). 18= Working side inferior margin of zygomatic arch (mid-arch). 19= Working side superior margin of zygomatic arch (mid-arch). 20= Working side zygomatic-postorbital junction. 21= Balancing side zygomatic-postorbital junction. Red indicates that the point is not visible in this view.
Figure 10.
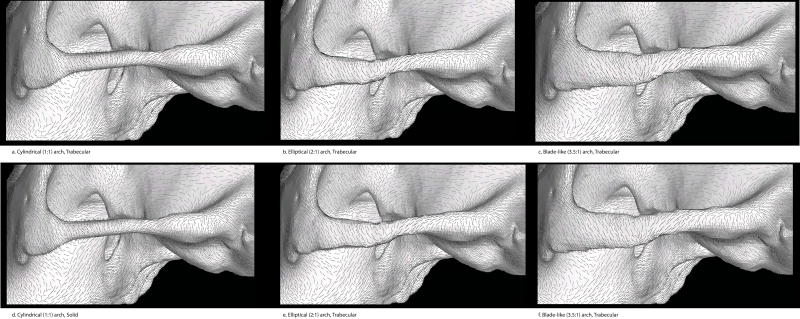
Strain directions for all models. in lateral view (working side). a: Cylindrical trabecular. b: Elliptical trabecular, c: Blade-like trabecular, d: Cylindrical solid, e: Elliptical solid, f: Blade-like solid
Global strain
Overall, global strain energy is the lowest in the model with solid, cylindrical arches and the highest in the model with elliptical trabecular composite arches. The effect of arch shape on global SE is greater than the effect of arch material (See Table 1). Models with the same arch material properties (i.e., either solid or composite arches), cylindrical arches consistently have the lowest SE while the models with the highest SE are those with elliptical arches. Cylindrical arches store 16.5% (for solid arches) to 18.1% (for composite arches) less SE than those with elliptical arches. Models with blade-like arches have intermediate SE (10% higher SE for blade-like composite compared to cylindrical composite but only 2.6% higher when comparing solid blade and cylindrical models). For all shapes, models that include trabecular bone have higher SE than models with solid arches, meaning that the models with solid arches are more structurally rigid than those containing trabecular bone. This effect is least pronounced in the cylindrical models, where solid arches offer a modest 5.5% decrease in SE, and most pronounced in the blade-like models (where solid cortical bone decreases SE by 13% relative to those containing trabecular bone). For the elliptical models, having solid cortical bone arches decreases global SE by 6.7%.
Local strain (composite)
With regards to local strains, in models with composite arches, maximum principal strains at the superior border of the arch (location 20) are highest in the model with elliptical arches (3280 με) and lowest in the model with cylindrical arches (826 με), while blade-like arches are intermediate (1027 με). Minimum principal strains follow the same pattern across different arch shapes at this location, with the highest (negative) principal strains recorded in the elliptical model (−3850 με) and lowest in the cylindrical model (−2200 με). The blade-like model is intermediate (−3530 με). Maximum shear strain is highest in the model with elliptical arches (7130 με), lowest in the cylindrical model (3026) and intermediate in the model with blade-like arches (4557 με).
At the inferior border of the arch (location 19), maximum principal strains are the highest in the elliptical model (1300 με), lowest in the blade-like (765 με) model and intermediate in the cylindrical model (1030 με). Minimum principal strains are highest in the cylindrical model (−1250 με), lowest in the blade-like model (−430) and intermediate in the elliptical model (−611 με). Maximum shear strain is highest in the cylindrical model (2280), lowest in the blade-like model (1192 με) and intermediate in the elliptical model (1911).
At the medial aspect of the arch (location 18), maximum principal strain is highest in the cylindrical model (1060 με), lowest in the elliptical arch (467 με) and intermediate in the blade-like arch (816 με). Minimum principal strains at this location are highest in the cylindrical model (−1080 με) lowest in the elliptical model (−330 με) and intermediate in the blade-like model (−1010 με). Maximum shear strain is highest in the model with cylindrical arches (2140 με), lowest in the elliptical model (797 με) and intermediate in the model with blade-like arches (1826 με).
At the lateral aspect of the arch (location 6), maximum principal strains are highest in the blade-like arch (1710 με), lowest in the cylindrical arch (1250 με) and intermediate for the elliptical arch (1490 με). The pattern is reversed for minimum principal strains. The cylindrical model has the highest minimum principal strains (−1670 με), the blade-like arch has the lowest (−1049 με) and the elliptical is intermediate (−1070 με). Maximum shear strain is highest in the cylindrical model (2920 με), lowest in the elliptical model (2560 με) and intermediate in the blade-like model (2759 με).
Local strain (solid)
The models with solid arches do not consistently conform to the same regional pattern of relative principal strain as the composite arches.
At the superior location (point 20) maximum principal strain is highest in the elliptical model (898), lowest in the blade-like model (532 με) and intermediate for the cylindrical model (634 με). Minimum principal strains are lowest in the blade-like model (−1480 με), highest in the elliptical model (−2820) and intermediate in the cylindrical model (−1980 με). At this location, maximum shear strain is highest in the model with elliptical arches (3718 με), lowest in the model with cylindrical arches (2614 με) and intermediate in the model with blade-like arches (2012 με).
At the inferior border of the arch (location 19), maximum principal strains are the highest in the elliptical model (1400 με), lowest in the cylindrical (1030 με) and intermediate in blade-like model). Minimum principal strains are highest in the elliptical (−669 με), lowest in the blade-like model (−430 με), although the cylindrical solid is only slightly elevated at −433 με. Maximum shear strain is highest in the model with elliptical arches (2069 με), lowest in the model with cylindrical arches (1386) and intermediate in model with blade-like arches (1521 με).
At the medial aspect of the arch (location 18), maximum principal strain is highest in the cylindrical model (980 με), lowest in the blade-like model (239 με) and intermediate in the elliptical model (773 με). Minimum principal strains are also highest in the cylindrical model (−580 με), lowest in the blade-like model (−270 με) and intermediate in the elliptical model (−325 με). Maximum shear strain is highest in the model with cylindrical arches (1511 με), lowest in the model with blade-like arches (509 με) and intermediate in model with elliptical arches (1098).
At the lateral aspect of the arch (location 6), maximum principal strains are highest in the blade-like model (1042 με), lowest in the cylindrical model (238 με) and intermediate in the elliptical model (709). Minimum principal strain is highest in the elliptical model (−2080 με), lowest in the cylindrical model (−439 με) and intermediate in the blade-like model (−1700 με). Maximum shear strain is highest in the model with elliptical arches (2798 με), lowest in the model with cylindrical arches (677 με) and intermediate in model with blade-like arches (2742 με).
The orientation of maximum principal strains in the working side zygomatic arch can be seen in Figure 10 for each of the models during premolar bites (see SI for enlarged view). Vectors directions are similar in all models and nearly identical in models with and without trabecular bone, given the same morphology. In all models, strains of the anterior arch are oriented inferoposteriorly (superoanteriorly) and shift to an inferoanterior inclination (superoposterior) about mid arch. In the cylindrical model, this shift occurs slightly more anteriorly than in the other models. Strains in the posterior arch and root are generally oriented superoinferiorly.
DISCUSSION
Overall, very few consistent patterns emerge from these strain data. It is evident that blade-like arches are associated with elevated magnitudes of strain and strain energy density at the junction of the postorbital bar and zygomatic body. This is undoubtedly because this shape structurally stiffens the arch as it is bent in the parasagittal plane, resulting in, especially, a high band of tensile strain running from the inferior margin of the working side orbit towards the working side zygomatic arch. However, strains in the arch itself are not consistently lower in blade-like arches compared to elliptical or cylindrical arches (Table 2, Figure 9). Some local effects of arch shape are pronounced. For example, at the working side posterior zygomatic arch (Table 2, Figure 9), the blade-like composite model experiences the lowest von Mises strain (287 με) while the cylindrical composite model experiences the highest (1,480 με).
Furthermore, there is not an obvious pattern with respect to the effect of arch composition of strain patterns. There are some cranial regions in which the conversion of trabecular to cortical bone in the arch has a dramatic effect on strain magnitudes, and this effect is most frequently expressed in models with blade-like arches (Tables 2, 3). One pattern that seems weakly but consistently expressed is that tensile and von Mises strain magnitudes in the same band running from the inferior orbital margin to the zygomatic arch are slightly lower in models with solid arches than those with composite arches, regardless of arch shape.
With regards to local effects, we predicted that, changing the apparent stiffness of the zygomatic arch would have the effect of reducing parasagittal bending within the arch and result in lower local strains. Apparent stiffness of the arch was modified in two ways: by changing its shape and by changing its material composition. When holding shape constant, arches of solid cortical bone should be structurally stiffer than those with a core of trabecular bone. Although we observed lower global SE in all models with solid cortical arches, for a given shape, possessing solid cortical arches does not lead to reduced strains relative to those experienced by composite arches. For example, on the working side at mid-arch, von Mises strain is 118% lower in the cylindrical solid arch (651 με) than the cylindrical composite arch (2280 με) but 17% higher in the elliptical solid arch (2700 με) than the elliptical composite arch (2495 με) For the blade-like model, von Mises strains are nearly identical, although slightly lower for the solid arches (2457 με when solid and 2495 με in composite, a difference of 1.5%). Further posterior along the arch, the cylindrical solid arch is more highly strained than the composite arch (4.25% with 1380 με and 1440 με respectively) while the elliptical and blade-like solid arches experiences lower strains relative to their respective composite arch (von Mises strains are 56% lower in elliptical solid arch and 12.67% lower in blade-like solid arch). In other words, possessing a solid cortical bone arch neither consistently reduces nor elevates local strains within the zygomatic arch.
Furthermore, according to beam theory, we predicted the relative performance of each cross-sectional form (see Figure 3). Although some of the strain magnitudes at points on the perimeter of the arch (mid-arch) conform to the predictions of beam theory with regards to relative strain magnitudes, a straightforward pattern fails to emerge (See Figure 11). For example, beam theory predicts that the tall arch should experience the lowest minimum principal strains at its superior aspect and the lowest maximum principal strains its inferior aspect, and highest relative maximum principal strains at its medial aspect and highest minimum principal strains at its lateral aspects. We did not find this to be precisely true. Rather, we observed that although the tall arch experiences the lowest minimum principal strains superiorly relative to other forms, as predicted, the cylindrical arch experiences the lowest minimum principal strains inferiorly. Furthermore, the medial aspect of the tall arch actually experiences the lowest maximum principal strains relative to other forms and laterally, minimum principal strains are intermediate relative to the other forms. These results suggest that the tall arch is neither most efficient at resisting parasagittal bending nor least efficient at resisting mediolateral bending.
Figure 11.
Predictions of beam theory for different cross sectional shapes compared to strain results measured in FEMs. Top row depicts predictions (as in Figure 3) and bottom row includes strain results in microstrain (either maximum or minimum principal strain). Numbers in top illustrations correspond to sampling locations. “M” is medial and “L” is lateral. Orange arrows represent parasaggital bending and blue arrows represent mediolateral bending. Tension is represented by “+” and compression is represented by “-“ with +, ++ and +++ (−, −−, and −−−) representing least, intermediate and most tension respectively. Bottom row: strains are in microstrain. Red "X' indicates that strains at this location do not match predictions of beam theory. Green "O" indicates that strains at this location do match predictions of beam theory.
With regards to torsion, beam theory predicts that the shapes with the greatest polar moment of area should exhibit the lowest shear strains (and conversely, shapes with the lowest polar moment of area should have the highest shear strains). Only the cylindrical composite model, the model with the lowest polar moment of inertia, meets the predictions of beam theory in torsion (Table 4) with most points recording the highest relative maximum shear strain. None of the other models reveal a consistent relationship between relative strain magnitude and polar moment of inertia.
Table 4.
Polar moment of inertia (Jo) and maximum shear strain at mid-arch
| Specimen | Polar moment of inertia (Jo) (mm4) |
Location1 | Maximum shear strain (µε) |
|---|---|---|---|
|
| |||
| Cylindrical (trabecular) | 29.27 | 6 | 29202 |
|
|
|||
| 18 | 21402 | ||
|
|
|||
| 19 | 22802 | ||
|
|
|||
| 20 | 3026 | ||
|
| |||
| Cylindrical (solid) | 35.90 | 6 | 677 |
|
|
|||
| 18 | 15112 | ||
|
|
|||
| 19 | 1386 | ||
|
|
|||
| 20 | 2614 | ||
|
| |||
| Elliptical (trabecular) | 85.30 | 6 | 2560 |
|
|
|||
| 18 | 797 | ||
|
|
|||
| 19 | 19112 | ||
|
|
|||
| 20 | 7130 | ||
|
| |||
| Elliptical (solid) | 103.71 | 6 | 2789 |
|
|
|||
| 18 | 10982 | ||
|
|
|||
| 19 | 2069 | ||
|
|
|||
| 20 | 3718 | ||
|
| |||
| Blade-like (trabecular) | 157.91 | 6 | 2759 |
|
|
|||
| 18 | 1826 | ||
|
|
|||
| 19 | 11922 | ||
|
|
|||
| 20 | 4557 | ||
|
| |||
| Blade-like (solid) | 134.75 | 6 | 2742 |
|
|
|||
| 18 | 5092 | ||
|
|
|||
| 19 | 1521 | ||
|
|
|||
| 20 | 20122 | ||
Locations as in Fig. 9
Indicates that this location follows prediction of beam theory with regards to torsion (i.e., arch with highest Jo has the lowest maximum shear strain).
With regards to global strains, we reasoned that if the arch also serves as a parallel load path for forces generated by the contraction of the temporalis muscle, one would expect a transmission of forces (again, causing parasagittal bending) between the anterior and posterior zygomatic roots. An increase in parasagittal bending loads should lead to elevated strains at the zygomatic roots. In contrast, because cylindrical beams are equally strong under bending in all directions, we might expected to see a reduction in strains at the zygomatic roots if the arch is more cylindrical. This pattern was not observed precisely, but a broadly comparable pattern was recorded in which a blade-like arch was associated with elevated tensile strain below the orbits (the cylindrical arch was associated with lowered tensile strain), presumably in association with the bending of the arches in the coronal plane due to the pull of the masseter muscle. What might explain these results?
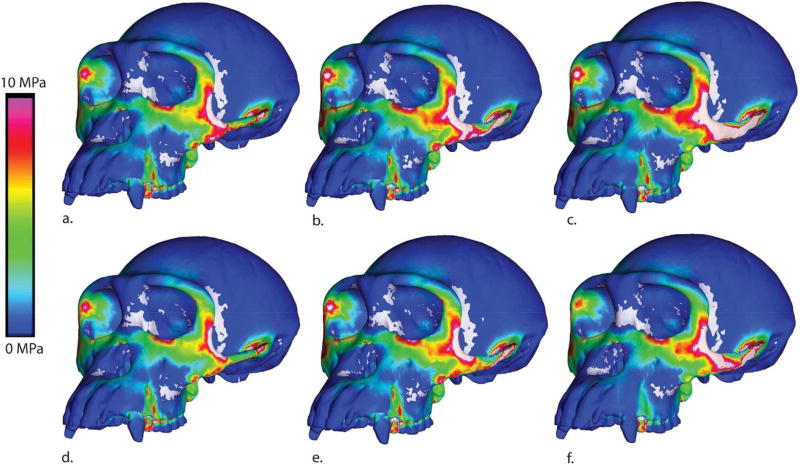
If this elevation in strain is an effect of an increase in load transfer from the temporalis and pterygoid muscles, we should be able to detect this pattern in cranial stresses when the models are loaded without the masseter muscle. To test this prediction we re-solved our models, simulating isolated muscle forces. Surprisingly, when the masseter load is removed, local and global stresses are nearly identical for all zygomatic shapes (Figure 12). In contrast, when only the masseter load is applied to the arch, an area of high stress is detected in the same region (extending from the postorbital zygomatic junction to the inferior orbital margin) that is highly strained in the models with taller arches (Figure 13). It is not clear why this should be the case, as the shape of the arch should have no effect on how the load generated by the masseter muscle is transmitted to the rest of the cranium. It is quite possible that the result reflects an artifact of our modeling process, in which changing the cross sectional shape of the arch leads to differences in the 3-D form of the area of attachment of the zygomatic arch with the rest of the cranium. In other words, simple beam mechanics cannot adequately describe the distribution of stresses at the zygomatic root due to the complex 3-D morphology of this attachment.
Figure 12.
Maximum principal stress colormap for models loaded without the masseter muscle
Figure 13.
Maximum principal stress colormap for models loaded by only the masseter muscle
It is difficult to conclude, therefore that variation in arch shape and composition, as modeled here, has any clear biomechanical consequences. Furthermore, we find that the arch does not conform to predictions of beam theory. This supports previous work in which authors suggest that although the zygomatic arch has the appearance of a simple beam, its structural behavior does not conform to a simple mechanical explanation (Herring et al., 1996; Teng et al 1997; Rafferty et al., 2000). It is possible that more extreme variation in arch shape, such as may be observed between different mammalian clades, may in fact have mechanical importance, but such an interpretation cannot be drawn from the present study.
Our models do not incorporate sutures or temporal fascia, structures that may have an effect on strain transmission in the arch (Curtis et al., 2011; Herring et al., 1993; Kupczik et al., 2007)., but at present, the extent to which our results are compromised by the absence of these structures, remains unclear.
Conclusion
Modifications to the cross sectional shape of the zygomatic arch of chimpanzees was found to have local effects on strain magnitude in the zygomatic arch but had few consistent global effects on patterns of craniofacial strain. Modification of the material properties of the zygomatic arch likewise had local effects but consistent global patterns did not emerge. As stated in previous studies, the zygomatic arch may look like a simple beam, but does not conform to simple beam mechanics (Hylander and Johnson 1997; Herring et al., 1996; Teng et al 1997; Rafferty et al., 2000). Furthermore, the zygomatic arch does not function as an isolated structure, loaded unidirectionally. Our results imply that the shape (or composition) of the zygomatic arch alone, does not have a profound effect on feeding mechanics. Rather, it is likely the entire suite of craniofacial characteristics and that effect the transmission of masticatory forces and bending resistance in the mammalian skull. FE modeling is a powerful tool that allows researchers to modify and test individual morphological features, but we should remain cautious when interpreting our results within the context of mechanical systems, and living organisms. This highlights the fact that while parceling out biomechanical effects of individual structures can be meaningful insofar as they provide a pieces of the puzzle, when possible, they should be combined with global mechanical, experimental and behavioral data if they are to provide a complete picture of mammalian craniofacial function.
Supplementary Material
Figure 6.
Minimum principal strain colormaps for all models. a: Cylindrical trabecular. b: Elliptical trabecular, c: Blade-like trabecular, d: Solid cylindrical, e: Solid elliptical, f: Solid blade-like.
Figure 7.
von Mises strain colormaps for all models. a: Cylindrical trabecular. b: Elliptical trabecular, c: Blade-like trabecular, d: Solid cylindrical, e: Solid elliptical, f: Solid blade-like.
Acknowledgments
Authors thank Qian Wang and Paul Dechow for the opportunity to participate in this special issue. This research was facilitated by the ongoing support of David Strait and colleagues Paul Dechow, Qian Wang, Callum Ross, Gerhard Weber, Kelli Tamvada, Justin Ledogar, Stefano Benazzi, Mark Spencer, Craig Byron, Barth Wright, Dennis Slice and Peter Lucas. The article benefitted from the insightful comments of David Strait, Adam Gordon, Olga Panagiotopoulou and Leslie Pryor. Authors thank staff at the Senckenberg Research Institute (Frankfurt am Main, Germany), First Zoological Department of the Natural History Museum (Vienna, Austria), UCL Anatomy Collection (London, UK), Functional Morphology and Evolution Research Unit of the Hull York Medical School (UK), Royal Museum of Central Africa (Tervuren, Belgium), Institut de Médecine et de Physiologie Spatiales (Toulouse, France), The Lincoln Park Zoo (Chicago, Illinois), Yerkes Primate Research Center at Emory University (Atlanta, Georgia; supported by NIH Base Grant RR00165) and Southwest National Primate Research Center (San Antonio, Texas; supported by NIH-NCRR grant P51 RR013986). This research was funded by grants from the National Science Foundation Physical Anthropology HOMINID program (NSF BCS 0725219, 0725183, 0725147, 0725141, 0725136, 0725126, 0725122, 0725078), the ‘Biomesh’ grant (NSF DBI 0743460), and EU FP6 Marie Curie Actions MRTN-CT-2005-019564 “EVAN.” The baseline chimpanzee finite element model (PC2+) is available for download at www.biomesh.org.
LITERATURE CITED
- Ashman RB, Rho JY, Turner CH. Anatomical variation of orthotropic elastic moduli of the human proximal tibia. J Biomech. 1989;22:895–900. doi: 10.1016/0021-9290(89)90073-0. [DOI] [PubMed] [Google Scholar]
- Attard MRG, Parr WCH, Wilson LAB, Archer M, Hand SJ, Rogers TL, Wroe S. Virtual reconstruction and prey size preference in the mid Cenozoic Thylacinid, Nimbacinus dicksoni (Thylacinidae, Marsupialia) PLOSOne. 2014:e93088. doi: 10.1371/journal.pone.0093088. [DOI] [PMC free article] [PubMed] [Google Scholar]
- Bramble DM. Origin of the mammalian feeding complex: models and mechanisms. Paleobiol. 1978;4(3):271–301. [Google Scholar]
- Buckland-Wright JC. Bone structure and the pattern of force transmission in the cat skull (Felis catus) J Morphol. 1978;155(1):35–61. doi: 10.1002/jmor.1051550104. [DOI] [PubMed] [Google Scholar]
- Christiansen P. Evolution of skull and mandible shape in cats (Carnivora: Felidae) PLOSOne. 2008;3(7):e2807. doi: 10.1371/journal.pone.0002807. [DOI] [PMC free article] [PubMed] [Google Scholar]
- Cox PG, Kirkham J, Herrel A. Masticatory biomechanics of the Laotian rock rat, Laonastes aenigmamus, and the function of the zygomaticomandibularis muscle. Peer J. 2013;1:e160. doi: 10.7717/peerj.160. [DOI] [PMC free article] [PubMed] [Google Scholar]
- Crandall SH, Dahl NC, Lardner TJ. An introduction to the mechanics of solids. The McGraw-Hill Companies; New Delhi: 2008. [Google Scholar]
- Currey JD. Bones: Structure and Mechanics. Princeton: Princeton University Press. Society for the Advancement of Orthodontics; 2002. [Google Scholar]
- Curtis N, Witzel U, Fitton L, O’Higgins P, Fagan M. The mechanical significance of the temporal fascia in Macaca fascicularis: An investigation using finite element analysis. Anat Rec. 2011;294(7):1178–1190. doi: 10.1002/ar.21415. [DOI] [PubMed] [Google Scholar]
- Davis JL, Dumont ER, Strait DS, Grosse IR. An efficient method of modeling material properties using a thermal diffusion analogy: An example based on craniofacial bone. PLoS ONE. 2011;6(2):e17004. doi: 10.1371/journal.pone.0017004. [DOI] [PMC free article] [PubMed] [Google Scholar]
- Dumont ER, Grosse IR, Slater GJ. Requirements for comparing the performance of finite element models of Biological Structures. J Theoretical Bio. 2009;256:96–103. doi: 10.1016/j.jtbi.2008.08.017. [DOI] [PubMed] [Google Scholar]
- Dumont ER, Piccirillo J, Grosse IR. Finite element analysis of biting behavior and bone stress in the facial skeletons of bats. Anat Rec. 2005;293:319–330. doi: 10.1002/ar.a.20165. [DOI] [PubMed] [Google Scholar]
- Endo H, Taru H, Yamamoto M, Arishima K, Sasaki M. Comparative morphology of themuscles of mastication in the giant panda and Asiatic black bear. Ann Anat. 2003;185:287–292. doi: 10.1016/S0940-9602(03)80043-2. [DOI] [PubMed] [Google Scholar]
- Figueirido B, Tseng ZJ, Serrano-Alarcón FJ, Martín-Serra A, Pastor JF. Three-dimensional computer simulations of feeding behavior in red and giant pandas relate skull biomechanics with dietary niche partitioning. Biol Lett. 2014;10:20140196. doi: 10.1098/rsbl.2014.0196. http://dx.doi.org/10/1098/rsbl.2014.0195. [DOI] [PMC free article] [PubMed] [Google Scholar]
- Figueirido B, Tseng ZJ, Serrano-Alarcón FJ, Martín-Serra A. Skull shape evolution in durophagous carnivorans. Evol. 2013;67:1975–1993. doi: 10.1111/evo.12059. [DOI] [PubMed] [Google Scholar]
- Figueirido B, Tseng ZJ, Serrano-Alarcón FJ, Palmqvist P. Geometric morphometrics shows differences and similarities in skull shape between the red and giant pandas. J Zool. 2012;286:293–302. doi: 10.1111/j.1469-7998.00879.x. [DOI] [Google Scholar]
- Freeman JA, Teng S, Herring SW. Rigid fixation and strain patterns in the pig zygomatic arch and suture. J Oral Maxillofac Surg. 1997;55:496–504. doi: 10.1016/s0278-2391(97)90701-1. [DOI] [PubMed] [Google Scholar]
- Grosse IR, Dumont ER, Coletta C, Tolleson A. Techniques for modeling muscle-induced forces in finite element models of skeletal structures. Anat Rec. 2007;290:1069–1088. doi: 10.1002/ar.20568. [DOI] [PubMed] [Google Scholar]
- Herring SW, Teng S, Huang X, Mucci RJ, Freeman J. Patterns of bone strain in the zygomatic arch. Anat Rec. 1996;246:446–457. doi: 10.1002/(SICI)1097-0185(199612)246:4<446::AID-AR4>3.0.CO;2-T. [DOI] [PubMed] [Google Scholar]
- Herring SW, Mucci RJ. In vivo strain in the cranial sutures: The zygomatic arch. J Morph. 1991;207:225–239. doi: 10.1002/jmor.1052070302. [DOI] [PMC free article] [PubMed] [Google Scholar]
- Herring SW, Rafferty KL, Liu ZJ, Marshall CD. Jaw muscles and the skull in mammals: the biomechanics of mastication. Comp Biochem and Phys A. 2001;131:207–219. doi: 10.1016/s1095-6433(01)00472-x. [DOI] [PubMed] [Google Scholar]
- Herring SW, Teng S, Huang X, Mucci RJ, Freeman J. Patterns of bone strain in the zygomatic arch. Anat Rec. 1996;246:446–457. doi: 10.1002/(SICI)1097-0185(199612)246:4<446::AID-AR4>3.0.CO;2-T. [DOI] [PubMed] [Google Scholar]
- Hylander WL, Picq PG, Johnson KR. Masticatory-stress hypothesis and the supraorbital region of primates. Am J Phys Anthropol. 1991a;86:1–36. doi: 10.1002/ajpa.1330860102. [DOI] [PubMed] [Google Scholar]
- Hylander WL, Johnson KR. In vivo bone strain patterns in the zygomatic arch of macaques and the significance of these patterns for functional interpretations of craniofacial form. Am J Phys Anthropol. 1997;102:203–232. doi: 10.1002/(SICI)1096-8644(199702)102:2<203::AID-AJPA5>3.0.CO;2-Z. [DOI] [PubMed] [Google Scholar]
- Juvinall RC, Kraige LG. Engineering Mechanics: Statics. 7. New York: John Wiley & Sons; 2012. [Google Scholar]
- Keyak JH, Rossi SA. Prediction of femoral fracture load using finite element models: An examination of stress-and strain- based failure models. J Biomech. 2000;33:209–214. doi: 10.1016/s0021-9290(99)00152-9. [DOI] [PubMed] [Google Scholar]
- Kupczik K, Dobson CA, Fagan MJ, Crompton RH, Oxnard CE, O’Higgins P. Assessing mechanical function of the zygomatic region in macaques: validation and sensitivity testing of finite element models. J Anat. 2007;210:41–53. doi: 10.1111/j.1469-7580.2006.00662.x. [DOI] [PMC free article] [PubMed] [Google Scholar]
- La Croix A, Zelditch ML, Shivik JA, Lundrigan BL, Holekamp KE. Ontogeny of feeding performance and biomechanics in coyotes. J Zool. 2011;286:301–315. doi: 10.1111/j.1469-7998.2011.00847.x. [DOI] [Google Scholar]
- Lanyon LE, Rubin CT. Static vs Dynamic loads as an influence on bone remodeling. J Biomech. 1984;17:987–905. doi: 10.1016/0021-9290(84)90003-4. [DOI] [PubMed] [Google Scholar]
- Merian JL, Kraige LG. Fundamentals of machine component design. Fifth. New York: John Wiley Sons; 2012. [Google Scholar]
- Milenkovic M, Sipetic VJ, Blagojevic J, Tatovic S, Vujosevic M. Skull variation in Dinaric-Balkan and Carpathian gray wolf populations revealed by geometric morphometric approaches. J Mammal. 2010;91(2):376–386. [Google Scholar]
- Rafferty KL, Herring SW, Artese F. Three-dimensional loading and the growth of the zygomatic arch. J Exp Biol. 2000;203:2093–2104. doi: 10.1242/jeb.203.14.2093. [DOI] [PMC free article] [PubMed] [Google Scholar]
- Rak Y. The Australopithecine Face. New York: The Academic Press; 1983. [Google Scholar]
- Schwartz-Dabney CL, Dechow PC. Accuracy of elastic property measurement in mandibular cortical bone is improved by using cylindrical specimens. J Biomech Eng. 2002;124:714–723. doi: 10.1115/1.1517567. [DOI] [PubMed] [Google Scholar]
- Schwartz-Dabney CL, Dechow PC. Variations in cortical material properties throughout the human dentate mandible. Am J Phys Anthropol. 2003;120:252–277. doi: 10.1002/ajpa.10121. [DOI] [PubMed] [Google Scholar]
- Smith AL, Benazzi S, Ledogar JA, Tamvada K, Pryor Smith LC, Weber GW, Spencer MA, Dechow PC, Grosse IR, Ross CF, Richmond BG, Wright BW, Wang Q, Byron C, Slice DE, Strait DS. Biomechanical Implications of Intraspecific Shape Variation in Chimpanzee Crania: Moving Toward an Integration of Geometric Morphometrics and Finite Element Analysis. Anat Rec. 2015;298:122–144. doi: 10.1002/ar.23074. [DOI] [PMC free article] [PubMed] [Google Scholar]
- Smith AL, Benazzi S, Ledogar JA, Tamvada K, Pryor Smith LC, Weber GW, Spencer MA, Lucas PW, Michael S, Shekeban A, Al-Fadhalah K, Almusallam AS, Dechow PC, Grosse IR, Ross CF, Madden RH, Richmond BG, Wright BW, Wang Q, Byron C, Slice DE, Wood S, Dzialo C, Berthaume MA, van Casteren A, Strait DS. The Feeding Biomechanics and Dietary Ecology of Paranthropus boisei. Anat Rec. 2015;298:145–167. doi: 10.1002/ar.23073. [DOI] [PMC free article] [PubMed] [Google Scholar]
- Pryor Smith LC. Master’s Thesis. University of Texas at Arlington; 2011. Trabecular bone variation in mod and upper craniofacial regions of four anthropoids. [Google Scholar]
- Strait DS, Richmond BG, Spencer MA, Ross CF, Dechow PD, Wood BA. Masticatory biomechanics and its relevance to early hominid phylogeny: An examination of palatal thickness using finite-element analysis. J Hum Evol. 2007;52:585–599. doi: 10.1016/j.jhevol.2006.11.019. [DOI] [PubMed] [Google Scholar]
- Strait DS, Wang Q, Dechow PC, Ross CF, Richmond BG, Spencer MA, Patel BA. Modeling elastic properties in finite element analysis: how much precision is needed to produce an accurate model? Anat Rec. 2005;283A:275–287. doi: 10.1002/ar.a.20172. [DOI] [PubMed] [Google Scholar]
- Strait DS, Weber GW, Neubauer S, Chalk J, Richmond BG, Spencer MA, Schrein C, Dechow PC, Ross CF, Lawn B, Hylander WL, Wang Q, Byron C, Slice DE, Smith AL. The feeding biomechanics and dietary ecology of Australopithecus africanus. Proc Natl Acad Sci USA. 2009;106:2124–2129. doi: 10.1073/pnas.0808730106. [DOI] [PMC free article] [PubMed] [Google Scholar]
- Strait DS, Grosse IR, Dechow PC, Smith AL, Wang Q, Weber GW, Neubauer S, Slice DE, Chalk J, Richmond BG, Lucas PW, Spencer MA, Schrein C, Wright BW, Byron C. The structural rigidity of the cranium of Australopithecus africanus: implications for the allometry of feeding biomechanics. Anat Rec. 2010;293:583–593. doi: 10.1002/ar.21122. [DOI] [PubMed] [Google Scholar]
- Teng A, Choi IW, Herring SW, Rensberger JM. Stereological Analysis of bone architecture in the pig zygomatic arch. Anat Rec. 1997;248(2):205. doi: 10.1002/(sici)1097-0185(199706)248:2<205::aid-ar7>3.0.co;2-r. [DOI] [PMC free article] [PubMed] [Google Scholar]
- Tobias PV. Olduvai Gorge. Vol. 2. Cambridge: Cambridge Univ Press; 1967. The cranium and maxillary dentition of Australopithecus (Zinjanthropus) boisei. [Google Scholar]
- Tseng ZJ. Cranial function in a late Miocene Dinocrocuta gigantean (Mammalia: Carnivora) revealed by comparative finite element analysis. Biol J Linnean Soc. 2009;96:51–67. [Google Scholar]
- Wang Q, Smith AL, Strait DS, Wright BW, Richmond BG, Grosse IR, Byron CD, Zapata U. The global impact of sutures assessed in a finite element model of a macaque cranium. Anat Rec. 2010;293:1477–1491. doi: 10.1002/ar.21203. [DOI] [PubMed] [Google Scholar]
- Witzel U, Preuschoft H, Sick H. The role of the zygomatic arch in the statics of the skull and its adaptive shape. Folia Primatol. 2004;75:202–218. doi: 10.1159/000078935. [DOI] [PubMed] [Google Scholar]
- Wroe S, Ferrara TL, McHenry CR, Curnoe D, Chamoli U. The craniomandibular mechanics of being human. Proc R Soc B. 2010;277:3579–3586. doi: 10.1098/rspb.2010.0509. [DOI] [PMC free article] [PubMed] [Google Scholar]
- Zienkiewicz OC, Taylor RL, Zhu JZ. The finite element method: its basis and fundamentals. 6. Amsterdam: Butterworth-Heinemann; 2005. [Google Scholar]
Associated Data
This section collects any data citations, data availability statements, or supplementary materials included in this article.


