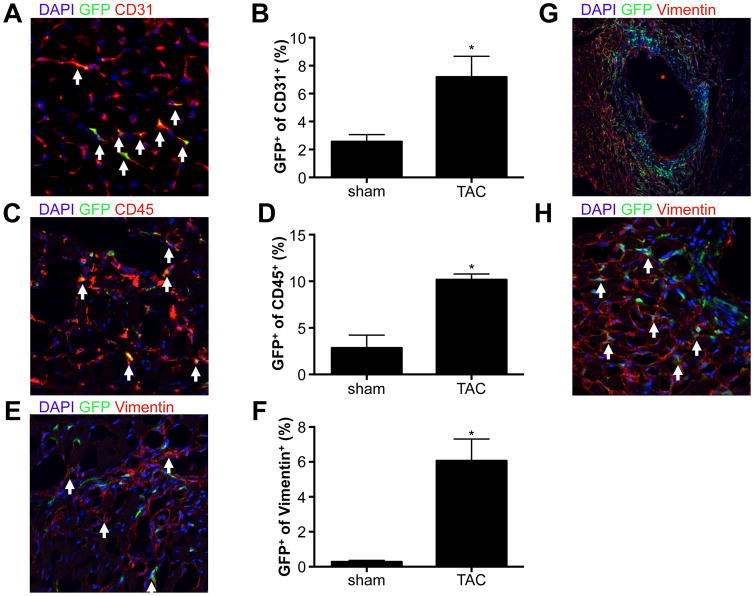
Figure 3. Non-cardiomyocyte lineages are enhanced in response to TAC.
A. Representative immunohistochemistry image of cardiac section stained for DAPI (blue) and CD31, showing overlap of GFP expressing cells with CD31. B. Quantification of c-kit derived CD31+ cells. N=3 and 3, *p<0.05 C. Representative immunohistochemistry image of cardiac section stained for DAPI (blue) and CD45, showing overlap of GFP expressing cells with CD45. D. Quantification of c-kit derived CD45+ cells. N=3 and 3, *p<0.05 E. Representative immunohistochemistry image of cardiac section stained for DAPI (blue) and vimentin, showing overlap of GFP expressing cells with vimentin. F. Quantification of c-kit derived vimentin+ cells (only interstitial cells are quantified). N=3 and 3, *p<0.05 G and H. Perivascular GFP+ (green) cells co-stained with vimentin (red) in low (G) and high (H) power magnification. A, C, E and H: white arrows show overlap between antibody stain and GFP expressing cells.

